5060
In vivo primary sensorimotor cortex glutathione does not differ in autistic children1The Russel H. Morgan Department of Radiology and Radiological Science, Johns Hopkins University School of Medicine, Baltimore, MD, United States, 2F.M. Kirby Research Center for Functional Brain Imaging, Kennedy Krieger Institute, Baltimore, MD, United States, 3Center for Neurodevelopmental and Imaging Research, Kennedy Krieger Institute, Baltimore, MD, United States, 4Department of Forensic and Neurodevelopmental Sciences, Sackler Institute for Translational Neurodevelopment, Institute of Psychiatry, Psychology, and Neuroscience, King's College London, London, United Kingdom, 5MRC Centre for Neurodevelopmental Disorders, King’s College London, London, United Kingdom, 6Department of Neurology, The Johns Hopkins University School of Medicine, Baltimore, MD, United States, 7Department of Psychiatry and Behavioral Sciences, The Johns Hopkins University School of Medicine, Baltimore, Baltimore, MD, United States
Synopsis
Keywords: Psychiatric Disorders, Spectroscopy, Autism
Redox imbalance has been suggested as a pathophysiological factor in autism spectrum disorder (ASD). Edited MRS can be used to measure levels of glutathione, the most abundant redox compound in the brain. This study aims to compare glutathione levels in autistic children and typically developing children (TDC). Edited data were collected from the primary sensorimotor cortex (SM1) in 34 children with ASD and 31 TDC and quantified using Osprey. No difference was found in GSH levels in the SM1 between these two groups.Introduction
Autism spectrum disorder (ASD, or autism) is characterized by difficulties in communication and social interaction, along with restrictive and repetitive motor behaviors and atypical sensory experiences1,2. The prevalence of autism is estimated to be 1 out of 44 children, with higher prevalence in boys3,4. While the autism diagnosis is well-defined, the underlying mechanisms are likely diverse and still poorly understood. Recent work5 has suggested that oxidative stress (OS) arising from both genetic and environmental factors may contribute to the neurophysiology of autism. Increased OS (resulting from impaired deactivation of damaging free radicals) in neurodevelopment could be a primary contributor of difficulties seen in autism5. Autistic individuals may exhibit differences in redox signaling, particularly in glutathione (GSH) metabolism6. As the most abundant endogenous antioxidant in the brain, GSH guards against cellular damage by serving as an electron donor to neutralize reactive oxygen species (ROS).Edited MRS (e.g. MEGA-PRESS7 and Hadamard-encoded HERMES8) is widely used for the selective detection of low-concentration metabolites, including GSH9,10. Findings from prior MRS studies to assess GSH in autism have been inconsistent9,10. In the study, we used Hadamard-edited MRS (HERMES) to measure GSH levels in the primary sensorimotor cortex (SM1), which plays crucial roles in motor control and learning12,13 and in the integration of sensory and motor information, in a large pediatric cohort. We hypothesized that GSH would be significantly decreased in autism compared to TDC.
Methods
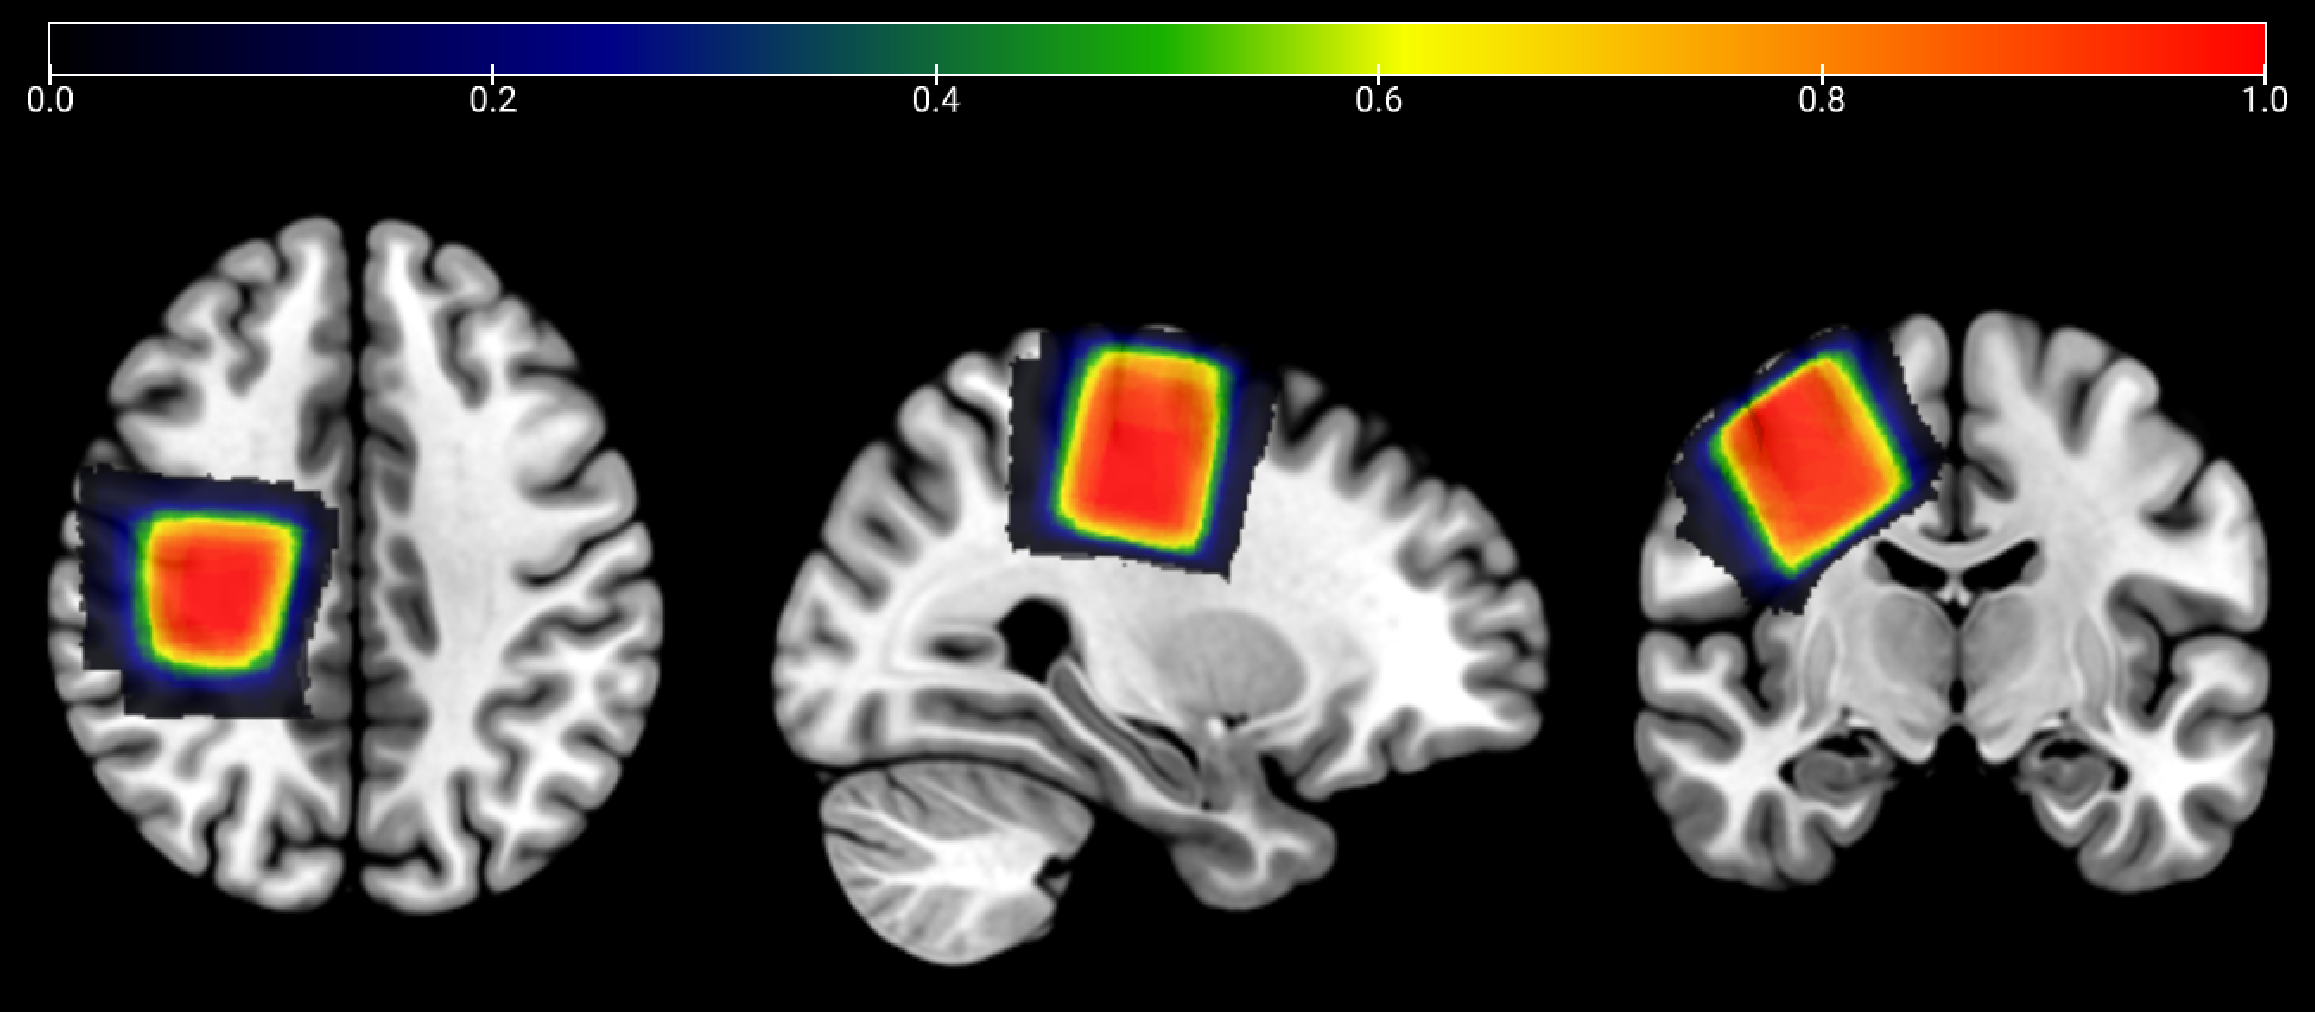
MRS data were collected on a Philips 3T Ingenia Elition RX scanner (Philips Healthcare, Best, the Netherlands) equipped with a 32-channel head coil. The scanning protocol included a 1 mm3 isotropic T1 MPRAGE for voxel placement and segmentation. HERMES spectra were acquired in 34 children with ASD and 31 TDC using the following parameters: PRESS localization; TR/TE 2000/80 ms; 30 x 30 x 30 mm3 voxel in SM1 as shown in Figure 1, 320 transients (9 min); 20 ms editing pulses applied at 1.9 ppm and 4.56 ppm following a HERMES scheme8; 2048 datapoints sampled at 2 kHz. All data were analyzed in Osprey14 (2.4.0), using linear-combination modeling to generate tissue-corrected water-referenced GSH levels15. Statistical analyses were conducted in RStudio (version 4.2.1)16. Metabolite levels were compared using a two-tailed independent samples t test, with a significance threshold of p<0.05.Results
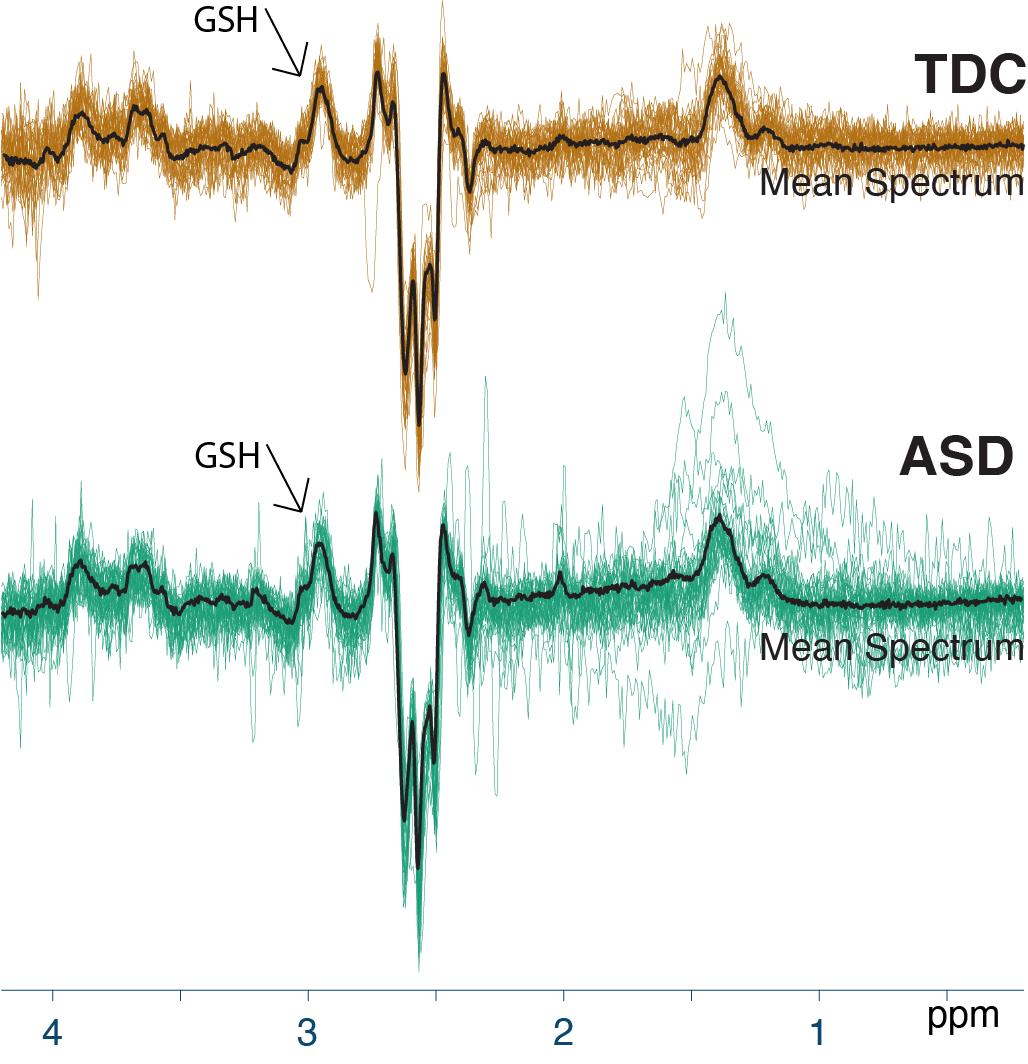
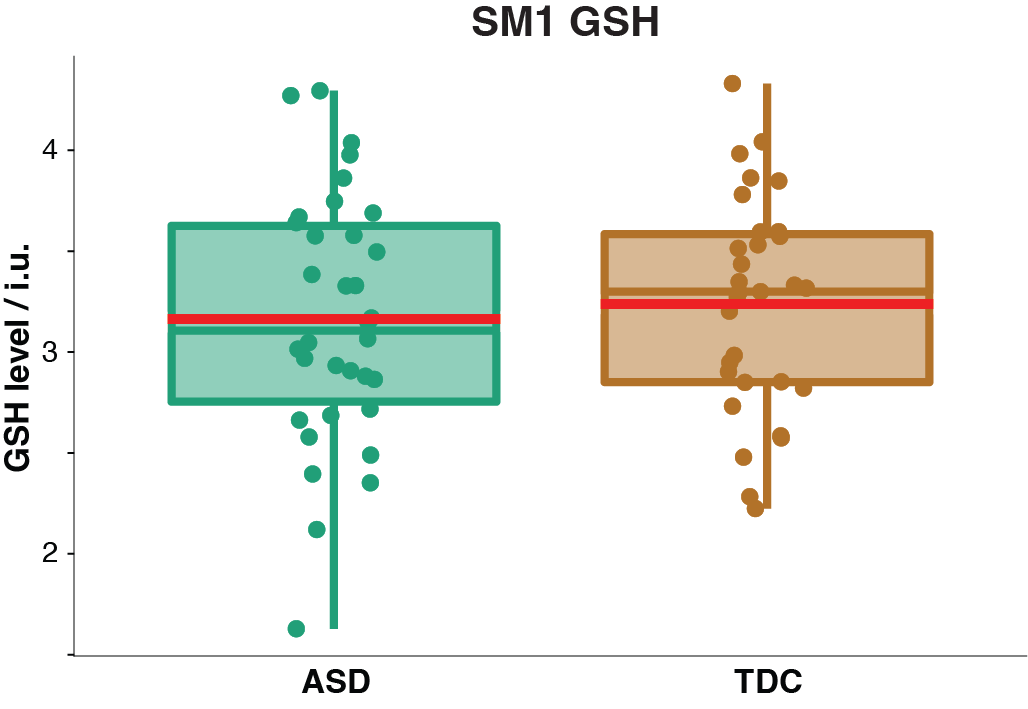
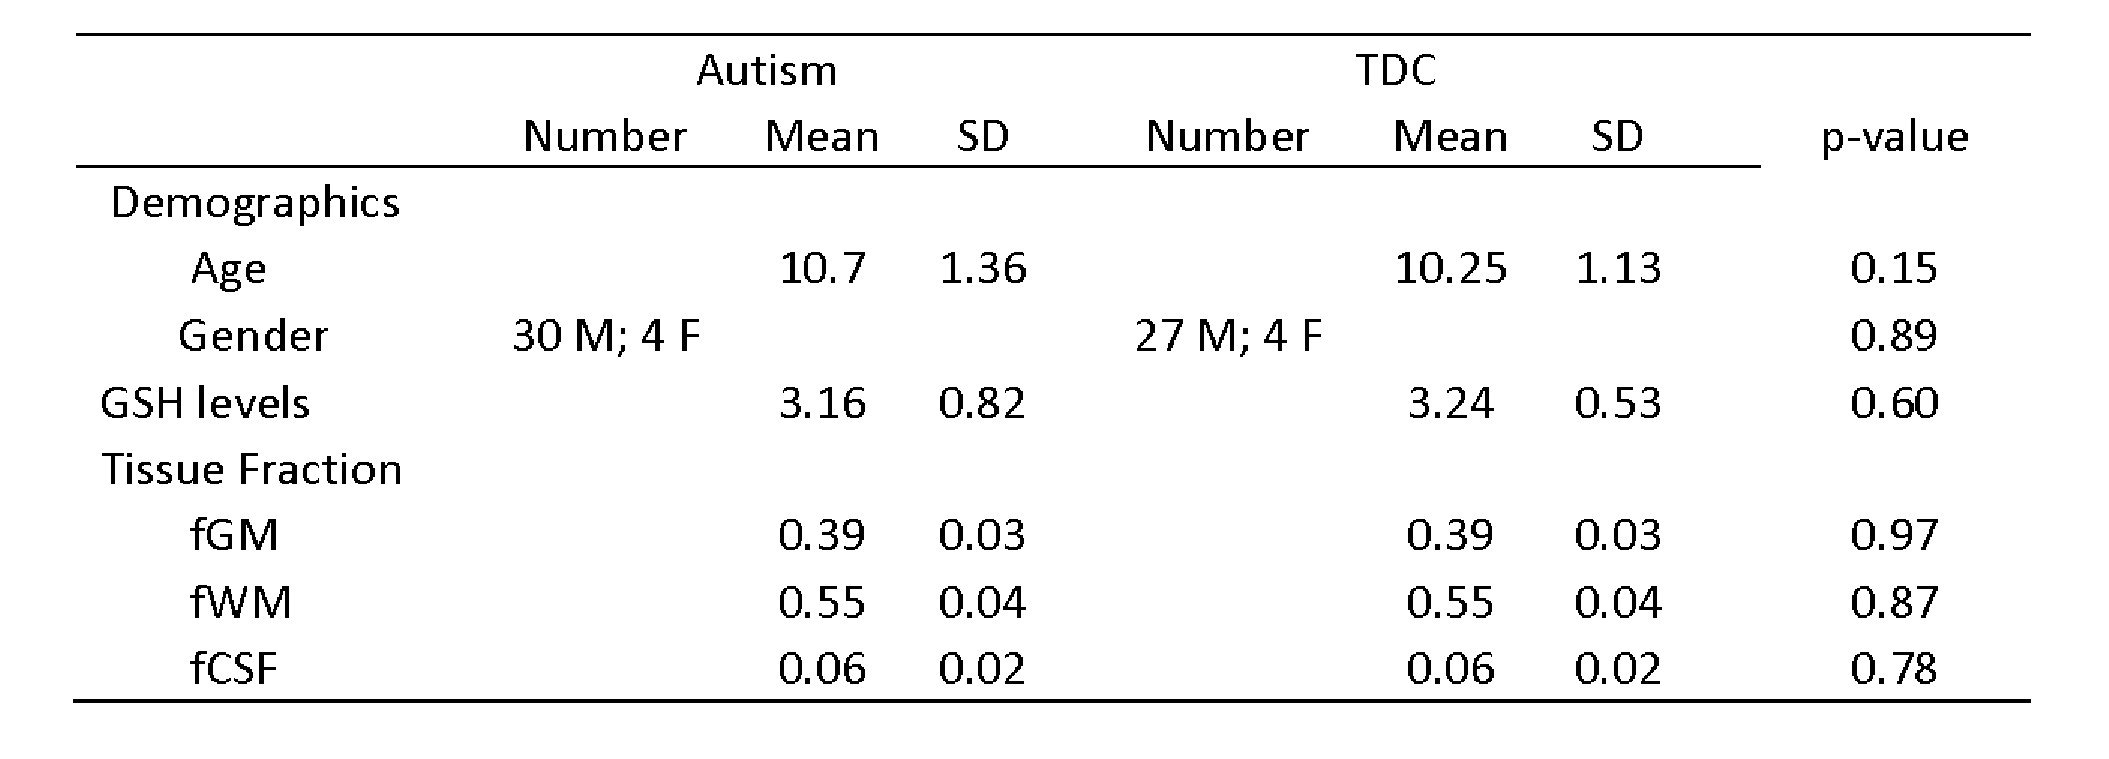
Demographic data, voxel tissue segmentation, and metabolite levels are presented in Table 1. Autistic and TDC did not differ significantly in age (p = 0.15), or sex (p = 0.89). Voxel tissue fractions were not significantly different between groups: fGM p = 0.97; fWM p = 0.87; and fCSF p = 0.78. Edited difference spectra, overlaid for all subjects in each group, are presented in Figure 2. GSH levels are visualized in Figure 3. No significant difference was found in GSH levels between the groups (p = 0.60).Discussion
In this study, we aimed to investigate whether autistic children have reduced SM1 GSH levels compared to TDC; our results did not show the hypothesized effect. While this finding conflicts with prior reports of reduced GSH levels in plasma in children with autism17,18 our results agree with previous MRS studies in adults with ASD showing no difference in brain GSH in cortical and subcortical brain regions9,10, and extends the result into childhood (8 - 12 years old). However, as autism symptoms typically emerge at a younger age (around 2 years old), it could be that GSH differences between autism and TDC would only be detectable in earlier childhood. Future work should recruit autism samples with a wider age range starting in early childhood, that more completely capture the childhood years.GSH is generally more abundant in astrocytes, with higher levels in gray matter than white matter19,20. One post-mortem study of pediatric brain tissue showed decreased GSH levels in the gray-matter-rich cerebellum and temporal cortex in autism, but not in white-matter-rich frontal, parietal and occipital cortices21. It might therefore be that GSH is altered in a region-specific manner. In the present work, the SM1 region had more white matter than gray matter; thus, the lack of group differences reported here could be due in part to the brain region investigated. Future studies should aim to capture a more complete neurometabolic profile of children with and without autism. Brain metabolite levels might be different among autistic children with different symptom severity22. In our planned future work on this dataset, we will additionally consider ASD traits in out statistical analyses.
Conclusion
In summary, we found that autistic children do not show significantly different levels of GSH in SM1 compared to TDC.Acknowledgements
This work was supported by NIH grants P41 EB031771, R01 EB016089, R01 EB023963, R21 AG060245, R00 AG062230, K00AG068440, R21 HD100869 and R01 MH106564.References
1. Lord C, Elsabbagh M, Baird G, Veenstra-Vanderweele J. Autism spectrum disorder. Lancet Lond Engl. 2018;392(10146):508-520. doi:10.1016/S0140-6736(18)31129-2
2. Guze SB. Diagnostic and Statistical Manual of Mental Disorders, 4th ed. (DSM-IV). Am J Psychiatry. 1995;152(8):1228-1228. doi:10.1176/ajp.152.8.1228
3. Pinto D, Pagnamenta AT, Klei L, et al. Functional impact of global rare copy number variation in autism spectrum disorders. Nature. 2010;466(7304):368-372. doi:10.1038/nature09146
4. Bjørklund G, Tinkov AA, Hosnedlová B, et al. The role of glutathione redox imbalance in autism spectrum disorder: A review. Free Radic Biol Med. 2020;160:149-162. doi:10.1016/j.freeradbiomed.2020.07.017
5. Nadeem A, Ahmad SF, Al-Harbi NO, et al. Increased oxidative stress in the cerebellum and peripheral immune cells leads to exaggerated autism-like repetitive behavior due to deficiency of antioxidant response in BTBR T + tf/J mice. Prog Neuropsychopharmacol Biol Psychiatry. 2019;89:245-253. doi:10.1016/j.pnpbp.2018.09.012
6. Bjørklund G, Doşa MD, Maes M, et al. The impact of glutathione metabolism in autism spectrum disorder. Pharmacol Res. 2021;166:105437. doi:10.1016/j.phrs.2021.105437
7. Mescher M, Merkle H, Kirsch J, Garwood M, Gruetter R. Simultaneous in vivo spectral editing and water suppression. NMR Biomed. 1998;11(6):266-272. doi:10.1002/(SICI)1099-1492(199810)11:6<266::AID-NBM530>3.0.CO;2-J
8. Saleh MG, Wang M, Mikkelsen M, et al. Simultaneous edited MRS of GABA, glutathione, and ethanol. NMR Biomed. 2020;33(4):e4227. doi:10.1002/nbm.4227
9. Durieux AMS, Horder J, Mendez MA, et al. Cortical and subcortical glutathione levels in adults with autism spectrum disorder. Autism Res Off J Int Soc Autism Res. 2016;9(4):429-435. doi:10.1002/aur.1522
10. Endres D, Tebartz van Elst L, Meyer SA, et al. Glutathione metabolism in the prefrontal brain of adults with high-functioning autism spectrum disorder: an MRS study. Mol Autism. 2017;8:10. doi:10.1186/s13229-017-0122-3
11. Floyer-Lea A, Wylezinska M, Kincses T, Matthews PM. Rapid Modulation of GABA Concentration in Human Sensorimotor Cortex During Motor Learning. J Neurophysiol. 2006;95(3):1639-1644. doi:10.1152/jn.00346.2005
12. Ikeda A, Ohara S, Matsumoto R, et al. Role of primary sensorimotor cortices in generating inhibitory motor response in humans. Brain. 2000;123(8):1710-1721. doi:10.1093/brain/123.8.1710
13. Oeltzschner G, Zöllner HJ, Hui SCN, et al. Osprey: Open-source processing, reconstruction & estimation of magnetic resonance spectroscopy data. J Neurosci Methods. 2020;343:108827. doi:10.1016/j.jneumeth.2020.108827
14. Gasparovic C, Chen H, Mullins PG. Errors in 1 H-MRS estimates of brain metabolite concentrations caused by failing to take into account tissue-specific signal relaxation. NMR Biomed. 2018;31(6):e3914. doi:10.1002/nbm.3914
15. R Core Team. R: A Language and Environment for Statistical Computing. Vienna. doi:10.1108/eb003648
16. Kern J, Geier D, Adams J, Garver C, Audhya T, Geier M. A clinical trial of glutathione supplementation in autism spectrum disorders. 2011;17(12):CR677-CR682. doi:10.12659/MSM.882125
17. Wink LK, Adams R, Wang Z, et al. A randomized placebo-controlled pilot study of N-acetylcysteine in youth with autism spectrum disorder. Mol Autism. 2016;7:26. doi:10.1186/s13229-016-0088-6
18. Rossignol DA, Frye RE. Mitochondrial dysfunction in autism spectrum disorders: a systematic review and meta-analysis. Mol Psychiatry. 2012;17(3):290-314. doi:10.1038/mp.2010.136
19. Ford TC, Crewther DP. A Comprehensive Review of the 1H-MRS Metabolite Spectrum in Autism Spectrum Disorder. Front Mol Neurosci. 2016;9. Accessed October 25, 2022. https://www.frontiersin.org/articles/10.3389/fnmol.2016.00014
20. Chauhan A, Audhya T, Chauhan V. Brain Region-Specific Glutathione Redox Imbalance in Autism. Neurochem Res. 2012;37(8):1681-1689. doi:10.1007/s11064-012-0775-4
21. He JL, Oeltzschner G, Mikkelsen M, et al. Region-specific elevations of glutamate + glutamine correlate with the sensory symptoms of autism spectrum disorders. Transl Psychiatry. 2021;11(1):411. doi:10.1038/s41398-021-01525-1
Figures