5059
Obsessive-compulsive symptom-related brain connectivity associated with calcium homeostasis in first-episode drug-naïve schizophrenia1Huaxi MR Research Center (HMRRC), West China Hospital of Sichuan University, Chengdu, China, 2The Clinical Hospital of Chengdu Brain Science Institute, University of Electronic Science and Technology of China, Chengdu, China
Synopsis
Keywords: Psychiatric Disorders, Psychiatric Disorders, schizophrenia
The present study recruited a Chinese Han cohort of first-episode patients with never-treated schizophrenia. Partial least squares regression was used to investigate the functional connectivity specifically related to obsessive-compulsive symptom and the results mainly involved the frontal lobe, insula, temporal lobe, and Rolandic operculum. Using association rules, we dug that Calcium level exhibited a bidirectional effect with the strength of the connection between the right Rolandic operculum and the right insula, especially regarding PCDHGB1 expression in the right Rolandic operculum.Background
Obsessive-compulsive symptom (OCS) is frequently present in schizophrenia 1,2 and increases the rates of hospitalization and suicide attempts 3-5. Understanding the clinical and neurobiological significance of OCS in schizophrenia justifies the introduction of this information into the future classification of schizophrenia spectrum disorders.Previous resting-state functional magnetic resonance imaging (rs-fMRI) studies of functional connectivity (FC) have investigated whether frontal-subcortical dysfunction is involved in the pathophysiology of schizophrenic symptoms and OCS 6-9. These studies suggested that schizophrenia and obsessive-compulsive disorder might share brain structure and function abnormalities. However, it remains unclear which FC abnormalities are specifically related to OCS in schizophrenia.
Moreover, as for the underlying substrates of the presence of OCS, although the voltage-gated cadherin signaling pathway is believed to participate in this process 10,11, how Calcium homeostasis affects brain function and OCS manifestation is not clear.
Objective
The presence of OCS in schizophrenia patients is frequent, yet there is considerable ambiguity regarding the brain circuitry specifically involved in the development of OCS in schizophrenia. Multiple lines of evidence reveal an overrepresentation of the voltage-gated cadherin signalling gene network in rare variants associated with OCS.To investigate the brain functional alterations specifically related to OCS in schizophrenia patients and the role of calcium homeostasis in this psychopathological process, we detected FC specifically related to OCS, evaluated how serum calcium affected OCS-related FC, and further discussed whether the cadherin signalling pathway affects calcium homeostasis across brain regions in patients with first-episode drug-naïve schizophrenia.
Methods
The present study recruited forty-one first-episode drug-naïve schizophrenia (FDNS) patients and sixty-eight sex- and age-matched healthy controls (HC) from the Chengdu Mental Health Center. They were evaluated for schizophrenia symptoms through the Positive and Negative Syndrome Scale 12, OCS severity using Item 21 in the Hamilton Depression Scale 24 items 13, and resting-state FC 14. We also assayed total serum calcium (tCa) levels among schizophrenia patients. Feature FC related to OCS severity was screened by partial least squares (PLS) regression, and those features significantly correlated with tCa were further filtered. Leave-one-out cross-validation was used to avoid overfitting and the number of principal components with the lowest mean square prediction error value was defined as the number of components selected in the final model. Association rules were used to reveal the interdependence and connection between FC strength and tCa levels based on support, confidence and lift. Finally, we employed Pearson correlation analysis between the gene expression list of the cadherin signalling pathway (P00012) and FC strength.Results
260 FCs (3 increased and 257 decreased in the FDNS group) passed the two-sample t test (q <0.05, FDR corrected) between the FDNS and HC groups, in which 17 FCs significantly related to the OCS score (q <0.05 after FDR correlation) based on Spearman’s correlation analysis were included in the PLS regression run as a 1-component model (R2= 0.2867, RMSE= 0.6023) by LOO. Finally, we included 12 FCs that met q <0.05 (FDR correlation), as shown in Figure 1.A significant negative Spearman’s correlation was noted between tCa concentration and OCS severity (r = -.327, p=.037), and significant positive Pearson’s correlations were noted between tCa concentration and the FC between the right Rolandic operculum (R.ROL) and insula (R.INS) (r =.325, p =.038), and between the left orbital middle frontal gyrus (L.orbMFG) and right middle cingulate cortex (R.MCC) (r =.410, p =.008). As Figure 2 shows, patients with higher OCS scores presented lower tCa concentrations and lower FC in the L.orbMFG-R.MCC and R.ROL-R.INS. Moreover, strong bidirectional interactions were noted between decreased tCa and increased FC in the L.OrbMFG-R.MCC or decreased FC in R.ROL-R.INS ({“R.ROL-R.INS”=[0.118,0.544]}→{tCa=[2.36,2.54]}, support =0.195, confidence =0.571, lift =1.464; {tCa=[2.36,2.54]} →{“R.ROL-R.INS”=[0.118,0.544]} , support =0.195, confidence =0.500, lift =1.464; {tCa=[2.12,2.28)} →{“R.ROL-R.INS”=[-0.302,-0.0436)} , support =0.146, confidence =0.462, lift =1.352; {“R.ROL-R.INS”=[-0.302,-0.0436)} →{tCa=[2.12,2.28)} , support =0.146, confidence =0.429, lift =1.352; {tCa=[2.12,2.28)} →{“L.OrbMFG-R.MCC”=[-0.179,0.172)} , support =0.195, confidence =0.615, lift =1.802; {“L.OrbMFG-R.MCC”=[-0.179,0.172)} →{tCa=[2.12,2.28)} , support =0.195, confidence =0.571, lift =1.802; {“L.OrbMFG-R.MCC”=[0.39,0.711]} →{tCa=[2.36,2.54]} , support =0.195, confidence =0.571, lift = 1.464; {tCa=[2.36,2.54]} →{“L.OrbMFG-R.MCC”=[0.39,0.711]} , support =0.195, confidence =0.500, lift =1.464.). We also found strong significant negative Pearson’s correlations between cadherin signalling-related gene expression and FCs relevant to R.ROL and R.INS, especially regarding Protocadherin Gamma-B1 (PCDHGB1) gene expression in R.ROL (r = -.5875, p =.0082).
Conclusions
In conclusion, we identified OCS-specific FC in the FDNS mainly involving the frontal lobe, insula, temporal lobe, and Rolandic operculum. The strengths of the R.ROL-R.INS and L.OrbMFG-R.MCC connections exhibited a bidirectional effect with serum tCa levels, indicating that dysregulated calcium homeostasis is involved in the psychopathological basis of OCS in the early course of schizophrenia.Our findings addressed the bidirectional effect of calcium on pathological brain circuitry specifically involved in the development of OCS in schizophrenia, indicating that dysregulated calcium homeostasis is involved in the psychopathological basis of OCS in the early course of schizophrenia. This is essential for understanding the specific brain functional connectivity alteration relevant to OCS and its underlying homeostasis substrate in schizophrenia.
Acknowledgements
We thank the Chengdu Mental Health Center for giving us the opportunity to recruit our patient sample at their institution. We also greatly thank all patients and their families for the generous collaboration and engagement on the research project.
This study was supported by the National Key R&D Program of China (Project Nos. 2022YFC2009901, 2022YFC2009900), the National Natural Science Foundation of China (Grant Nos. 8212018014, 82071908, 81761128023, and 82101998), CAMS Innovation Fund for Medical Sciences(Project No. 2021-I2M-C&T-A-022), Sichuan Science and Technology Program (Grant Nos. 2021JDTD0002), Post-Doctor Research Project, West China Hospital, Sichuan University (Grant No. 2020HXBH005), and 1.3.5 Project for Disciplines of Excellence, West China Hospital, Sichuan University (Project Nos. ZYYC08001 and ZYJC18020). DR.Lui acknowledges the support from Humboldt Foundation Friedrich Wilhelm Bessel Research Award and Chang Jiang Scholars (Program No. T2019069). The funders had no role in study design, data collection and analysis, decision to publish, or preparation of the manuscript.
References
1 Achim, A. M. et al. How prevalent are anxiety disorders in schizophrenia? A meta-analysis and critical review on a significant association. Schizophrenia bulletin 37, 811-821 (2011).
2 Schirmbeck, F., Swets, M. & de Haan, L. in Obsessive-compulsive symptoms in schizophrenia 47-61 (Springer, 2015).
3 Poyurovsky, M. et al. Obsessive-compulsive symptoms in schizophrenia: implications for future psychiatric classifications. Comprehensive psychiatry 53, 480-483 (2012).
4 de Haan, L., Sterk, B., Wouters, L. & Linszen, D. H. The 5-year course of obsessive-compulsive symptoms and obsessive-compulsive disorder in first-episode schizophrenia and related disorders. Schizophrenia Bulletin 39, 151-160 (2013).
5 Simeon, R. C. X. C. D. Relationships between obsessive-compulsive symptomatology and severity of psychosis in schizophrenia: a systematic review and meta-analysis. The Journal of clinical psychiatry 69, 0-0 (2008).
6 Chamberlain, S. R. et al. Orbitofrontal dysfunction in patients with obsessive-compulsive disorder and their unaffected relatives. Science 321, 421-422 (2008).
7 Menzies, L. et al. Integrating evidence from neuroimaging and neuropsychological studies of obsessive-compulsive disorder: the orbitofronto-striatal model revisited. Neuroscience & Biobehavioral Reviews 32, 525-549 (2008).
8 Kang, D.-H. et al. Volumetric investigation of the frontal-subcortical circuitry in patients with obsessive-compulsive disorder. The Journal of neuropsychiatry and clinical neurosciences 16, 342-349 (2004).
9 Bonelli, R. M. & Cummings, J. L. Frontal-subcortical circuitry and behavior. Dialogues in clinical neuroscience 9, 141 (2007).
10 Consortium, C.-D. G. o. t. P. G. Identification of risk loci with shared effects on five major psychiatric disorders: a genome-wide analysis. The Lancet 381, 1371-1379 (2013).
11 O'Connell, K. S., McGregor, N. W., Lochner, C., Emsley, R. & Warnich, L. The genetic architecture of schizophrenia, bipolar disorder, obsessive-compulsive disorder and autism spectrum disorder. Molecular and Cellular Neuroscience 88, 300-307 (2018).
12 Kay, S. R., Fiszbein, A. & Opler, L. A. The positive and negative syndrome scale (PANSS) for schizophrenia. Schizophrenia bulletin 13, 261-276 (1987).
13 Hamilton. A rating scale for depression. J Neurol Neurosurg Psychiatry 23, 56-62 (1960).
14 Cao, H. et al. Toward Leveraging Human Connectomic Data in Large Consortia: Generalizability of fMRI-Based Brain Graphs Across Sites, Sessions, and Paradigms. Cereb Cortex 29, 1263-1279, doi:10.1093/cercor/bhy032 (2019).
Figures
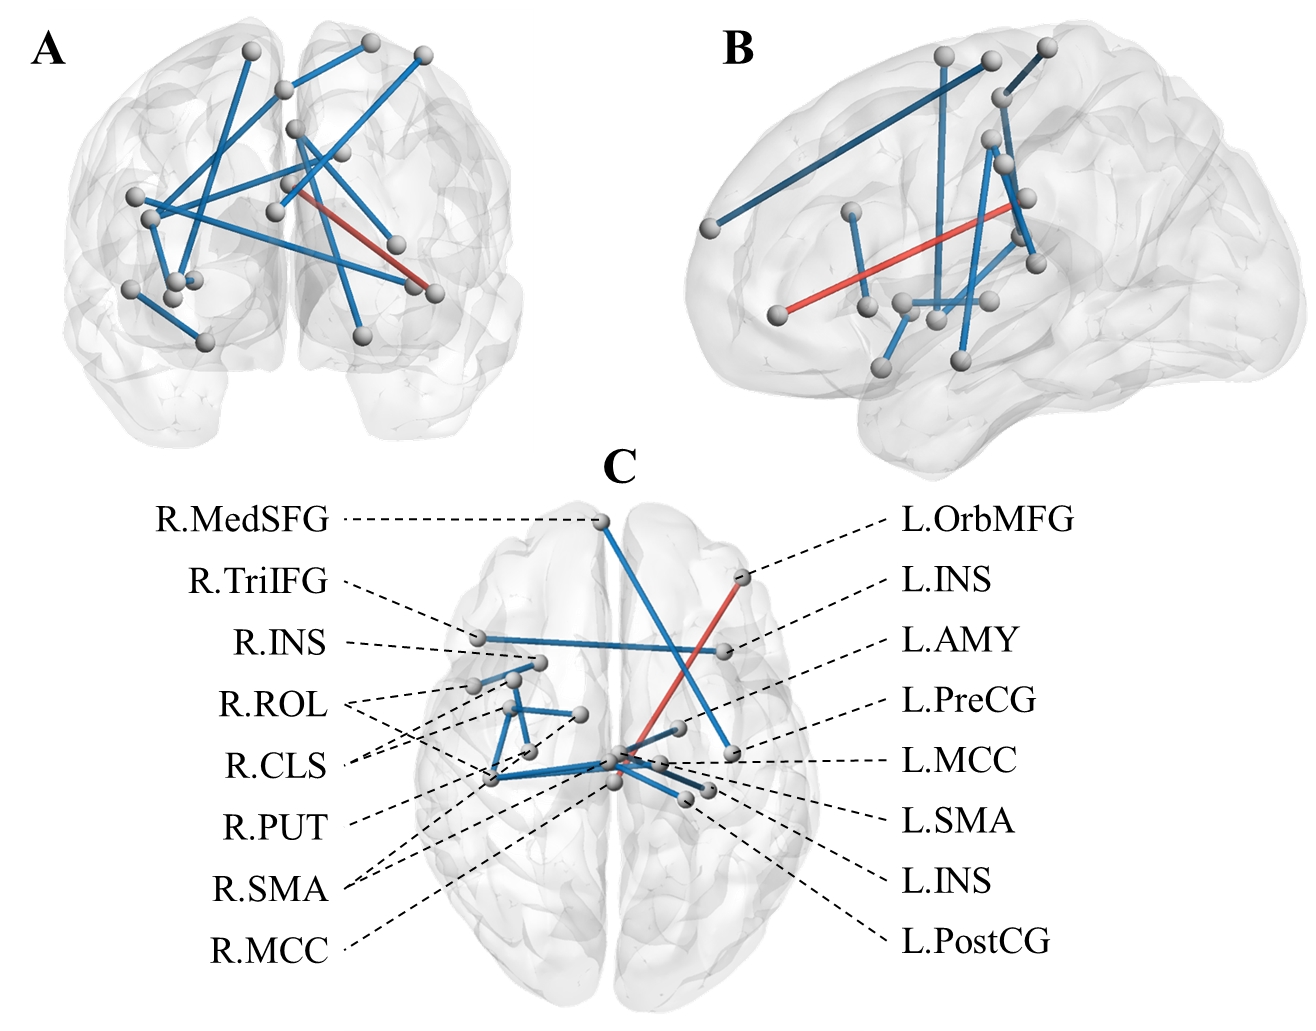
Figure 1. OCS-specific functional connectivity with significant differences.
Abbreviations: R, Right; L, Light; MCC, middle cingulate cortex; ROL, Rolandic operculum; PostCG, Postcentral gyrus; SMA, Supplementary motor area; PreCG, precentral gyrus; MedSFG, superior frontal gyrus, medial; OrbMFG, middle frontal gyrus, orbital part; CLS, central sulcus; INS, insula; AMY, amygdala; TriIFG, inferior frontal gyrus, triangularis; PUT, putamen.
The blue and sticky sticks indicate decreased and increased FC strength in the FDNS group, respectively.
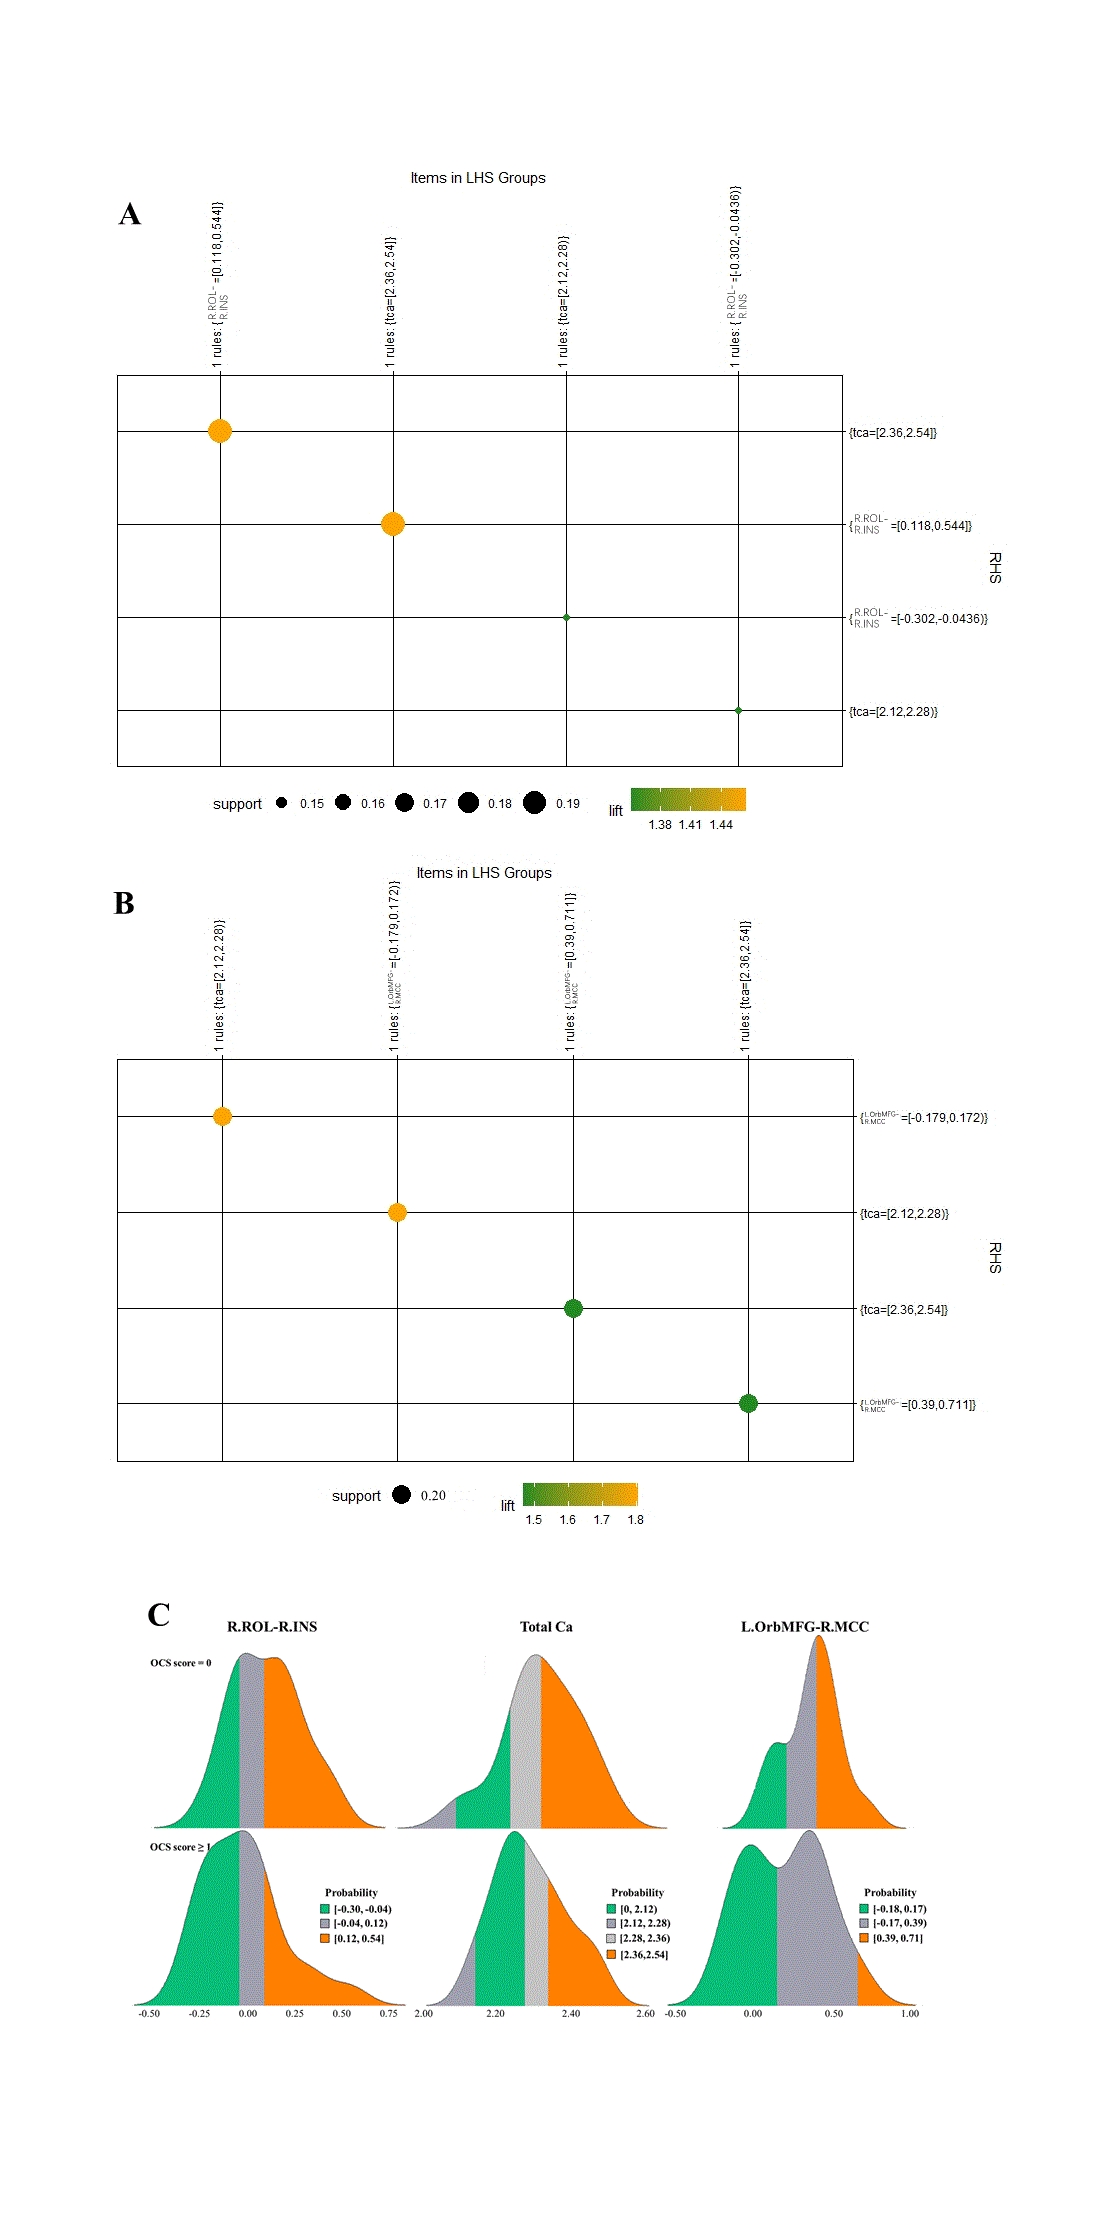
Figure 2: Key association rules between FC and tCa in FDNS.
Matrix display diagram show association rules between tCa and (A) R.ROL-R.INS or (B) L.OrbMFG-R.MCC. Here, the order of rules is based on the principle of confidence value from high to low. The size and colour of the dot represents the size of the support value and the lift value, respectively. (C) Ridge plots display the interpretability of association rules between FC and tCa. Green and orange represent the proportion of FDNS patients divided by OCS score in the rule items, respectively.