5057
Diagnosis of Autism Spectrum Disorder Using Age-Specific Brain Morphological Features1Dalian University of Technology, Dalian,Liaoning, China
Synopsis
Keywords: Gray Matter, Multimodal, Autism Spectrum Disorder (ASD); multiple kernel learning (MKL); structural magnetic resonance imaging (sMRI); multi-feature-based network (MFN)
Autism Spectrum Disorder (ASD) diagnosis based on sMRI can be more objective than clinical scales due to high heterogeneity. However, accuracies on large heterogeneous datasets were not high. We used age-specific features based on ABIDE II dataset to distinguish ASD and control. In the meanwhile, we combined two kinds of age-specific structural features including regional and interregional features using multiple kernel learning (MKL) to complement each other. Results showed that our procedure achieved accuracy of more than 85 percent on discriminating ASD from control.Introduction
Autism Spectrum Disorder (ASD) diagnosis based on sMRI can be more objective than clinical scales due to high heterogeneity in etiology and symptom severity. Many studies reported remarkable classification accuracies based on anatomical features on small sample1,2. However, accuracies on large heterogeneous datasets were not high3,4. This may be because feature selection is not specific enough and feature combination is not effective enough. In this paper, we used age-specific features based on ABIDE II dataset5 to distinguish ASD and control. In the meanwhile, we combined two kinds of age-specific structural features including regional and interregional features using multiple kernel learning (MKL) to complement each other. Results showed that our procedure achieved accuracy of more than 85 percent on discriminating ASD from control.Methods
Structural images were obtained from ABIDE II dataset in all 16 sites. After quality control, we divided all subjects into 3 age groups (Age1: 6-12 years old; Age2: 12-18 years old; Age3: above 18 years old). Also, we matched the same number of subjects in ASD and control in each age group. Finally, 670 subjects were included in our study (Age1: 170ASD,170CON; Age2: 85ASD,85CON; Age3: 80ASD,80CON).Structural data were preprocessed using FreeSurfer (http://surfer.nmr.mgh.harvard.edu). Morphological features (MF) included cortical thickness (CT), pial surface area (PSA), grey matter volume (GMV), folding index (FI) and curvature (CURV) were extracted based on the Desikan-Killiany Atlas6 which contains 68 ROIs in native space. We applied a ComBat harmonization7 to MF for correcting site effects. Multi-Feature-Based Network (MFN) was constructed using Elastic Net8 to quantify relationship between one region and the other regions9. The linear regression model was defined as xi = Aw, where xi represented vector of 5 MF in each region which was normalized using Z-score, A was multiple predictor matrix in the other regions, and w represented regression coefficient vector. We used SLEP10 to solve the optimization problem and obtained w. Note that we binarized w to construct MFN matrix (68×68). To find the optimal sparsity of MFN in ASD diagnosis, we varied λ1 and λ2 values in specified ranges, and used MFN corresponding highest classification accuracy in all subjects for further analysis.
We performed a two-step feature selection separately in 3 age stages to obtain optimal feature subset. Firstly, we applied χ2-test on MFN and two sample t-test on MF, and features with p>0.05 (uncorrected) were excluded. Then, these features were performed SVM-based recursive feature elimination (SVM-RFE)11,12 to evaluate importance in classification. Finally, we utilized MKL13 with appropriate weight to combine selected MF and MFN which are specific in 3 age stages. The optimal SVM model was obtained via a five-fold cross validation on the training dataset of each cross-validation process. We calculated accuracy, sensitivity, specificity, area under receiver operating characteristic curve and F-score for assessment of classification performance. And we repeated this procedure for 100 times to evaluate the superiority of MKL compared to other methods via a paired t-test.
Further, we used support vector regression (SVR) to estimate SRS subscales scores in ASD based on specific MF and MFN in each age stage. And leave-one-out was used to calculate prediction accuracy.
Results
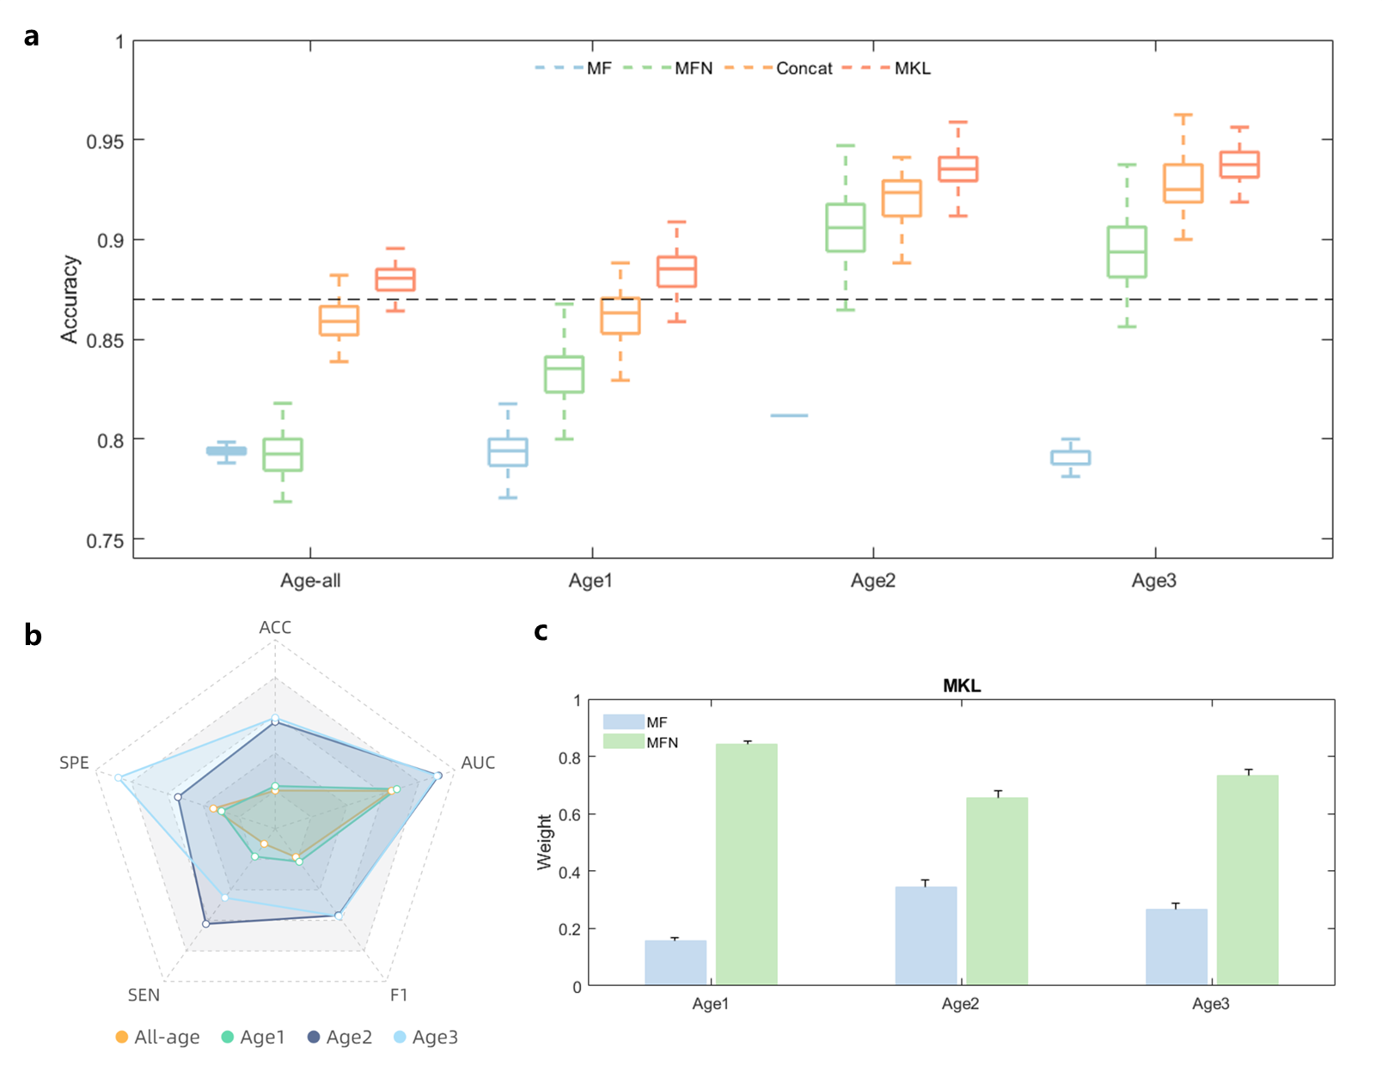
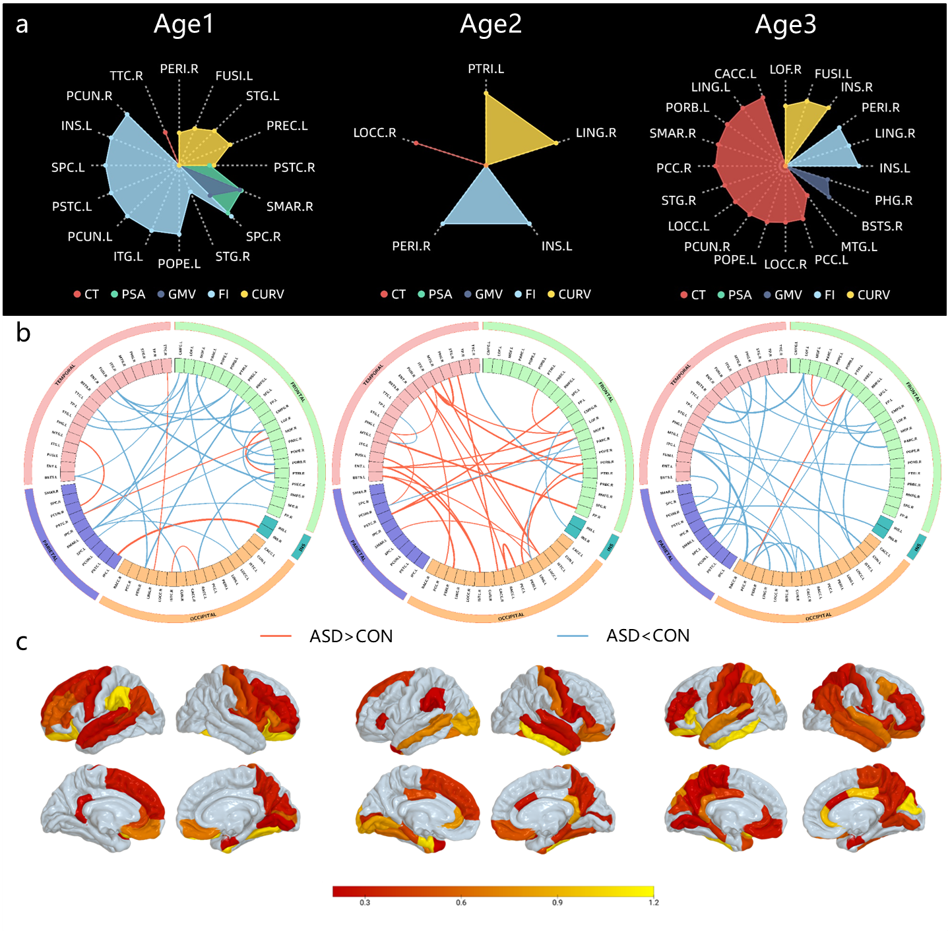
In each age stage, two types of structural features combined by MKL method achieved highest accuracy (Fig1a). As expected, specific feature in each age stage performed better than those selected from all subjects in terms of each indicator (Fig1b). In addition, we explored optimal weight in each age stage and found weight of MFN were larger than MF, indicating larger contribution to classification (Fig1c).The most discriminative features in terms of MF and MFN were not the same in 3 age stages (Fig2). Specifically, top 20 MF features were mainly FI in Age1, FI and CURV in Age2, and CT in Age3. However, PSA and GMV had little weight in 3 age stages (Fig2a). ASD in Age2 showed higher connections in top 30 MFN than CON, while ASD showed lower connections than CON in Age1 and Age3 (Fig2b). Brain regions, defined as sum of SVM-RFE weights of top 30 MFN connection, were visualized in Fig2c.
Further, we found that specific MF and MFN feature in each age stage can predict SRS scores in ASD, which measured social deficits in ASD (Fig3).
Discussion
In this paper, we proposed that sub-grouped by age in ASD, as well as combined MF and MFN based on MKL can achieve better classification performance. We found that specific features in each age stage performed better than those selected in all subjects.In top discriminative MF, 5 structural features complemented each other. In top MFN, there were some regions same as top MF (Fig2c), such as PREC.L, PSTC.R, PCUN.R and STG.L in Age1, PERI.R and PTRI.L in Age2, as well as LING, PCC, STG.R and INS.R in Age3, which may indicate these regions are important to distinguish ASD from CON. Most importantly, specific features in each age stage were related to social deficits in ASD.
Conclusion
We proposed a procedure that sub-grouped by age and combined age-specific structural features in each age stage using MKL to distinguish ASD and control more efficiently.Acknowledgements
No acknowledgement found.References
1. Uddin LQ, Menon V, Young CB, et al. Multivariate Searchlight Classification of Structural Magnetic Resonance Imaging in Children and Adolescents with Autism. Biological Psychiatry. 2011;70(9):833-841.
2. Wee CY, Wang L, Shi F, Yap PT, Shen D. Diagnosis of autism spectrum disorders using regional and interregional morphological features: Diagnosis of ASD Using Morphological Features. Hum Brain Mapp. 2014;35(7):3414-3430.
3. Haar S, Berman S, Behrmann M, Dinstein I. Anatomical Abnormalities in Autism? Cereb Cortex. 2016;26(4):1440-1452.
4. Katuwal GJ, Baum SA, Cahill ND, Michael AM. Divide and Conquer: Sub-Grouping of ASD Improves ASD Detection Based on Brain Morphometry. Hu VW, ed. PLoS ONE. 2016;11(4):e0153331.
5. Di Martino A, O’Connor D, Chen B, et al. Enhancing studies of the connectome in autism using the autism brain imaging data exchange II. Sci Data. 2017;4(1):170010.
6. Desikan RS, Ségonne F, Fischl B, et al. An automated labeling system for subdividing the human cerebral cortex on MRI scans into gyral based regions of interest. NeuroImage. 2006;31(3):968-980.
7. Fortin JP, Cullen N, Sheline YI, et al. Harmonization of cortical thickness measurements across scanners and sites. NeuroImage. 2018;167:104-120.
8. Zou H, Hastie T. Regularization and variable selection via the elastic net. J Royal Statistical Soc B. 2005;67(2):301-320.
9. Zheng W, Eilam-Stock T, Wu T, et al. Multi-Feature Based Network Revealing the Structural Abnormalities in Autism Spectrum Disorder. IEEE Trans Affective Comput. 2021;12(3):732-742.
10. Liu J, Ji S, Ye J. SLEP: Sparse Learning with Efficient Projections. :56.
11. Guyon I, Weston J, Barnhill S. Gene Selection for Cancer Classification using Support Vector Machines. Machine learning. 2002;46(1):389-422.
12. Yan K, Zhang D. Feature selection and analysis on correlated gas sensor data with recursive feature elimination. Sensors and Actuators B: Chemical. 2015;212:353-363.
13. Wee CY, Yap PT, Zhang D, et al. Identification of MCI individuals using structural and functional connectivity networks. NeuroImage. 2012;59(3):2045-2056.
Figures
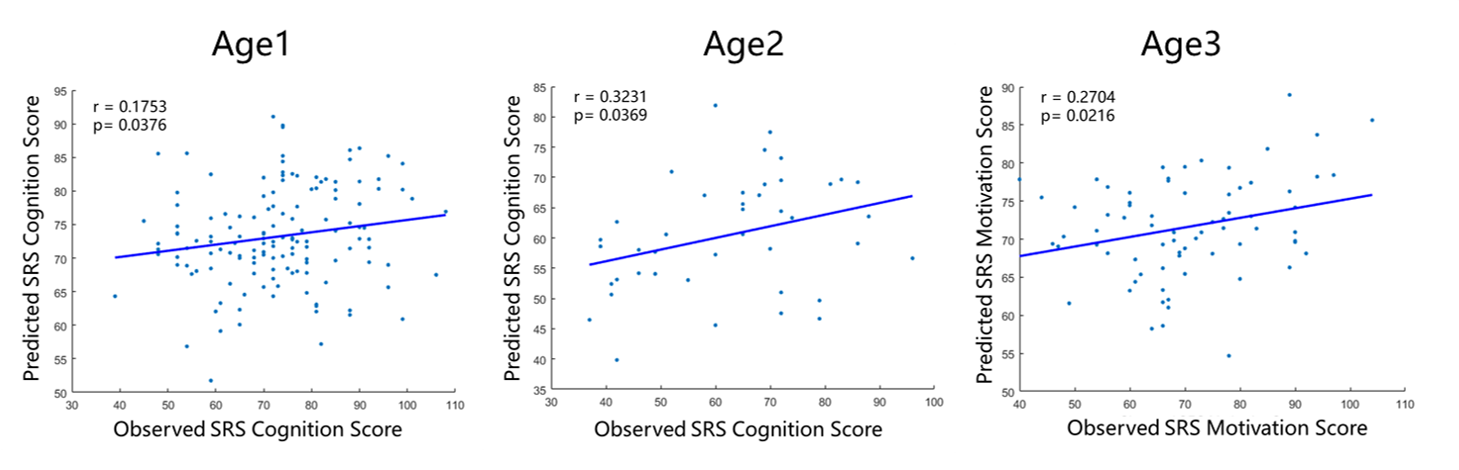
Prediction of individual SRS subscales scores based on specific MF and MFN in each age stage using support vector regression. The scatterplot shows correlation between actual and predicted scores. Each dot corresponds to one instance of leave-one-out cross-validation.