5056
Repeated Electroconvulsive Shock does not Affect Cognition and Neurometabolism in Mouse Brain1Department of NMR Microimaging and Spectroscopy, CSIR - Center for Cellular and Molecular Biology, Hyderabd, India, 2Academy of Scientific & Innovative Research (AcSIR), Ghaziabad, India
Synopsis
Keywords: Psychiatric Disorders, Spectroscopy, Metabolism, Glutamate, GABA, 13C NMR
Electroconvulsive therapy is an effective treatment for chemo-resistant depression. The impact of electroconvulsive shock (ECS) on cognition and neurometabolism is not clear. The memory of mice was evaluated using Y-maze test. The rates of glucose oxidation (CMRGlc(ox)) were measured by 1H-[13C]-NMR spectroscopy together with an infusion of [1,6-13C2]glucose after 24 hours and 3 months of the repeated ECS. The spontaneous alternation was decreased after 24 h and 1 month of repeated ECS, and was restored after two months. The CMRGlc(ox) was reduced in PFC after 24 h of ECS. These changes were normalized after 3 months of ECS.
Introduction
Electroconvulsive therapy (ECT) is a rapid and the most effective treatment for drug-resistant depressive disorder1. Although ECT has been used for the cure of depression, the mechanism of action is not very clear yet2,3. There are mixed reports about the long-term impact of ECT on the cognitive ability of depressed subjects4,5. Moreover, the impact of ECT on the neurometabolic activity does not have a consensus6,7. Most importantly, the activity of excitatory and inhibitory neurons following ECS is not evaluated quantitatively. Hence, the objective of the current steady was to assess the immediate and long-term impact of repeated ECS on cognitive function and neurometabolic activity in mice brains.Methods
All animal experiments were performed under an approved protocol by the Animal Ethics Committee of the Centre for Cellular and Molecular Biology (CCMB), Hyderabad. The C57Bl6/N mice (2 months old) were divided into two groups: A. ECS Group (n=16) and B. Sham Group (n=16). Mice were anesthetized using isoflurane (3.5%) mixed in the air. Mice in the ECS group received one electroconvulsive shock (ECS) via corneal electrodes (frequency 100 Hz; pulse width 0.5 ms; shock duration 0.5 s; current 50 mA) daily for 7 days8. The short-term memory of the mice was evaluated by monitoring the spontaneous alternation using the Y-maze test9. For metabolic measurements, mice were infused with [1,6-13C2]glucose (0.225 M) via tail vein over 2 min period using a bolus variable infusion schedule10 after 24 h and 3 months of the last ECS session. The brain metabolism was arrested by the focused beam microwave system (3 KW, 1.2 s) after 7 min of the start of infusion. The metabolism of [1,6-13C2]glucose via the TCA cycle incorporates labels into glutamate, GABA, glutamine and aspartate. The metabolites were extracted from the brain tissue using the ethanol extraction protocol10. The 1H-[13C]-NMR spectra of brain tissue extracts were acquired at 600 MHz NMR spectrometer to measure concentration and 13C labelling of neurometabolites11,12. The cerebral metabolic rates of glucose oxidation were determined based on the 13C labeled trapped into different amino acid11. The significance of the difference of various measurements was assessed from the 2-tailed student’s T-test with the Holm-Sidak method of multiple comparisons using GraphPad Prism software.Results and Discussion
The analysis of spatial memory using Y-Maze indicated a significant (p=0.03) decrease in the spontaneous alternation in ECS mice (60±6 %) 24 h post elctroconvulsive shock when compared with controls (69±8 %) (Fig. 1). The reduction in the spontaneous alternation in ECS mice (ECS: 56±9 %, Sham: 64±7%) remained significant (p=0.04) till one month of the ECS. There was no significant difference in the spontaneous alternation between ECS and Sham mice post-2-month of the shock (Fig. 1). These data suggest that repeated ECS does not have a negative impact on the working memory of mice over a long period. The neurometabolism was measured in PFC after 24 h and 3 months of the last ECS treatment by 1H-[13C]-NMR spectroscopy (Fig. 2). There was a significant (p=0.004) increase in the concentrations of glycerophosphocholine (GPC) (+10%) in PFC. However, there was no significant (p>0.02) change in the concentration of metabolites after 3 months of repeated ECS in the PFC (Table 1). Moreover, there was no significant change in the 13C labeling of amino acids from [1,6-13C2]glucose in the PFC after 24 h and 3 months of the repeated ECS (Table 2). There was a trend of reduction in CMRGlc(ox) in PFC (-10%, p=0.06) post 24 h of the last ECS (Fig. 3A). The changes in CMRGlc(ox) were completely nullified after 3 months of the last ECS (Fig. 3B).Conclusion
These data suggest that repeated ECS does not have a negative impact on cognitive function and neurometabolism in the long-term. The findings of the study may be useful to address the stigma of electroconvulsive therapy.Acknowledgements
This work was supported by the Council for Scientific and Industrial Research (CSIR), Government of India (Health Care Theme FBR/MLP0150). AS thanks the Department of Biotechnology for the award of Junior Research Fellowship (DBT/2019/CCMB/1230).
References
1. Group UER (2003) Efficacy and safety of electroconvulsive therapy in depressive disorders: a systematic review and meta-analysis. Lancet 361:799-808
2. Li M, Yao X, Sun L, et al. Effects of Electroconvulsive Therapy on Depression and Its Potential Mechanism. Front Psychol. 2020;11:80.
3. Maffioletti E, Carvalho Silva R, Bortolomasi M, Baune BT, Gennarelli M, Minelli A. Molecular Biomarkers of Electroconvulsive Therapy Effects and Clinical Response: Understanding the Present to Shape the Future. Brain Sci. 2021;11(9):1120.
4. Anderson IM, McAllister-Williams RH, Downey D, Elliott R, Loo C. Cognitive function after electroconvulsive therapy for depression: relationship to clinical response. Psychol Med. 2021;51(10):1647-1656.
5. Nakamura K, Ito M, Liu Y, Seki T, Suzuki T, Arai H. Effects of single and repeated electroconvulsive stimulation on hippocampal cell proliferation and spontaneous behaviors in the rat. Brain Res. 2013;1491:88-97.
6. Erchinger VJ, Ersland L, Aukland SM, Abbott CC, Oltedal L (2021) Magnetic Resonance Spectroscopy in Depressed Subjects Treated With Electroconvulsive Therapy-A Systematic Review of Literature. Front Psychiatry 12:608857.
7. Schmidt EZ, Reininghaus B, Enzinger C, Ebner C, Hofmann P, Kapfhammer HP. Changes in brain metabolism after ECT-positron emission tomography in the assessment of changes in glucose metabolism subsequent to electroconvulsive therapy--lessons, limitations and future applications. J Affect Disord. 2008;106(1-2):203-208.
8. Jonckheere J, Deloulme JC, Dall'Igna G, et al (2018) Short- and long-term efficacy of electroconvulsive stimulation in animal models of depression: The essential role of neuronal survival. Brain Stimul 11:1336-1347.
9. Hughes, R. N. (2004). The value of spontaneous alternation behavior (SAB) as a test of retention in pharmacological investigations of memory. Neuroscience & Biobehavioral Reviews, 28(5), 497-505.
10. Soni ND, Ramesh A, Roy D, Patel AB. Brain energy metabolism in intracerebroventricularly administered streptozotocin mouse model of Alzheimer's disease: A 1H-[13C]-NMR study. J Cereb Blood Flow Metab. 2021;41(9):2344-2355.
11. de Graaf RA, Brown PB, Mason GF, Rothman DL, Behar KL (2003) Detection of [1,6-13C2]-glucose metabolism in rat brain by in vivo 1H-[13C]-NMR spectroscopy. Magn Reson Med 49:37-46.
12. Bagga P, Chugani AN, Varadarajan KS, Patel AB (2013) In vivo NMR studies of regional cerebral energetics in MPTP model of Parkinson's disease: recovery of cerebral metabolism with acute levodopa treatment. J Neurochem 127:365-377.
13. Tiwari V, Ambadipudi S, Patel AB (2013) Glutamatergic and GABAergic TCA cycle and neurotransmitter cycling fluxes in different regions of mouse brain. J Cereb Blood Flow Metab 33:1523-1531.
Figures
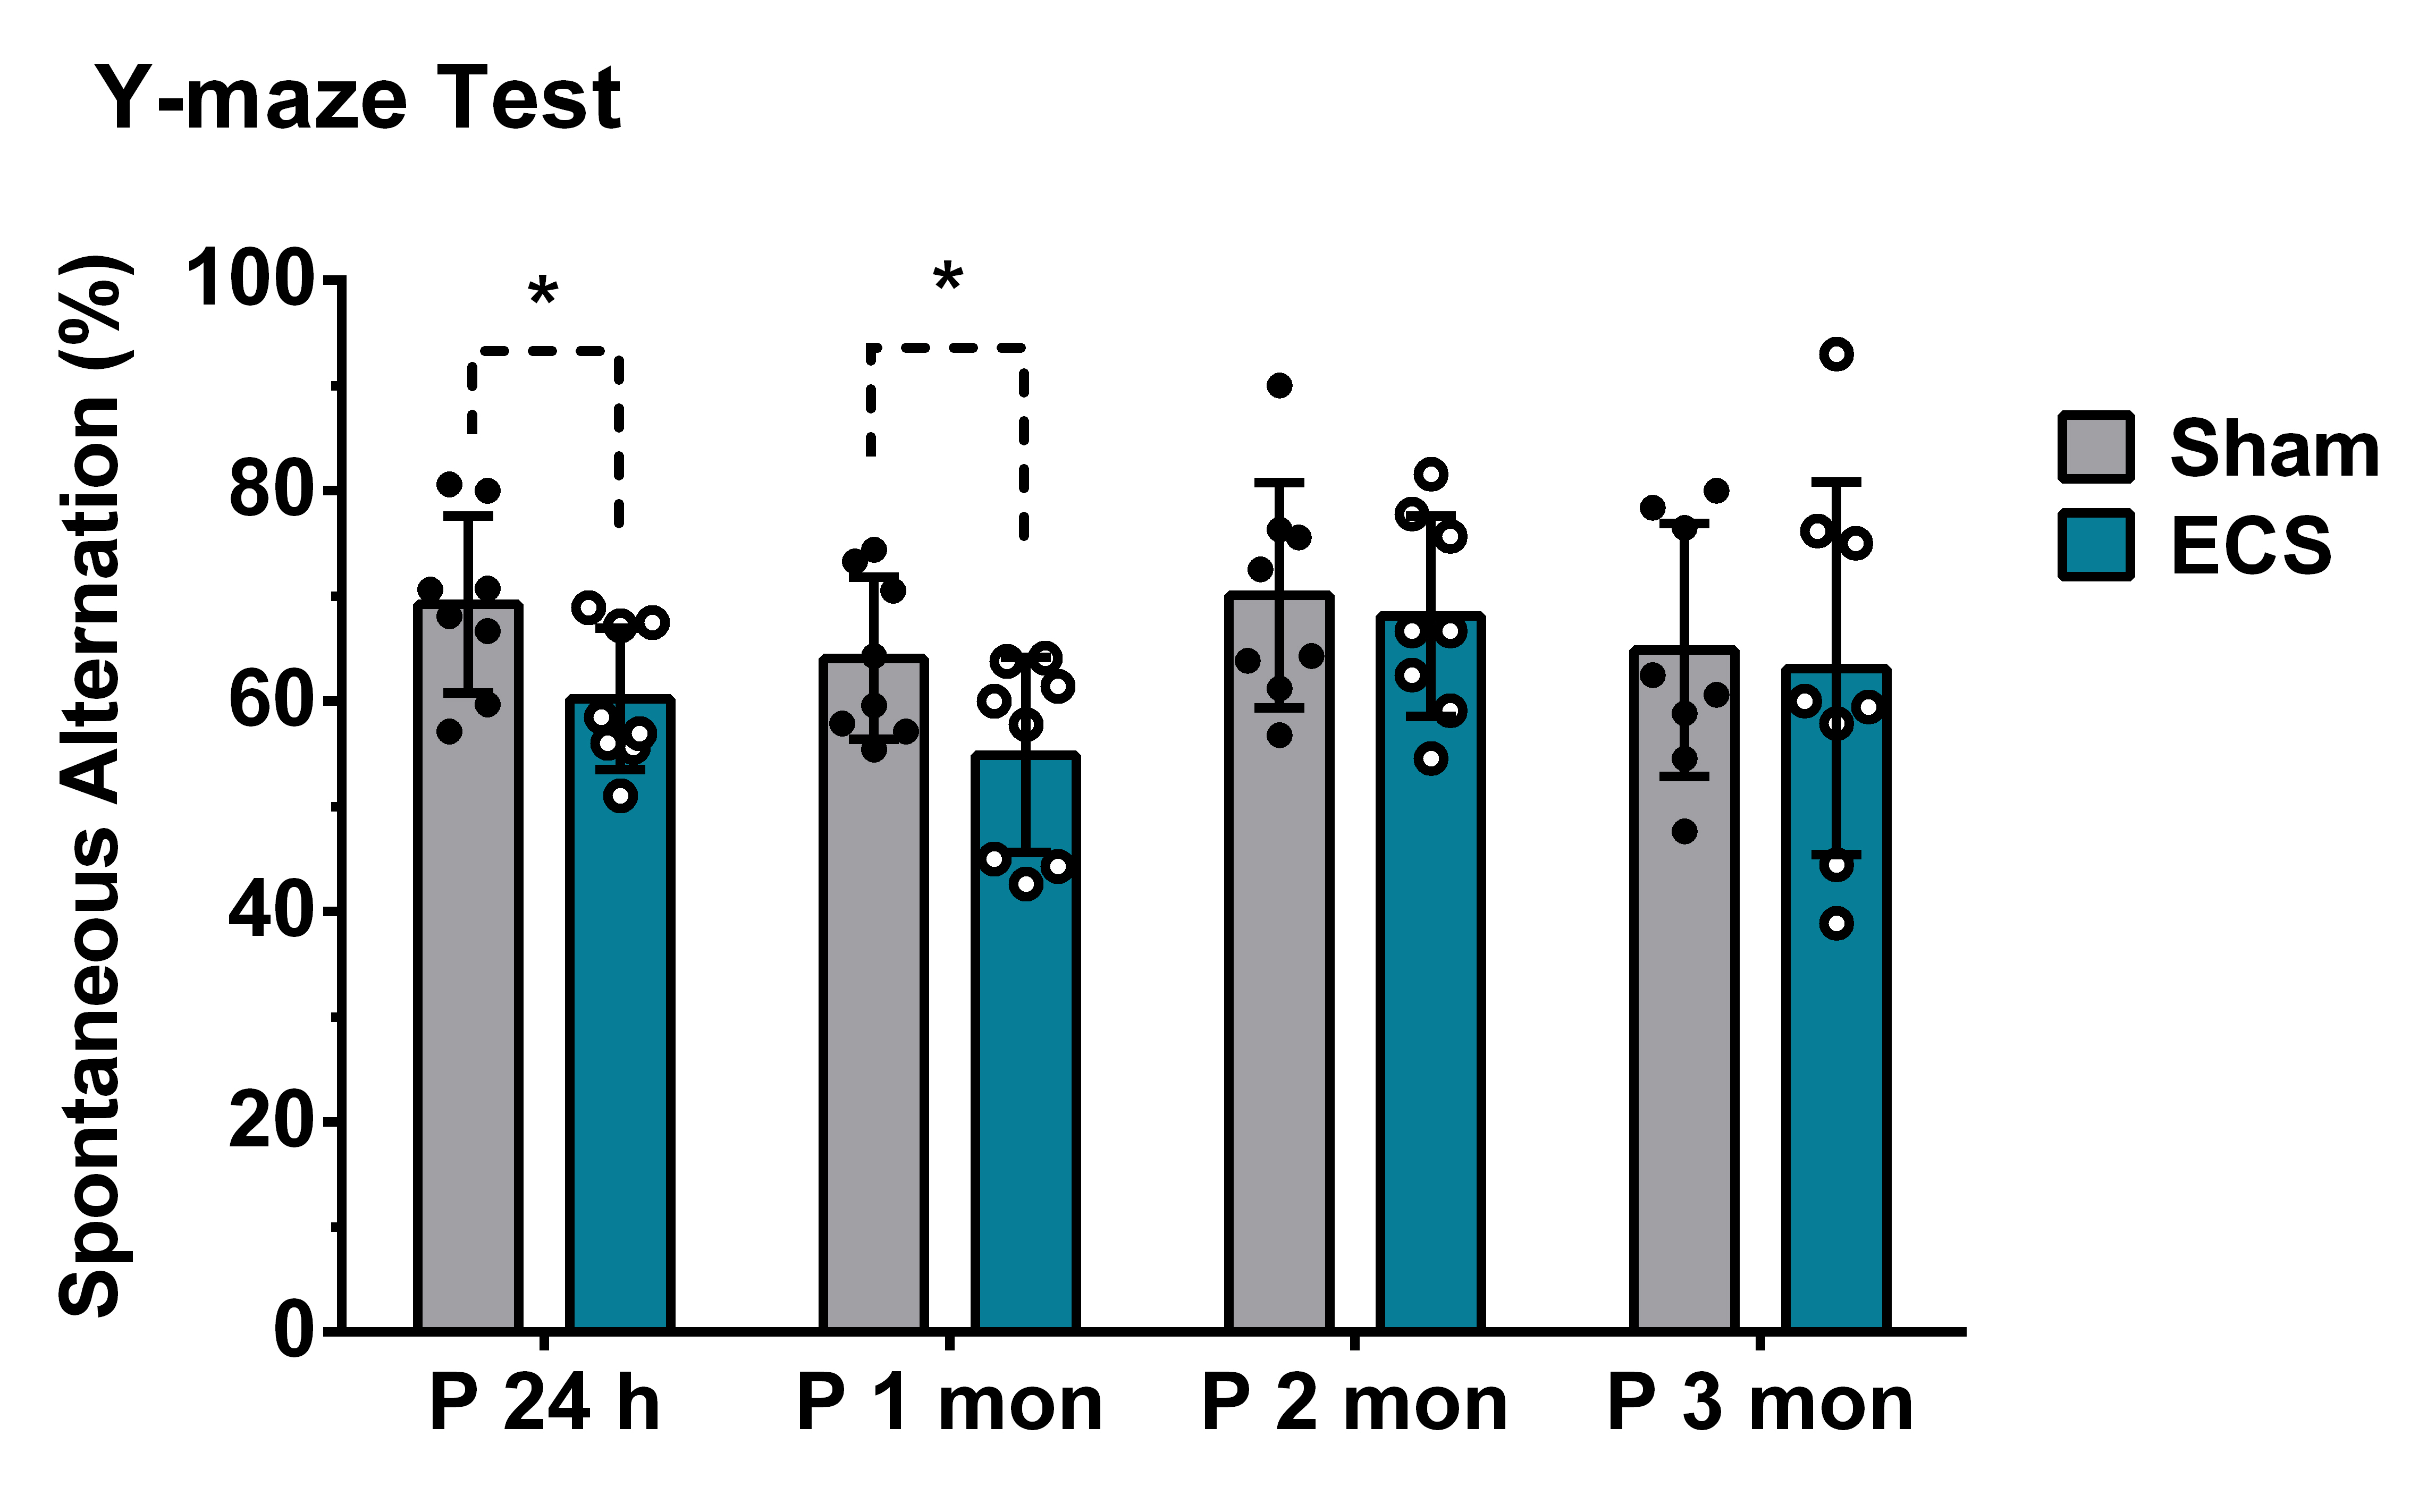
Fig. 1 Spontaneous alternation in Y-maze test. Mice were placed in the center of the maze, and allowed to explore the three arms of the maze freely for 8 minutes. The percentage of spontaneous alternation was calculated by dividing the number of alternating triads containing entries into all three arms by the maximum possible number of triads. The vertical bar represents the mean±SD of the group, while the symbols depict individual values. *p<0.05 when ECS treated mice were compared with Sham.
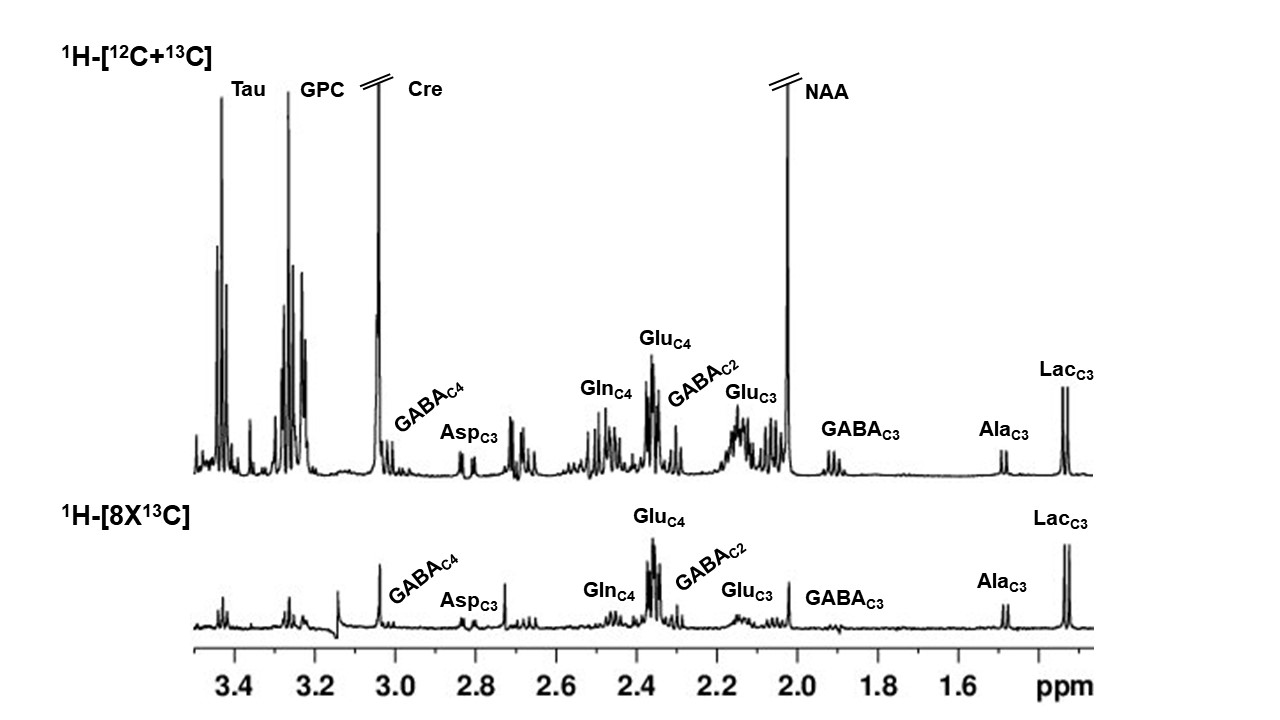
Fig. 2. Representative 1H-[13C]-NMR spectra from PFC brain tissue extract. The spectrum in the upper panel shows the total concentration of neurometabolites, whereas the spectra in the lower panel depict 13C labeled neurometabolites. AlaC3: alanine-C3; AspC3: aspartate-C3; Cre : creatin; GABAC2: g-aminobutyric acid-C2; GABAC4: g-aminobutyric acid-C4 GluC4: glutamate-C4; GluC3: glutamate-C3; GlnC4: glutamine-C4; GPC: glycerophosphocholine; LacC3: lactate-C3; NAA: N-acetyl aspartate; Tau: Taurine.
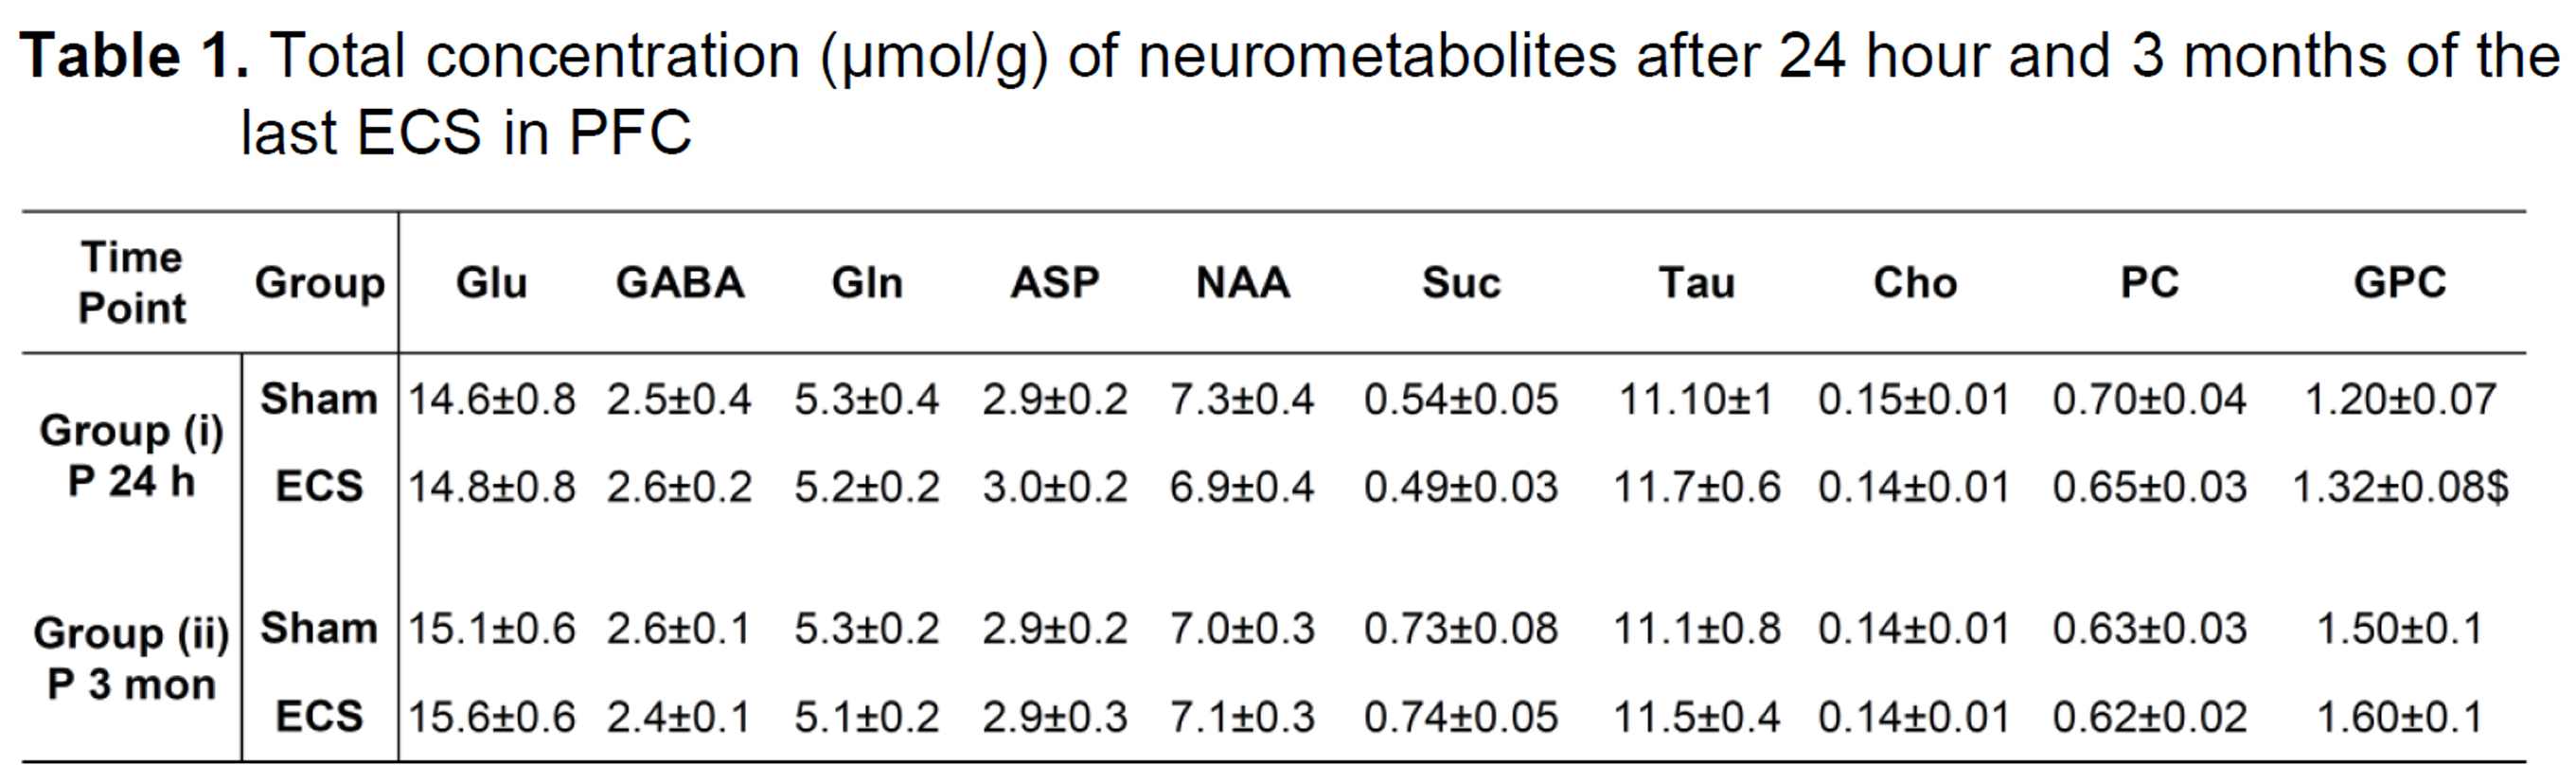
Mice were subjected for daily one electric shock for 7 days, infused with [1,6-13C2]glucose for 2 min after 24 h and 3 months of ECS. Brain metabolism was fixed by focused beam microwave irradiation after 7 min of initiation of infusion. The concentrations of metabolites (Mean±SD) were measured in the PFC from unedited 1H-[12C+13C]-NMR spectrum using [2-13C]glycine as reference. Asp: aspartate; Cho: Choline; GABA: g-aminobutyric acid; Glu: glutamate; Gln: glutamine; GPC: glycerophosphocholine; NAA: N-acetyl aspartate; PC: phosphocholine; Suc: Succinate; Tau: Taurine.
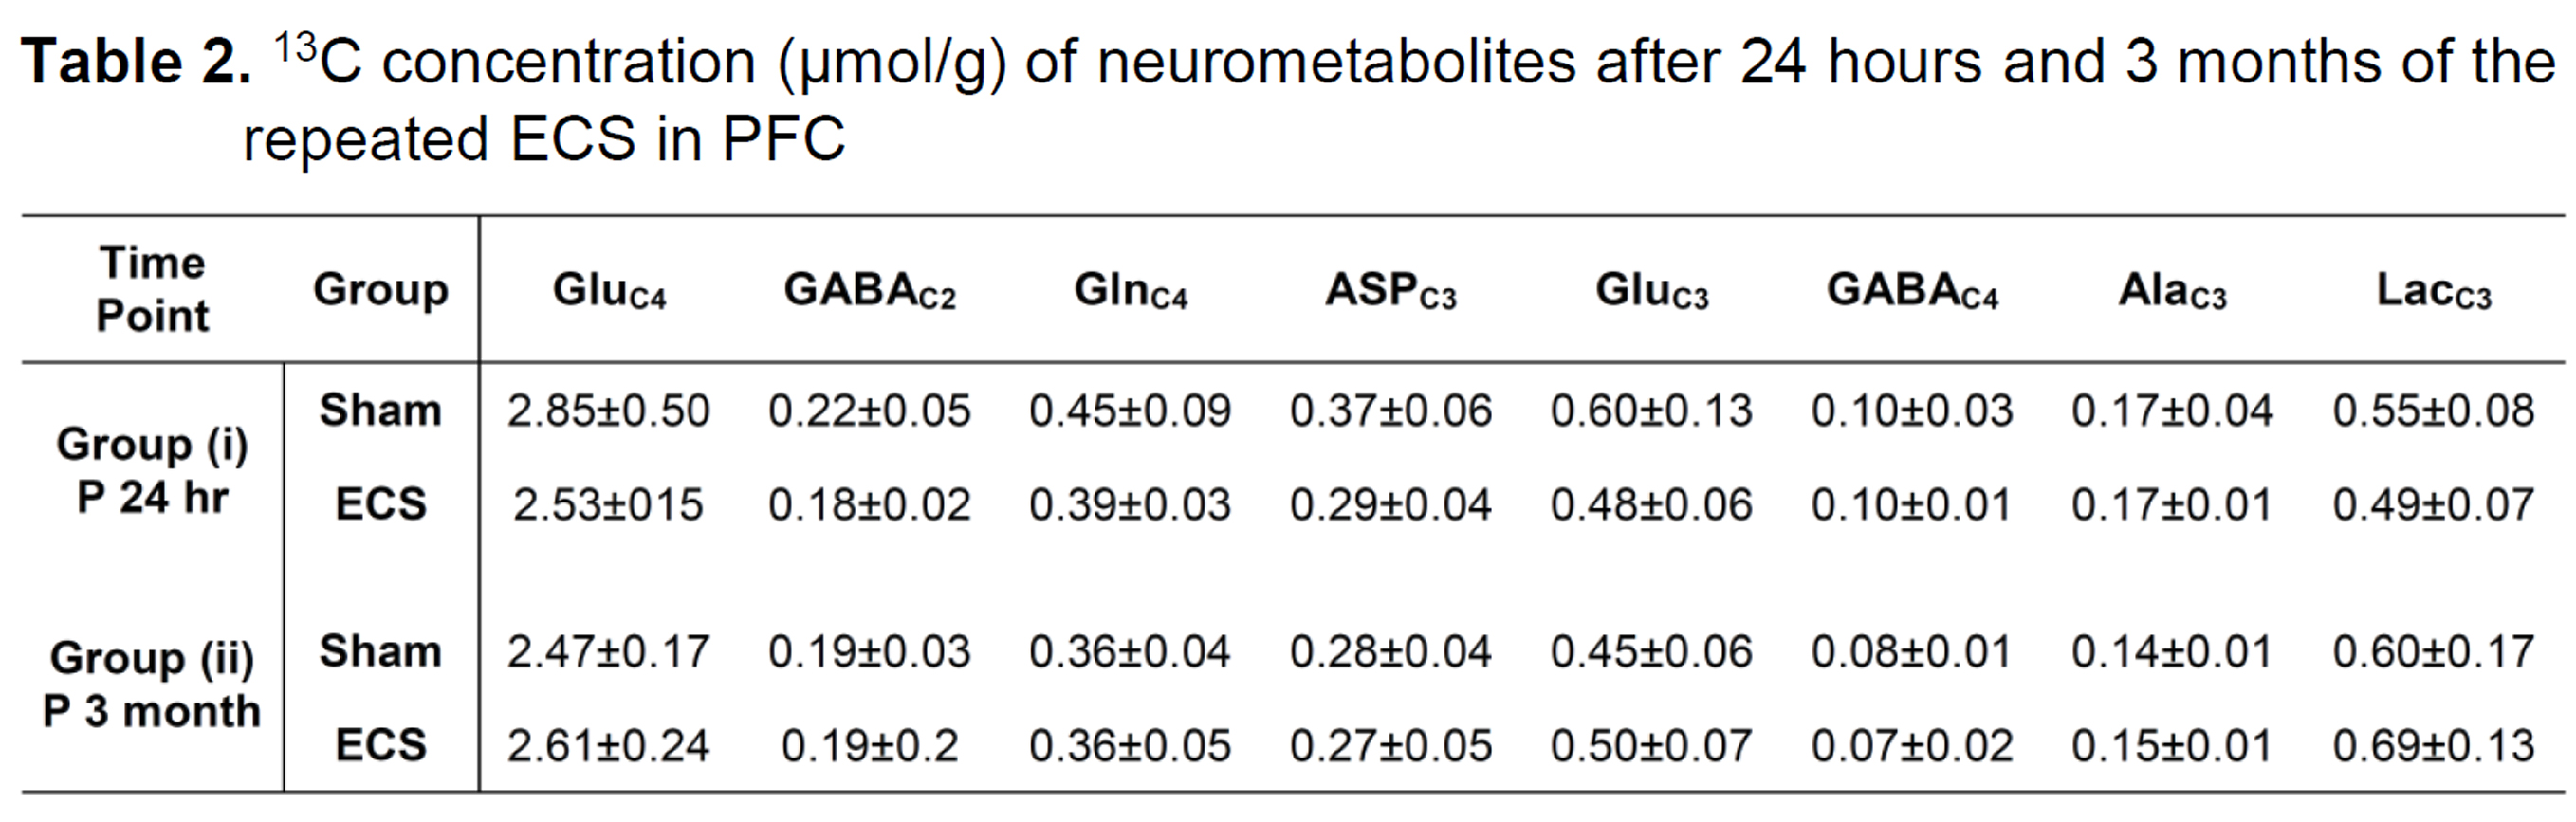
Mice were subjected to an electroconvulsive shock for 7 days, and infused with [1,6-13C2]glucose for 2 min after 24 h and 3 months of the last ECS. The 13C concentrations of neurometabolites were measured in PFC extracts from edited 1H-[13C]-NMR spectrum using [2-13C]glycine as reference. Values are presented as mean±SD. Abbreviations: AlaC3: alanine-C3; AspC3: aspartate-C3; GABAC2: g-aminobutyric acid-C2; GABAC4: g-aminobutyric acid-C4 GluC4: glutamate-C4; GluC3: glutamate-C3; GlnC4: glutamine-C4; LacC3: lactate-C3.
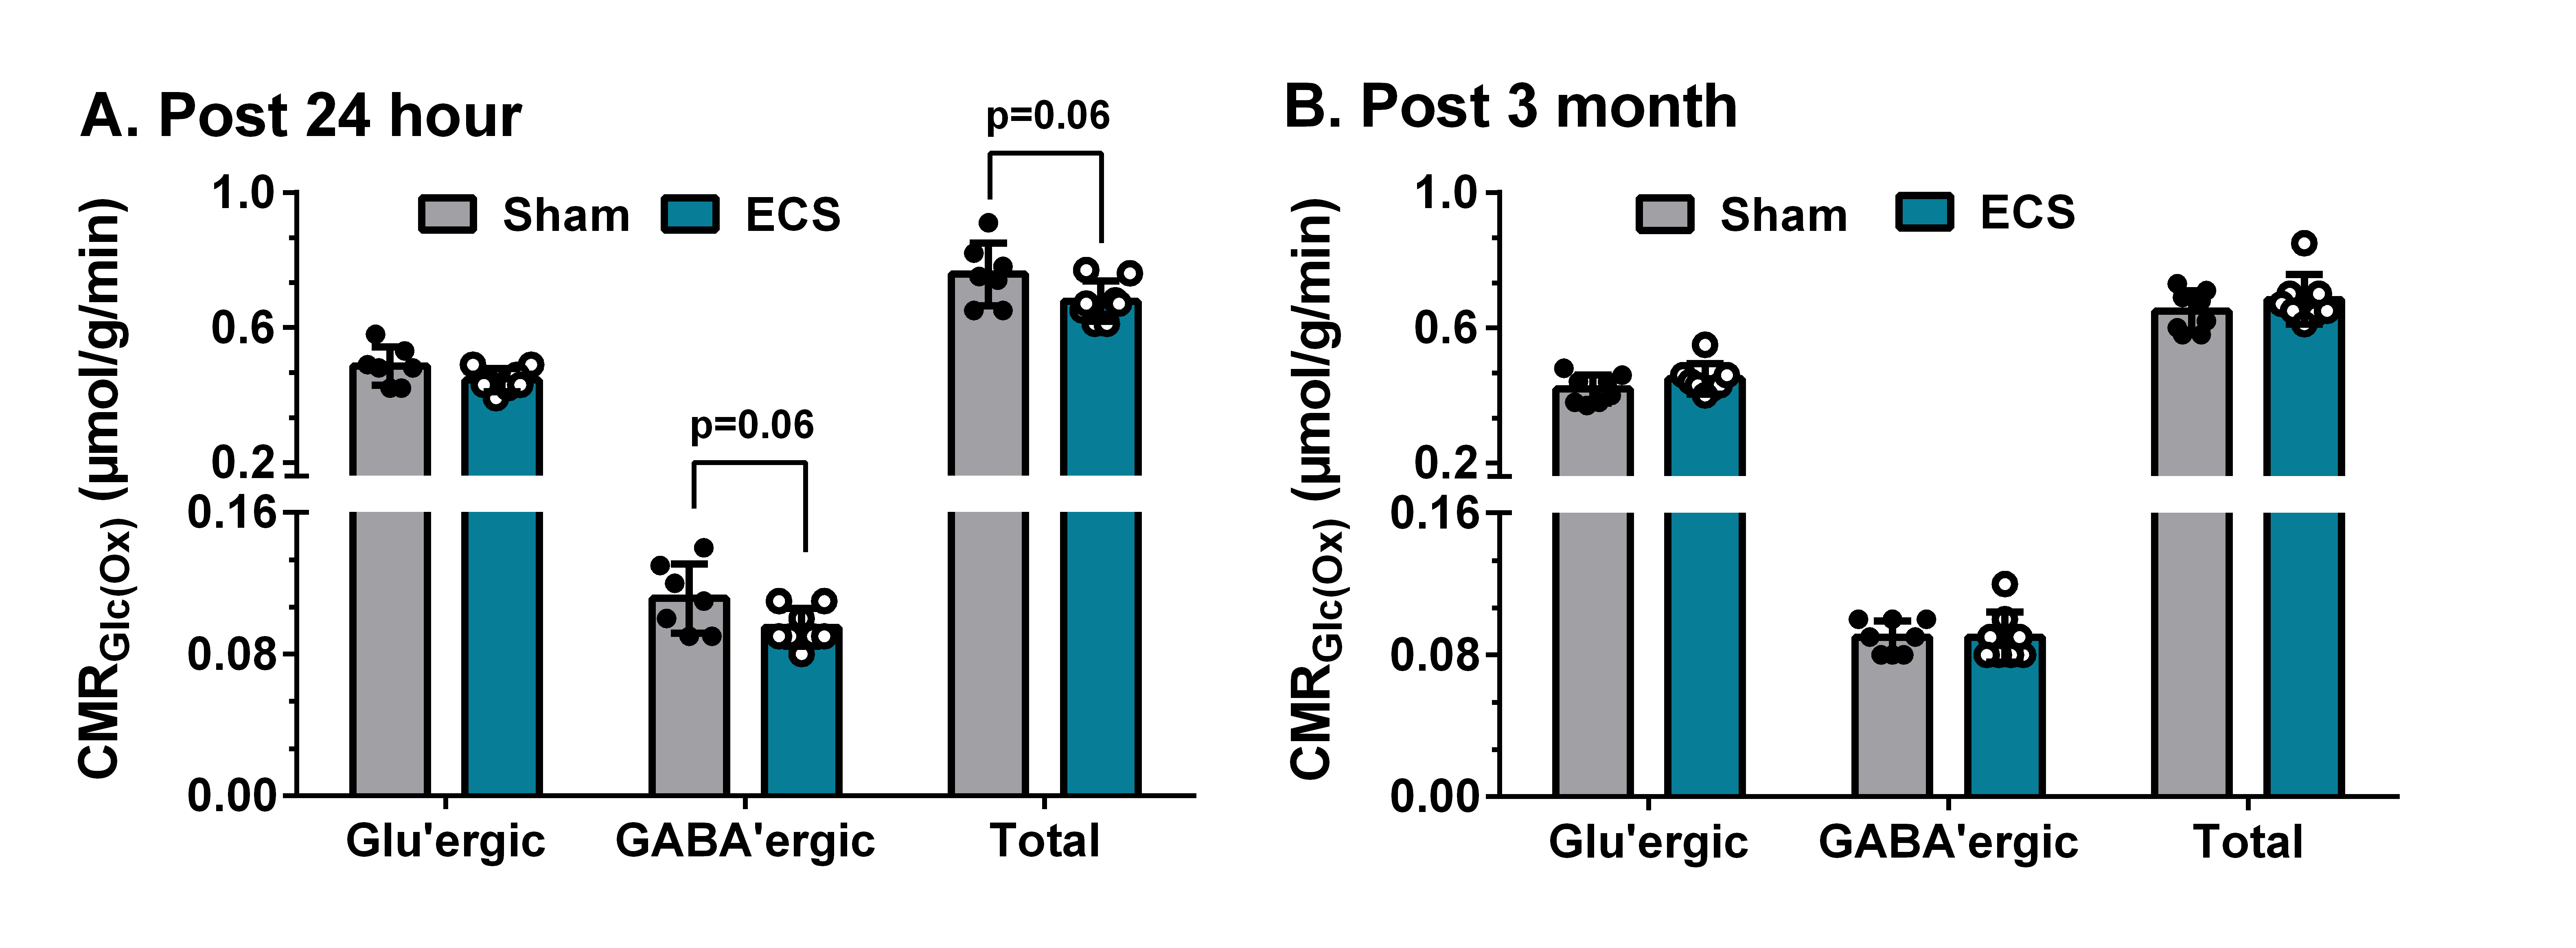
Fig. 3. Impact of repeated ECS on the cerebral metabolic rate of glucose oxidation (CMRGlc(Ox)) in PFC after 24 hour and 3 months of the last ECS. CMRGlc(Ox) was estimated based on the 13C labeled trapped into different amino acids The vertical bar represents the mean±SD, while the symbols depict individual values. *p<0.05 when ECS mice were compared with Sham.