5052
Image normalization can improve the effectiveness of radiomics model based on multiscale structural MRI for diagnosing MDD and StD in adolescents1Department of Radiology, The Third Affiliated Hospital of Kunming Medical University, Kunming, Yunnan Province, China, 2Department of Psychiatry, The Second Affiliated Hospital of Kunming Medical University, Kunming, Yunnan Province, China, 3Clinical Science, Philips Healthcare, Chengdu, China, Chengdu, China, 4Philips Healthcare,Guangzhou China, Guangzhou, China
Synopsis
Keywords: Psychiatric Disorders, Adolescents, Major depressive disorder, Subthreshold depression, Magnetic resonance imaging, Radiomics, Machine learning
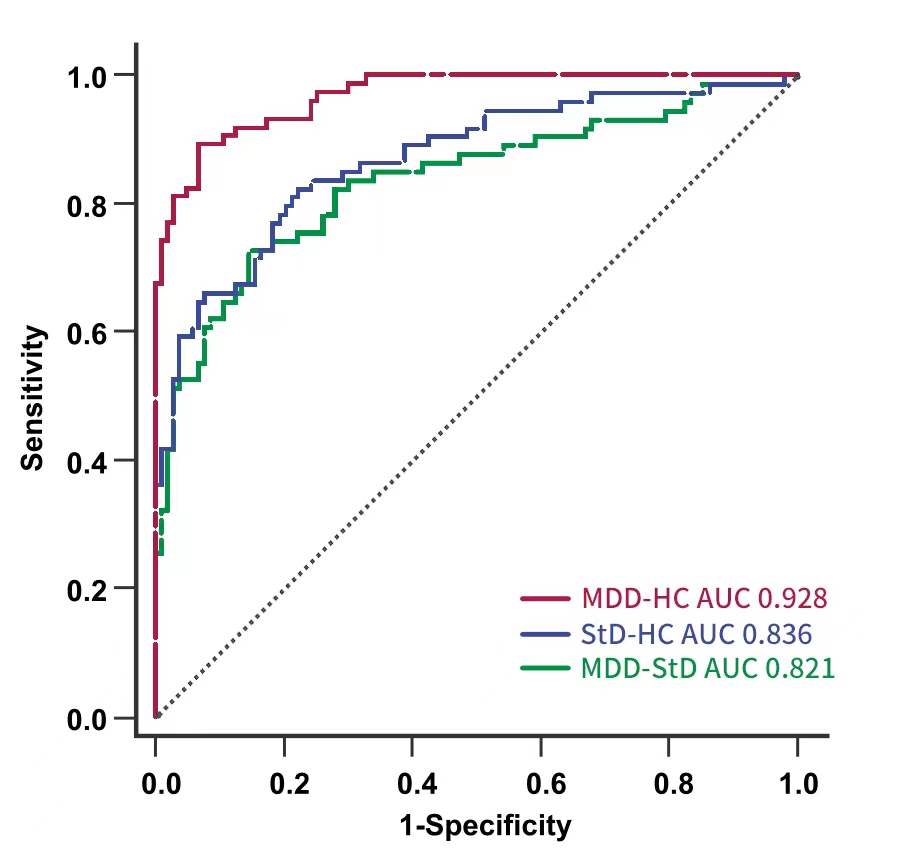
We developed a radiomics classifier for MDD and StD in adolescents with multiscale structural MRI after normalization, and it had the best performance and was superior to the classifier based on conventional image indicators and unnormalized radiomics features. The AUC, sensitivity, and accuracy for discriminating MDD and HC, MDD and StD, StD and HC were 0.928, 89.2% and 90.5%, 0.821, 73.0% and 80.8%, 0.836%, 82.4% and 79.7% respectively. The high discriminant radiomics features of cuneiform lobe and cerebellum (lobule ⅵ, ⅶ-b and ⅹ, 4/5 area of cerebellar vermis) played a key role in the pathophysiological mechanism of MDD and StD.Background
At present, the diagnosis of MDD and subthreshold depression (StD) mainly depends on subjective scores and structured interview, which results in the risk of misdiagnosis and medical burden. Radiomics is an emerging image analysis framework that provides more details than conventional methods. In present study, we aimed to develop and validate a radiomics classifier for MDD, StD and healthy controls (HC) in adolescents with multiscale brain structural radiomics analysis after normalization, and to compare it with classification model based on the conventional imaging indicators and unnormalized radiomics features.Materials and Methods
150 subjects (50 cases of MDD, 50 cases of StD and 50 cases of healthy controls matched for sex, age and education) were recruited for brain structural MRI including 3D-T1WI and DTI. N4 bias field correction and histogram-matching normalization were performed on the preprocessed T1WI and DTI images. Then, A.K. software was used to extract the radiomics features of gray matter and white matter based on the voxel-based morphometry (VBM)and surfaced-based morphometry (SBM), and then ComBat was used to harmonize the data. The two-level screening strategy of ANOVA and recursive feature elimination was used to reduce the dimension of radiomics features. The classifiers of MDD, StD and HC were constructed by using the conventional imaging indicators, unnormalized radiomics features and normalized radiomics features. The ROC curve, AUC, accuracy, accuracy, recall, specificity, and F1 score based on Leave-one-out cross-validation (LOO-CV), permutation tests and Delong nonparametric test were used to assess the performance of the classifier.Results
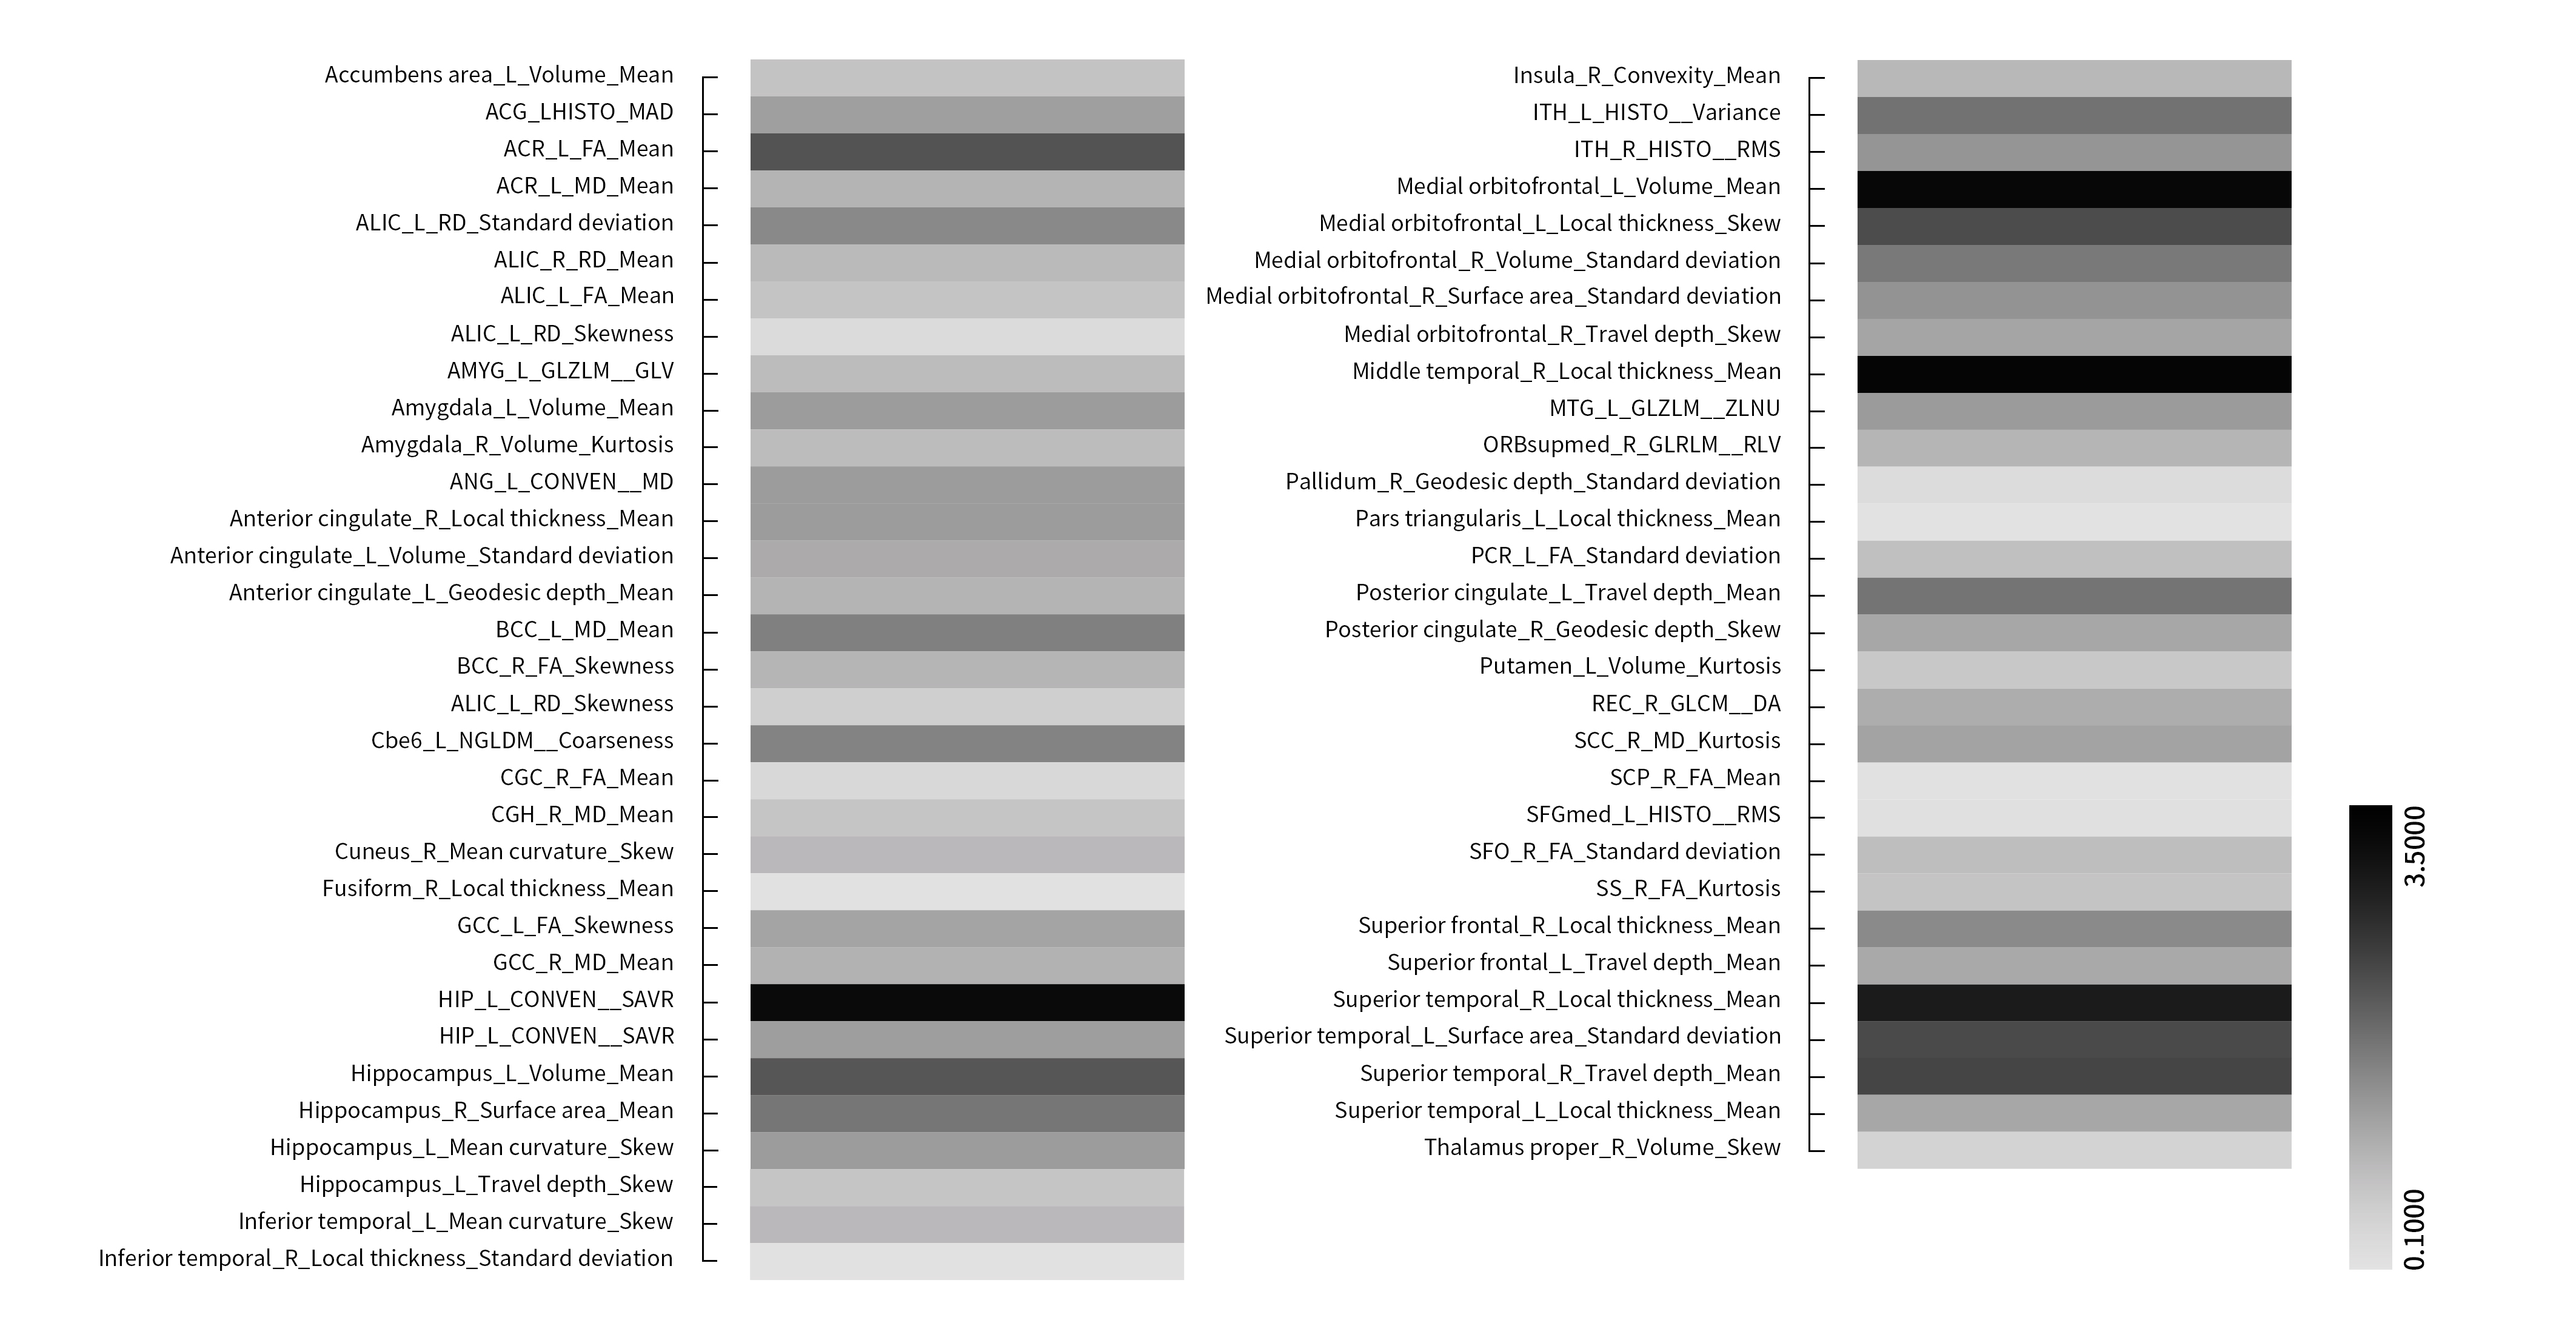
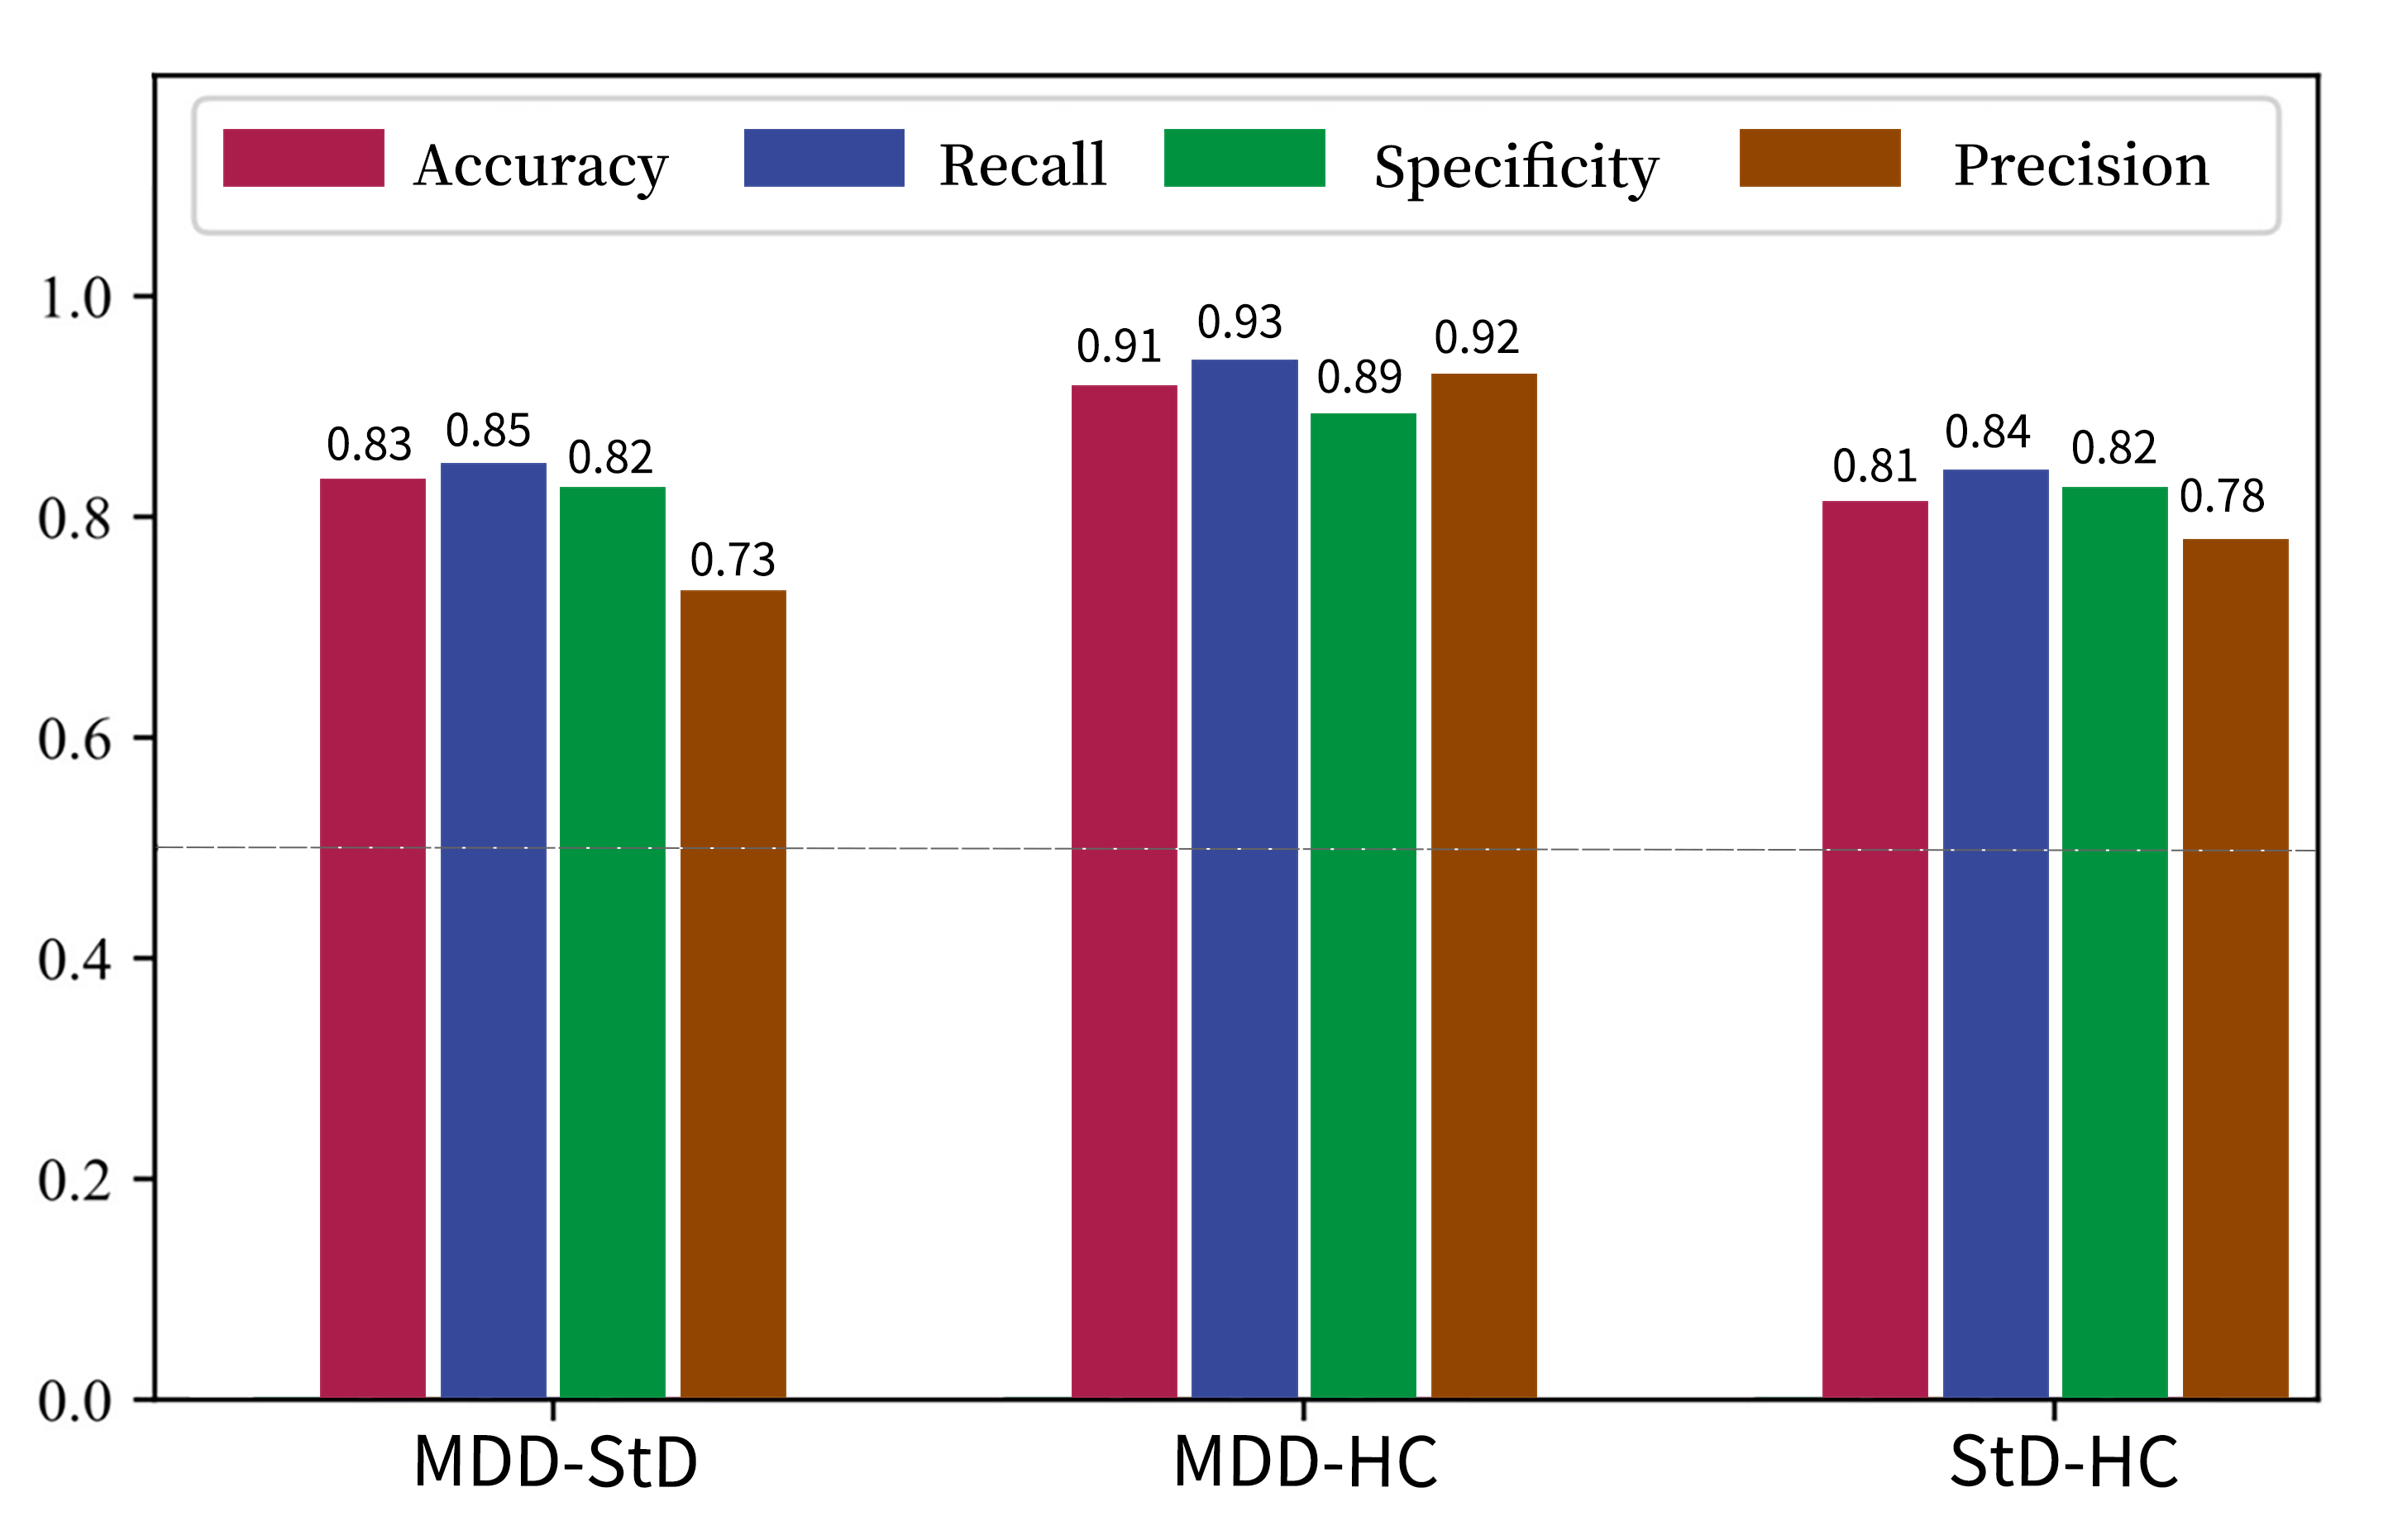
142 subjects were finally enrolled (43 cases of MDD, 49 cases of StD, 50 cases of HC). A total of 742 conventional image indicators including 344 features from SBM, 206 features from VBM, 192 diffusion features from DTI and 13150 radiomics features including 2338 features from SBM, 10044 features from VBM, 768 diffusion features from DTI were extracted after MRI preprocessing. After two-level dimensionality reduction, 7 conventional image indicators and 63 radiomics features were selected. SVM classifier based on radiomics features after normalization had the best performance. The AUC, sensitivity, specificity, and accuracy of discriminating MDD and HC, MDD and StD, StD and HC were 0.928, 89.2%, 93.2% and 90.5%, 0.821, 73.0%, 85.0% and 80.8%, 0.836%, 82.4%, 77.1% and 79.7% respectively. Permutation tests result was P < 0.001. High discriminant radiomics features to distinguish MDD patients and HC subjects were mainly located in the right middle temporal gyrus, bilateral medial orbitofrontal cortex, left superior temporal gyrus, bilateral hippocampus, right cerebellar hemispheric lobule ⅵ and ⅶ-b, right inferior temporal gyrus, left posterior cingulate (cingulate cortex), left cuneiform lobe, right cerebellar peduncle. High discriminant radiomics features to distinguish MDD and StD subjects were mainly located in the right superior temporal gyrus, bilateral hippocampus, bilateral medial orbitofrontal cortex, right cerebellar hemispheric lobule ⅶ-b and ⅹ, left inferior temporal gyrus, left anterior cingulate (cingulate cortex), etc.Discussion
VBM and SBM are two of the most important methods for analyzing structural images of brain1. The present study employed a combination of VBM and SBM to analyze multiscale structural MRI of brain, which also bridged the advantages and disadvantages of these two methods2. Although the classifier has a good performance for differentiating MDD and HC, it is not good enough for MDD and StD, StD and HC. It is necessary to pay attention to the problems of high dimensions and low sample size of features in radiomics3,4.In our study, three brain regions, including medial orbitofrontal cortex, superior temporal gyrus and anterior cingulate gyrus, were observed to have significant differences between HC and StD, and StD and MDD, which are consistent with previous studies5. Although the volumes of orbitofrontal cortex and temporal lobe in MDD and StD patients were smaller than those in healthy controls, the reduction in StD subjects was significantly lower than that in MDD patients. Based on these findings, it is suggested that the pathophysiological process seems to be a continuous spectrum occurring in brain structure from HC to StD and MDD6,7. These results suggested that the cuneiform may relate to different subtypes of depressive symptoms. It should be noted that many other neuroimaging studies on MDD have not found abnormal changes in the cuneiform lobe8-10, which may be because different subtypes of MDD not only have different depression symptoms
Neuroimaging and behavioral studies showed the cerebellum was not only involved in motor control, but also involved in the regulation of cognitive and emotional functions11-16, but its specific mechanism of action is still unclear. This study showed the radiomics features of cerebellar 6/7b lobule and vermis 4/5 region also have a high weight in distinguishing MDD, StD and HC. Therefore, the cerebellum may play an important role in the pathophysiological process.
Conclusion
In general, radiomics analysis after normalization based on brain multiscale sMRI can distinguish MDD, StD and HC and is superior to the classification model based on conventional image indicators and unnormalized radiomics features. The radiomics features of cuneiform lobe and cerebellum (lobule ⅵ, ⅶ-b and ⅹ, 4/5 area of cerebellar vermis) have a high weight in diagnosis, indicating that the structural abnormalities of these regions play a key role in the pathophysiological mechanism of MDD and StD, and requiring further research.Acknowledgements
NOReferences
1. Guo S, Lai C, Wu C, et al. Conversion Discriminative Analysis on Mild Cognitive Impairment Using Multiple Cortical Features from MR Images. Front Aging Neurosci. 2017, 9: 146.
2. Wu MJ, Mwangi B, Bauer IE, et al. Identification and individualized prediction of clinical phenotypes in bipolar disorders using neurocognitive data, neuroimaging scans and machine learning. Neuroimage. 2017, 145(Pt B): 254-264.
3. Rondina JM, Ferreira LK, de Souza Duran FL, et al. Selecting the most relevant brain regions to discriminate Alzheimer's disease patients from healthy controls using multiple kernel learning: A comparison across functional and structural imaging modalities and atlases. Neuroimage Clin. 2017, 17: 628-641.
4. Johnson WE, Li C, Rabinovic A. Adjusting batch effects in microarray expression data using empirical Bayes methods. Biostatistics. 2007, 8(1): 118-127.
5. Leek JT, Scharpf RB, Bravo HC, et al. Tackling the widespread and critical impact of batch effects in high-throughput data. Nat Rev Genet. 2010, 11(10): 733-739.
6. Leithner D, Schoder H, Haug AR, et al. Impact of ComBat harmonization on PET radiomics-based tissue classification: a dual-center PET/MR and PET/CT study. J Nucl Med. 2022, 121: 263102.
7. Saint Martin MJ, Orlhac F, Akl P, et al. A radiomics pipeline dedicated to breast MRI: validation on a multi-scanner phantom study. MAGMA. 2021, 34(3): 355-366.
8. Jovicich J, Czanner S, Greve D, et al. Reliability in multi-site structural MRI studies: effects of gradient non-linearity correction on phantom and human data. Neuroimage. 2006, 30(2): 436-443.
9. Fortin JP, Parker D, Tunç B, et al. Harmonization of multi-site diffusion tensor imaging data. Neuroimage. 2017, 161: 149-170.
10. Orlhac F, Lecler A, Savatovski J, et al. How can we combat multicenter variability in MR radiomics? Validation of a correction procedure. Eur Radiol. 2021, 31(4): 2272-2280.
11. Radloff LS. The CES-D scale: a self-report depression scale for research in the general population. Applied Psychological Measurement. 1977, 1(3): 385-401.
12. Kliem S, Beller J, Tibubos AN, et al. A reanalysis of the center for epidemiological studies depression scale (CES-D) using non-parametric item response theory. Psychiatry Res. 2020, 290: 113132.
13. American Psychiatric Association. Diagnostic and statistical manual of mental disorders, 5th edn. Washington, DC: American Psychiatric Association, 2013.
14. Ashburner J, Friston KJ. Unified segmentation. Neuroimage. 2005, 26(3): 839-851.
15. Tzourio-Mazoyer N, Landeau B, Papathanassiou D, et al. Automated anatomical labeling of activations in SPM using a macroscopic anatomical parcellation of the MNI MRI single-subject brain. Neuroimage. 2002, 15(1): 273-289.
16. Feindel W. The Montreal Neurological Institute. J Neurosurg. 1991, 75(5): 821-822.
Figures