5050
Evaluation of neurotransmitter profiles in the Auditory Cortex in Children with Autism Spectrum Disorder1Department of Radiology and Biomedical Imaging, University of California San Francisco, San Francisco, CA, United States, 2Department of Psychiatry and Behavioral Sciences, University of California San Francisco, San Francisco, CA, United States
Synopsis
Keywords: Psychiatric Disorders, Neuro, Spectroscopy
In this study, we used an automated spectral prescription method that predefined the left and right auditory cortex to compare neurotransmitter concentrations between ASD and typically developing control (TDC) and evaluate their relationship to age, sex, and verbal abilities. We found metabolic differences in GABA+ concentrations between the left and right auditory cortex in TDC and ASD. However, no significance was found between TDC and ASD or between ASD with intact speech and impaired speech.Introduction
Autism spectrum disorder (ASD) is a neurodevelopmental disorder that impacts social interaction and communication. A neurobiology theory hypothesizes that ASD is caused by an imbalance between excitatory and inhibitory (E/I) neurotransmission1. Glutamate (excitatory) and γ-aminobutyric acid (GABA, inhibitory) are the main neurotransmitters in the brain, which can be noninvasively measured using in vivo proton magnetic resonance spectroscopy (1H MRS). Previous MRS studies have shown lower GABA and GABA+ (GABA + macromolecules) levels across a number of brain regions, including the auditory cortex, in children and adolescents with ASD compared to their typically developing peers2,3,4,5. Despite these promising findings, the results have been more variable6,7,8. In this study, we used an automated spectral prescription method that predefined the left and right auditory cortex9 to compare neurotransmitter concentrations between ASD and typically developing control (TDC) and evaluate their relationship to age, sex and language levels.Methods
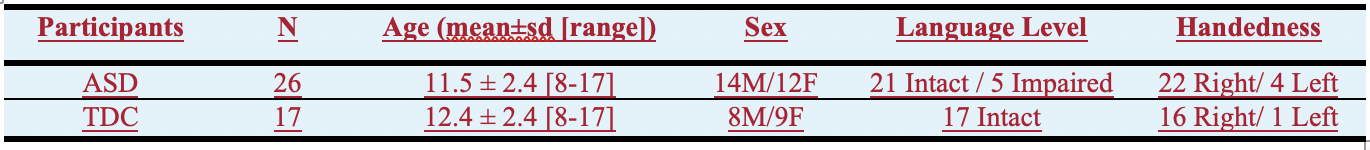
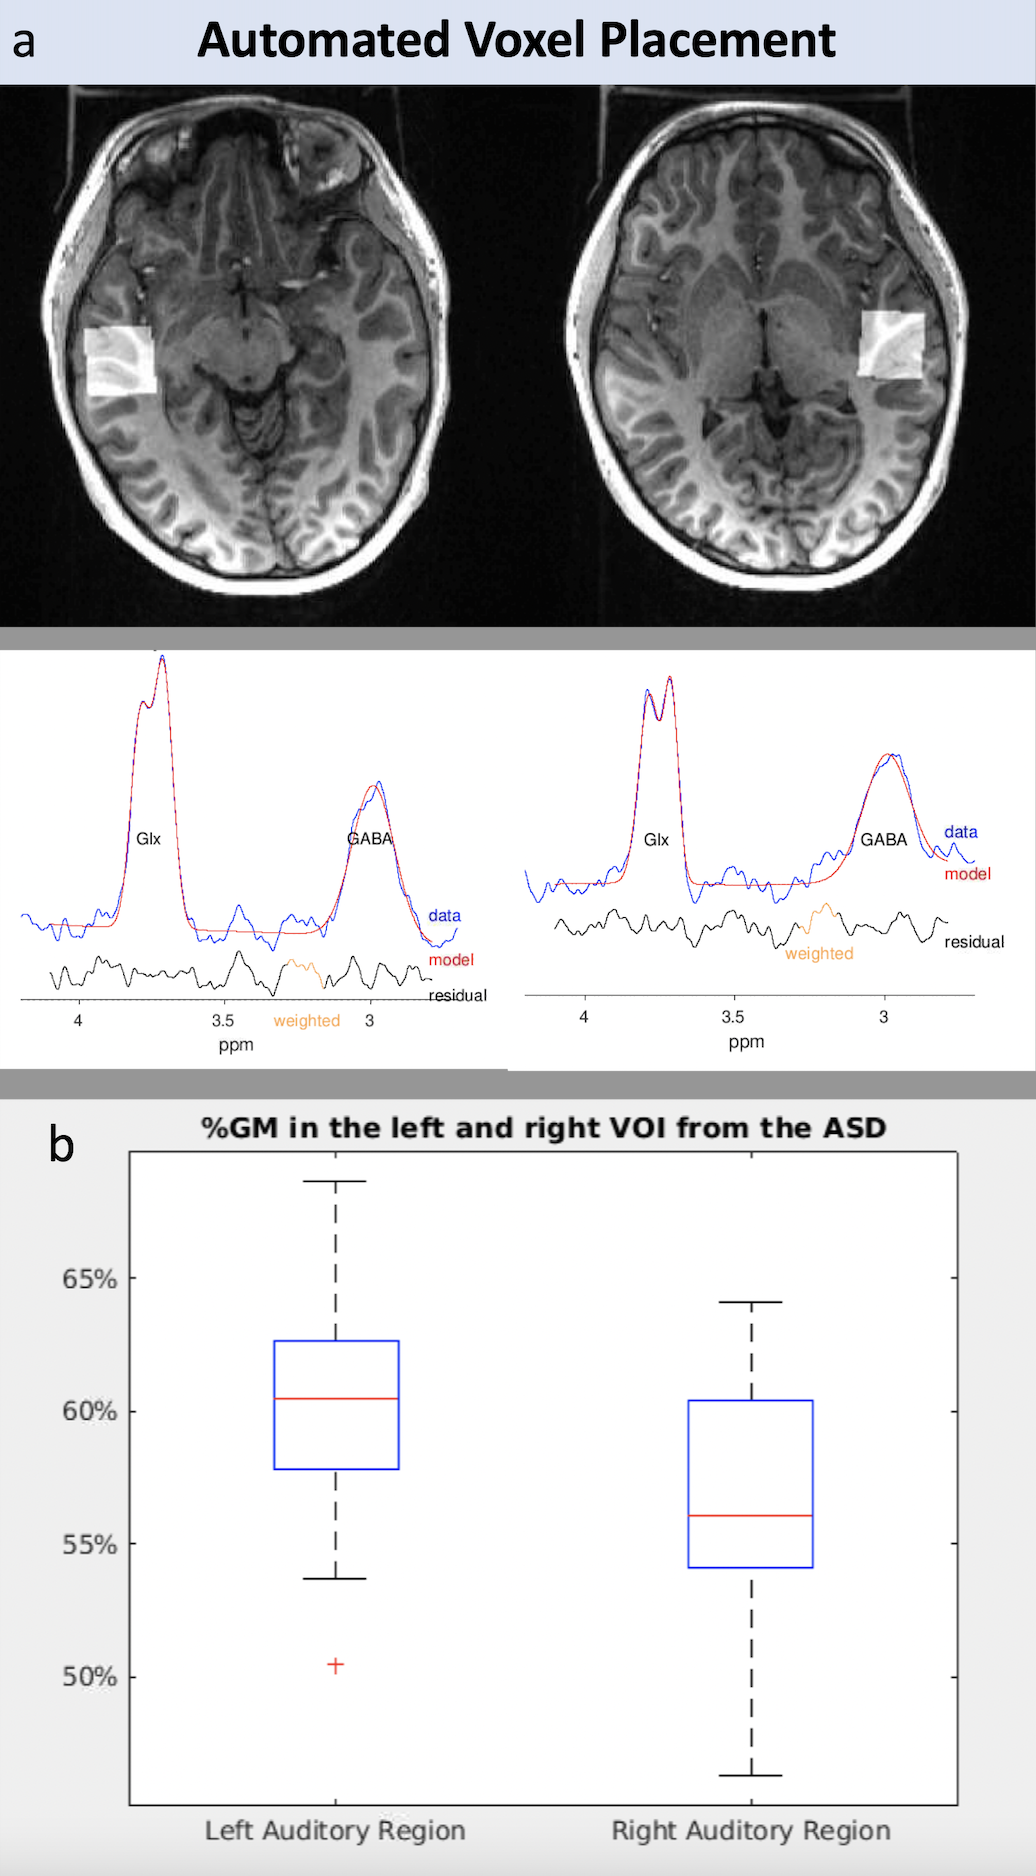
Twenty-six children with ASD and 17 TDC participated in the study. The characteristics of study population is illustrated in Figure 1. All the participants were classified in terms of speech fluency via the NEPSY-II Inhibition Naming Time scaled score and speech accuracy via the Goldman Fristoe Test of Articulation-3rd Edition (GFTA-3) Sounds-In-Words subtest standard score. Participants who scored in the Average or above range on both measures (Naming Time >=6 and GFTA-3>=80) were classified as speech-intact. Those who were below average on either speech fluency or speech accuracy were classified as intermediate. Finally, those who scored in the below average range on both measures were classified as speech impaired. MR data were acquired using a 32-channel coil on a 3T MR scanner (GE Healthcare, Waukesha, WI). Each single voxel GABA-edited BASING-PRESS MRS was obtained using TE/TR = 68/2000 ms, 128 transients, and 15ms Gaussian editing pulses placed at 1.9 and 8.5 ppm, with an automatic prescription to specify the predefined location of the volume of interest (VOI). The voxel size was fixed at 2.5x2.5x2.5 cm. An example of voxel placement for the right and left auditory cortex and spectra data is shown in Figure 2. Spectral data were processed and quantified using Gannet10, version 3.1 to provide the estimates of GABA+ and Glx (glutamate+glutamine) concentrations. Tissue component within each voxel were segmented using spm12. The tissue component, including the fraction of grey matter (GM%) and white matter (WM%), and metabolite parameters were compared between the right and left VOI within-subject using two-sample t-tests for each group. Pearson correlation coefficients were calculated to examine the relationship between metabolite parameters and age/sex in TDC. Multivariable linear regression models adjusted for age were used to examine group differences in metabolite parameters.Results and Discussion
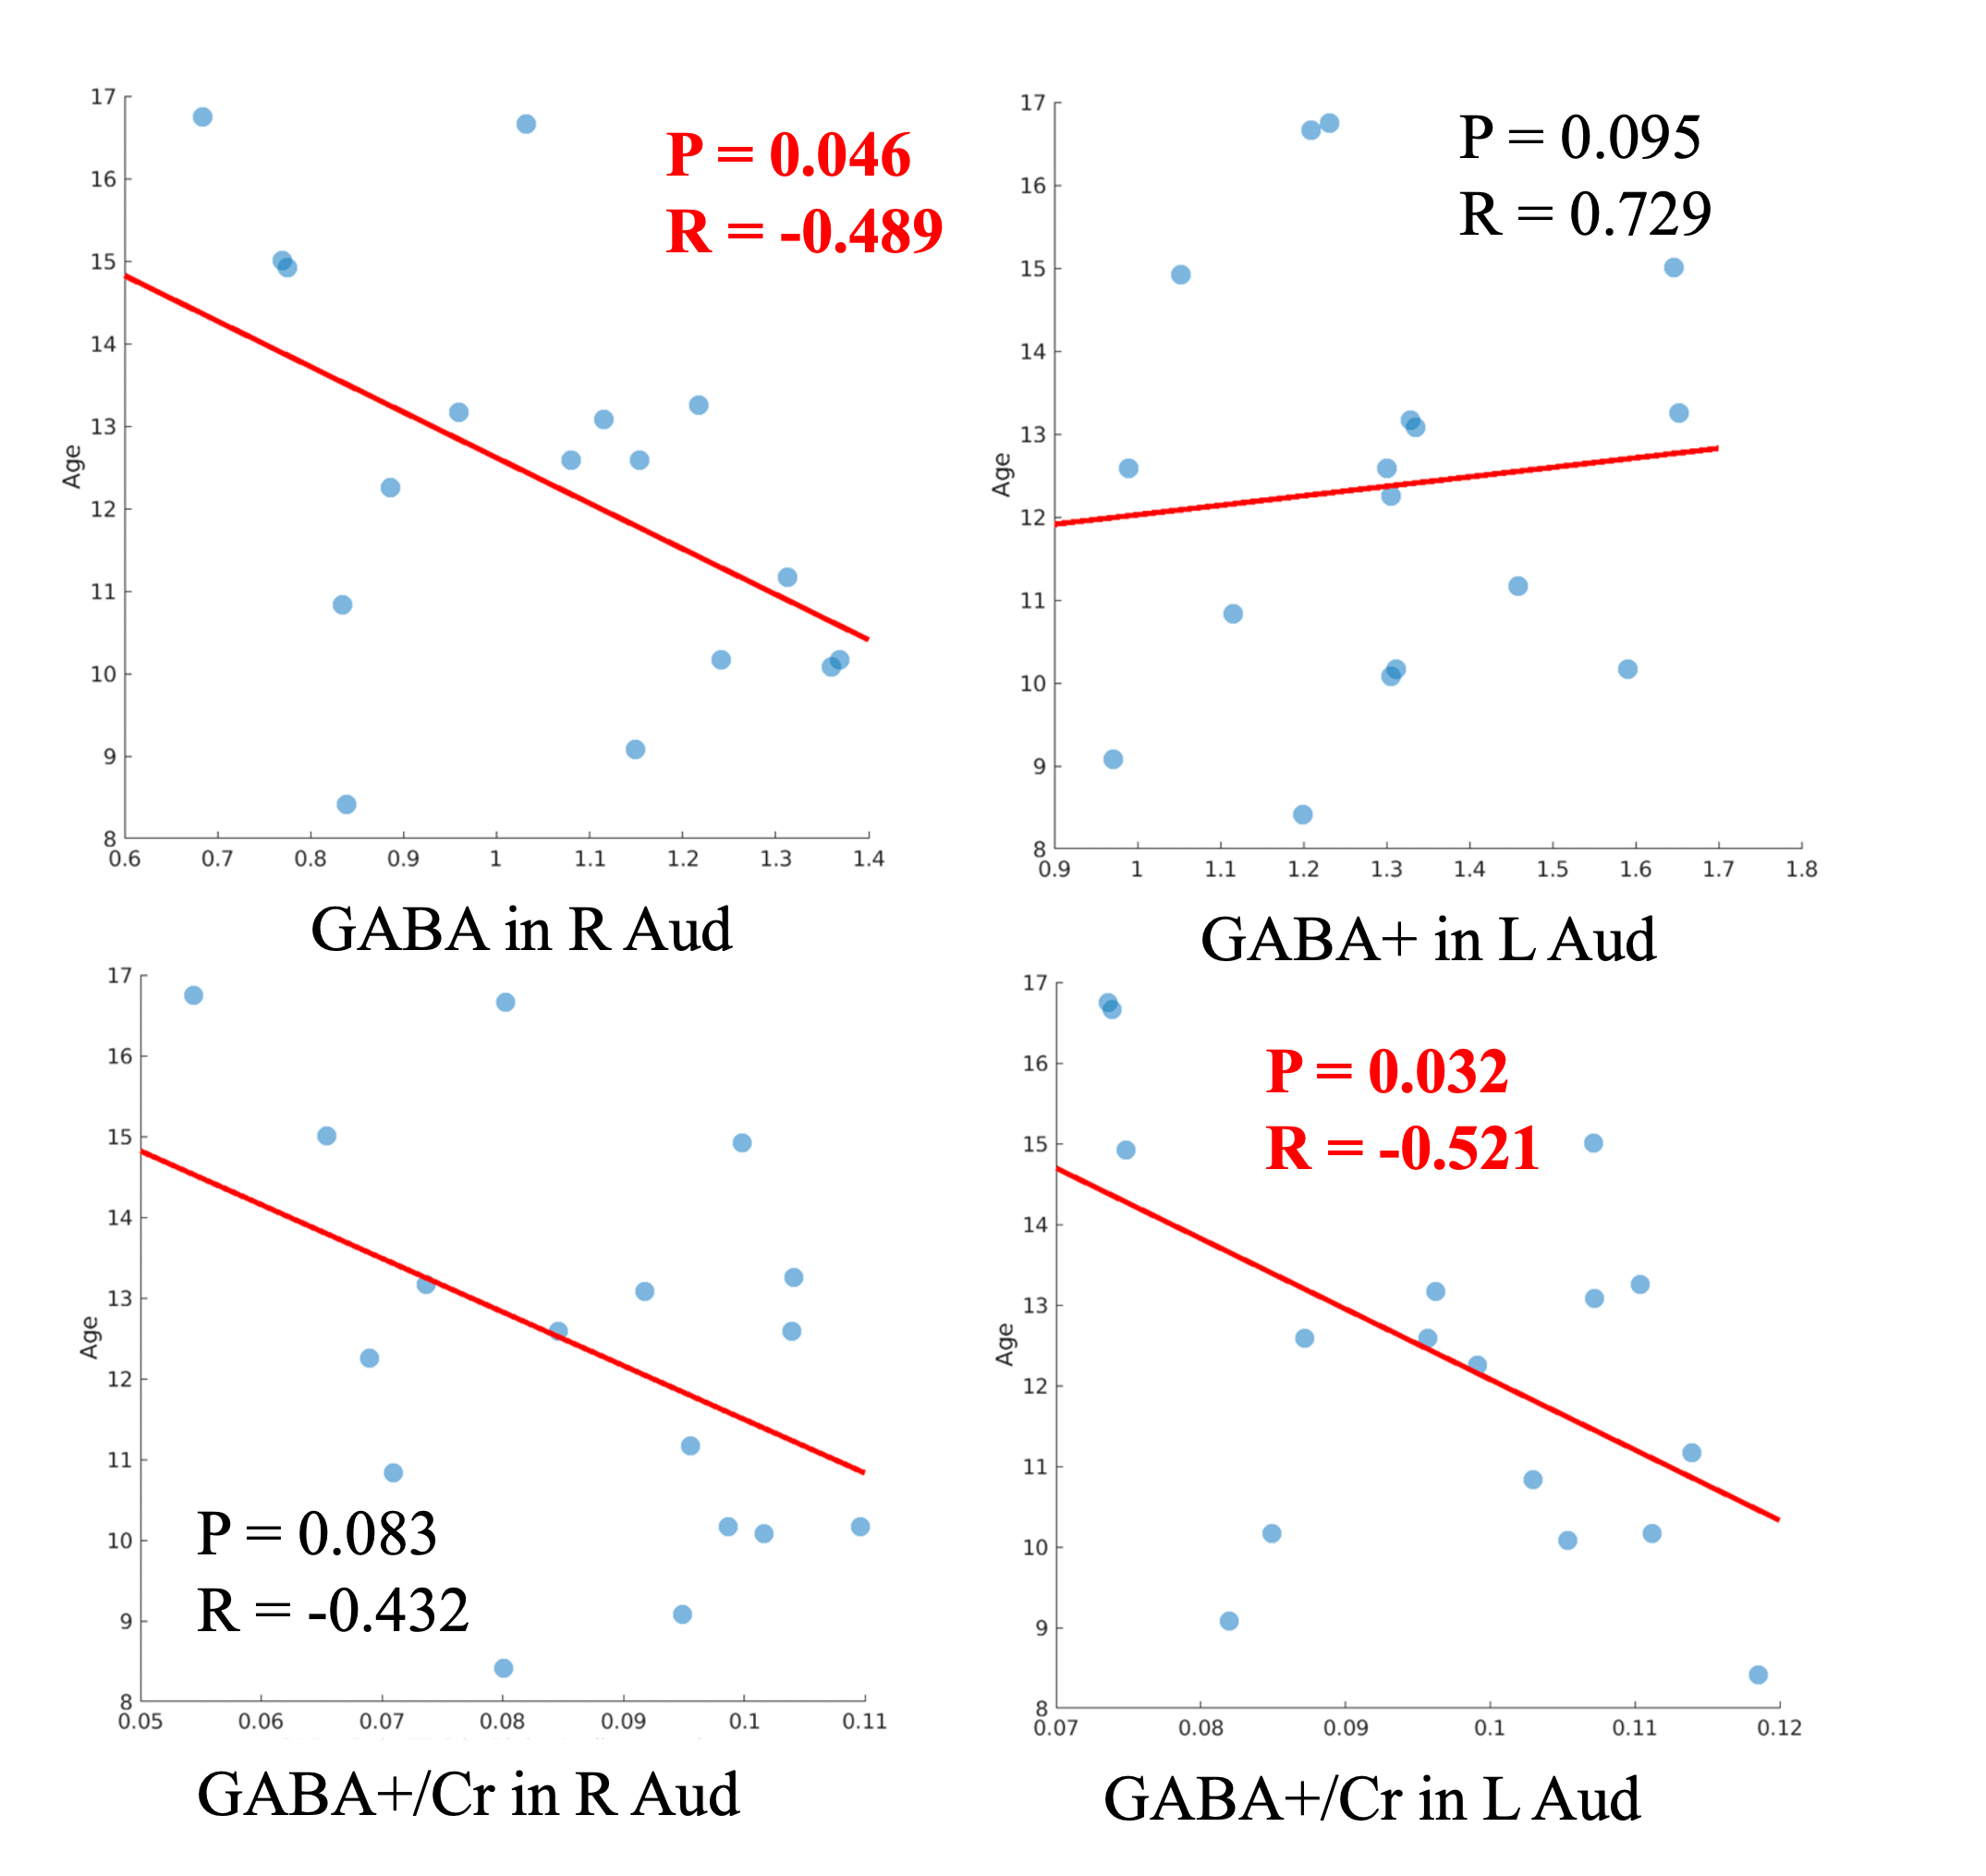
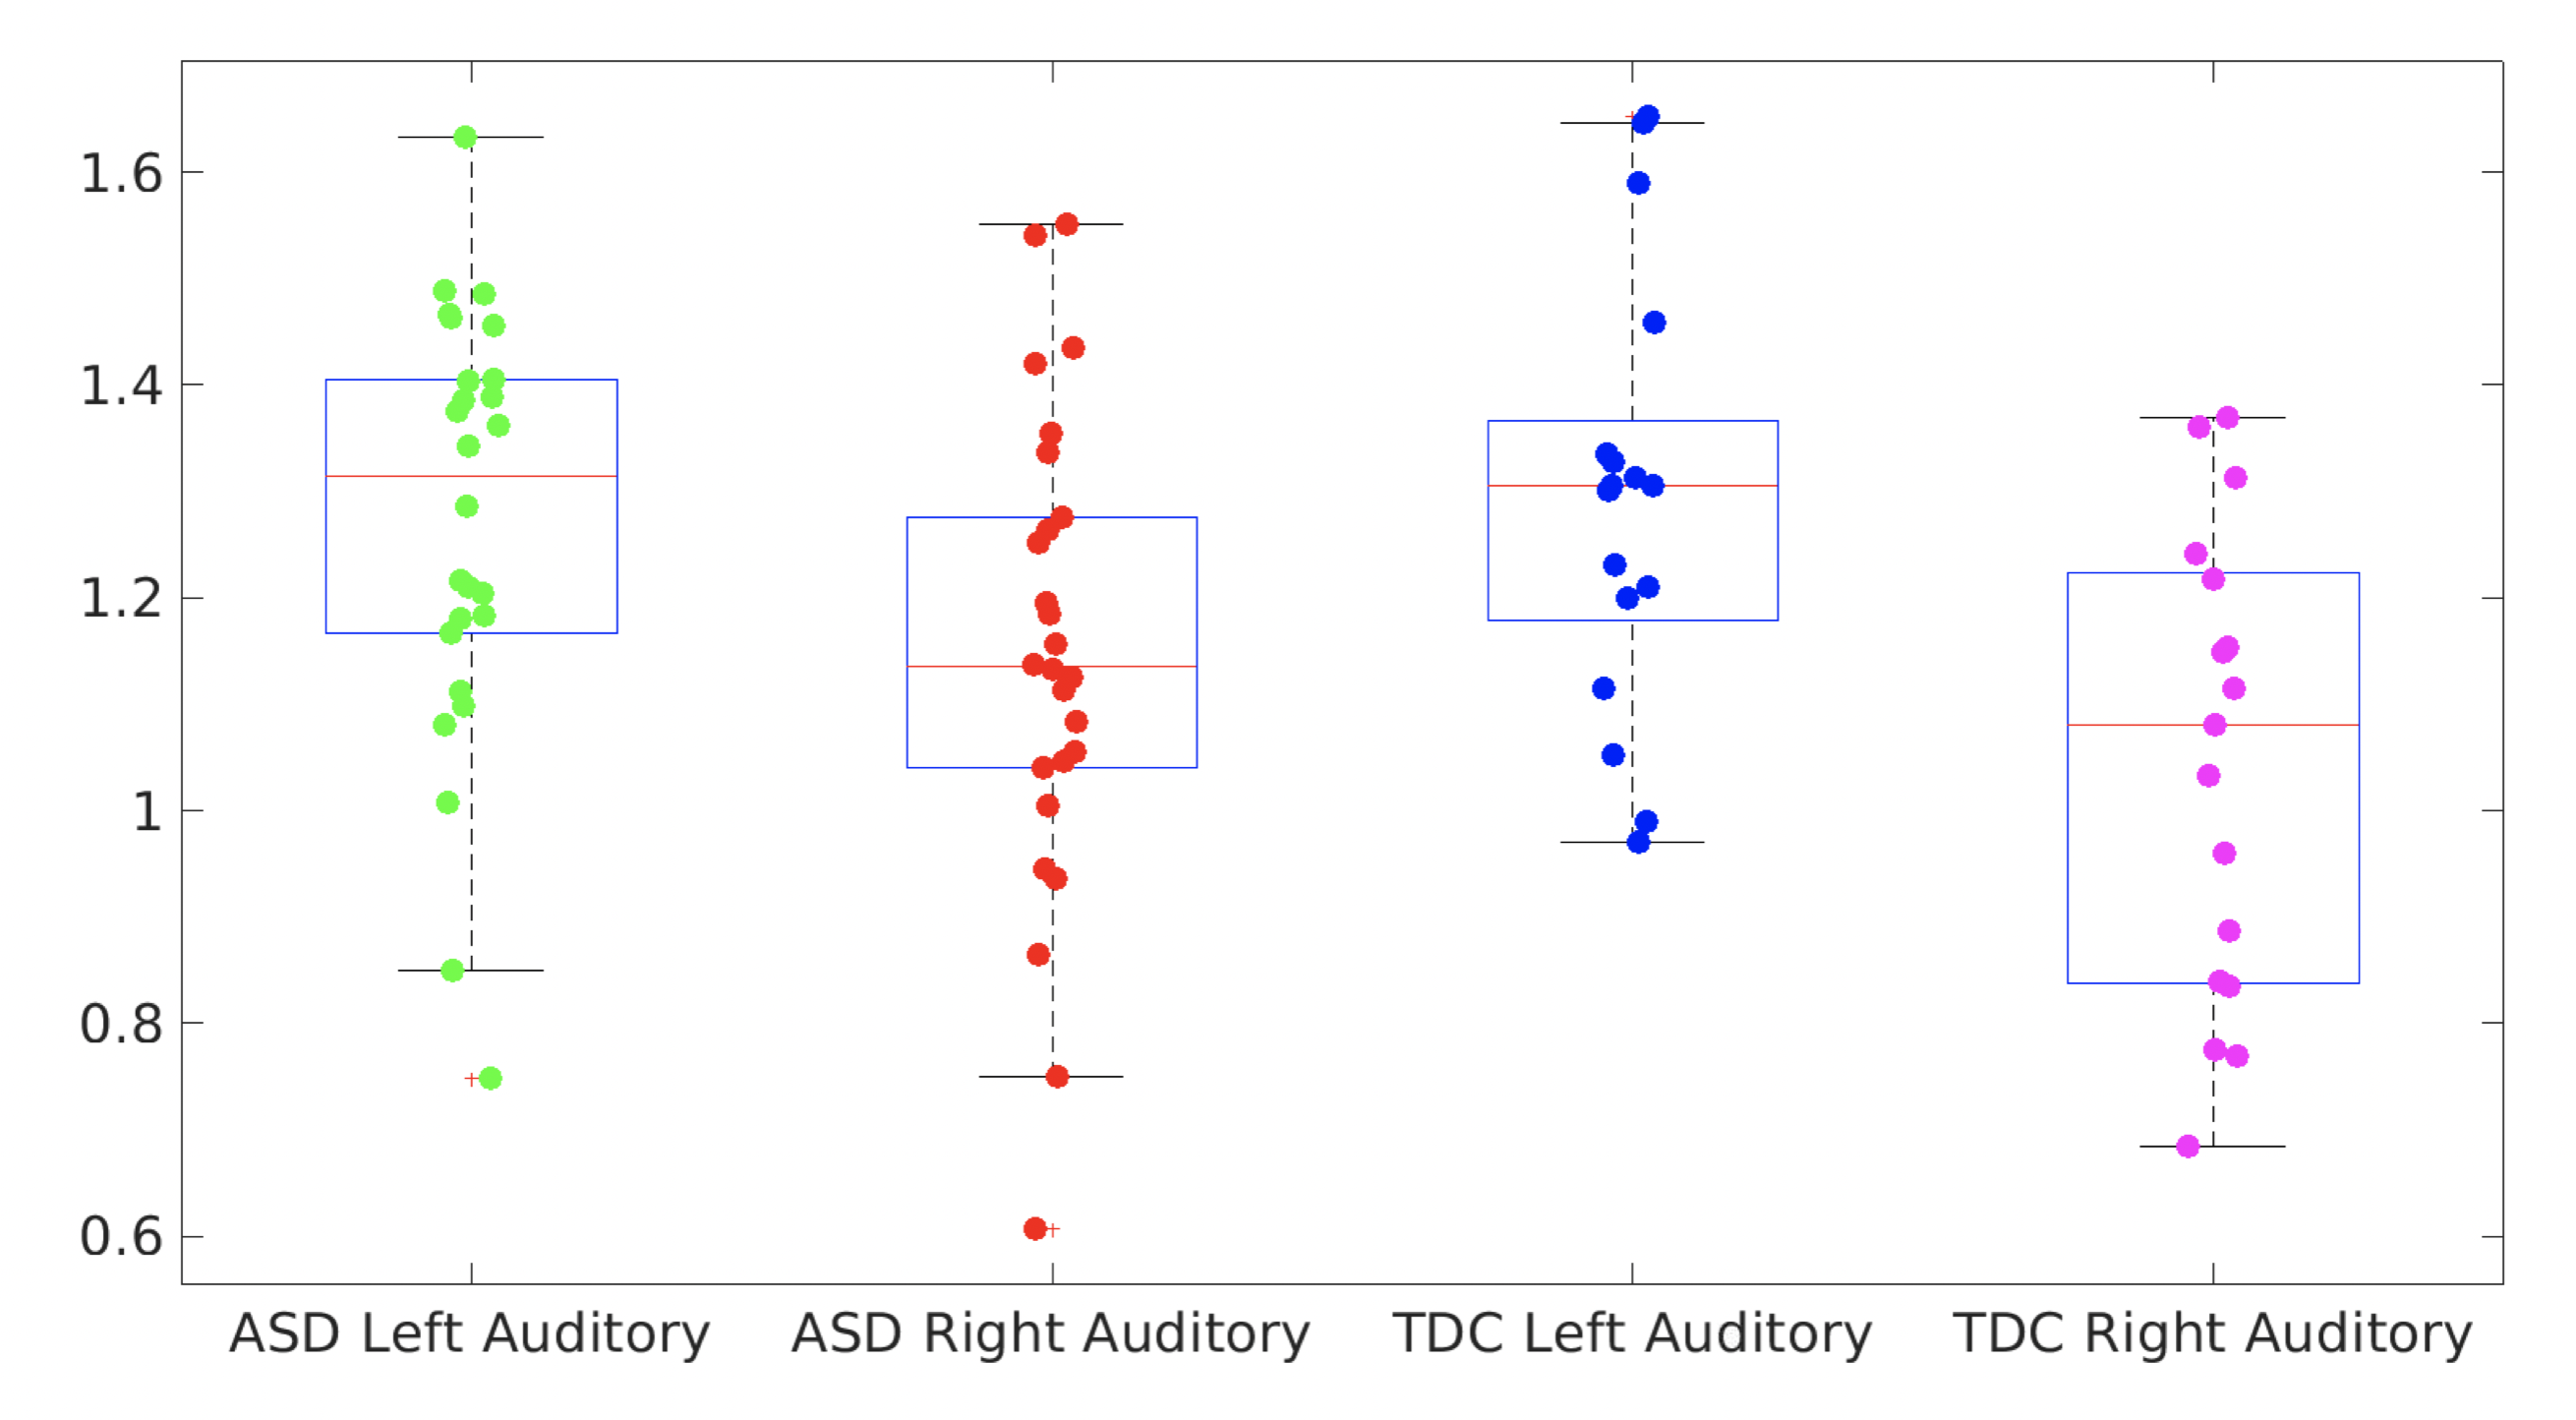
No statistically significant difference in tissue component was found between right and left VOI in TDC. However, ASD had significantly higher WM% in the right VOI compared to their left VOI (p = 0.0019; %GM, p = 0.0008) and compared to TDC (p = 0.044), suggesting the reduced GM volume in the right auditory cortex in ASD, which is consistent with the previous finding11. In this study, we used an automated prescription method that predefines spectral VOIs in the MNI152 standard space and then applies them to subject’s space. The accuracy of repositioning the excited volume using this method has shown excellent with dice overlap ratios of 92-95% for single voxel and 97.9±1.6% for multi-voxel acquisitions9. However, these evaluations were performed in adult brains. The fixed voxel size for single voxel acquisition might cause some tissue variations given the location of the right auditory cortex. Further evaluation will be performed on tissue segmentation and voxel placement to exclude whether this difference is due to the technical error. Among TDC, the GABA+/creatine in the left auditory cortex (p = 0.032, r = -0.52) and GABA+ concentration in the right auditory cortex (p = 0.046, r = -0.489) negatively correlated with age (Figure 3), but no difference was found between sex and metabolite parameters. When compared to the right side, GABA+ concentrations (p=0.0018) and GABA+/Glx (p=0.0301) are significantly higher in the left auditory cortex (Figure 4). Note that the majority of the subjects are right-handed except 1 subject. Among ASD, a similar higher GABA+ concentration (p=0.0461) was also found on the left side, but Glx/creatine was higher on the right side of the auditory cortex (p=0.0003) (Figure 4). They were mostly right-handed except 4 pts. In addition, there was no significant difference found in metabolite parameters between ASD and TDC, or between ASD with intact speech and impaired speech. In our study, the number of ASD with impaired speech is relatively small. Future studies will expand these findings to a larger cohort.Conclusion
This study demonstrated differences in GABA and Glx concentration, and GM and WM fractions in children with ASD compared to their typically developing peers. We show here, that no correlation between ASD with intact speech and ASD with impaired speech, or between TDC and ASD, was discovered, but there are metabolic variations in GABA+ concentrations in TDC and ASD between the left and right auditory cortex.Acknowledgements
This study was supported by NIH R21HD092660 and NIH R01DC019167.References
1. Rubenstein JL, Merzenich MM. Model of autism: increased ratio of excitation/inhibition in key neural systems. Genes Brain Behav. 2003 Oct;2(5):255-67
2. Rojas DC, Becker KM, Wilson LB. Magnetic Resonance Spectroscopy Studies of Glutamate and GABA in Autism: Implications for Excitation-Inhibition Imbalance Theory. Current Developmental Disorders Reports. 2015;2(1):46–57.
3. Gaetz, W., Bloy, L., Wang, D. J., Port, R. G., Blaskey, L., Levy, S. E., & Roberts, T. P. (2014). GABA estimation in the brains of children on the autism spectrum: Measurement precision and regional cortical variation. NeuroImage, 86, 1–9.
4. Port, R. G., Gaetz, W., Bloy, L., Wang, D.-J., Blaskey, L., Kuschner, E. S., Levy, S. E., Brodkin, E. S., & Roberts, T. P. L. (2017). Exploring the relationship between cortical GABA concentrations, auditory gamma-band responses and development in ASD: Evidence for an altered maturational trajectory in ASD. Autism Research, 10(4), 593–607.
5. Rojas, D. C., Singel, D., Steinmetz, S., Hepburn, S., & Brown, M. S. (2014). Decreased left perisylvian GABA concentration in children with autism and unaffected siblings. NeuroImage, 86, 28–34.
6. Page LA, Daly E, Schmitz N, Simmons A, Toal F, Deeley Q, Ambery F, McAlonan GM, Murphy KC, Murphy DG. In vivo 1H-magnetic resonance spectroscopy study of amygdala-hippocampal and parietal regions in autism. Am J Psychiatry. 2006 Dec;163(12):2189-92.
7. Bernardi S, Anagnostou E, Shen J, Kolevzon A, Buxbaum JD, Hollander E, Hof PR, Fan J. In vivo 1H-magnetic resonance spectroscopy study of the attentional networks in autism. Brain Res. 2011 Mar 22;1380:198-205.
8. DeVito TJ, Drost DJ, Neufeld RW, Rajakumar N, Pavlosky W, Williamson P, Nicolson R. Evidence for cortical dysfunction in autism: a proton magnetic resonance spectroscopic imaging study. Biol Psychiatry. 2007 Feb 15;61(4):465-73.
9. Bian W, Li Y, Crane JC, Nelson SJ. Fully automated atlas-based method for prescribing 3D PRESS MR spectroscopic imaging: Toward robust and reproducible metabolite measurements in human brain. Magn Reson Med. 2018 Feb;79(2):636-642.
10. R.A.E. Edden, N.A.J. Puts, A.D. Harris, P.B. Barker, C.J.Evans. Gannet: A batch-processing tool for the quantitative analysis of gamma-aminobutyric acid–edited MR spectroscopy spectra. J. Magn. Reson. Imaging, 40 (2014), pp. 1445-1452
11. Greimel E, Nehrkorn B, Schulte-Rüther M, Fink GR, Nickl-Jockschat T, Herpertz-Dahlmann B, Konrad K, Eickhoff SB. Changes in grey matter development in autism spectrum disorder. Brain Struct Funct. 2013 Jul;218(4):929-42.
Figures