5049
GABA Alterations Associated with Social Cognition Deficits in Youth with Autism Spectrum Disorder Compared to Early-Onset Psychosis1Psychology, Loma Linda University, Loma Linda, CA, United States, 2Psychiatry, University of California, Los Angeles, Los Angeles, CA, United States, 3Psychology, University of California, Los Angeles, Los Angeles, CA, United States, 4Radiology, Loma Linda University, Loma Linda, CA, United States
Synopsis
Keywords: Psychiatric Disorders, Spectroscopy, Adolecents
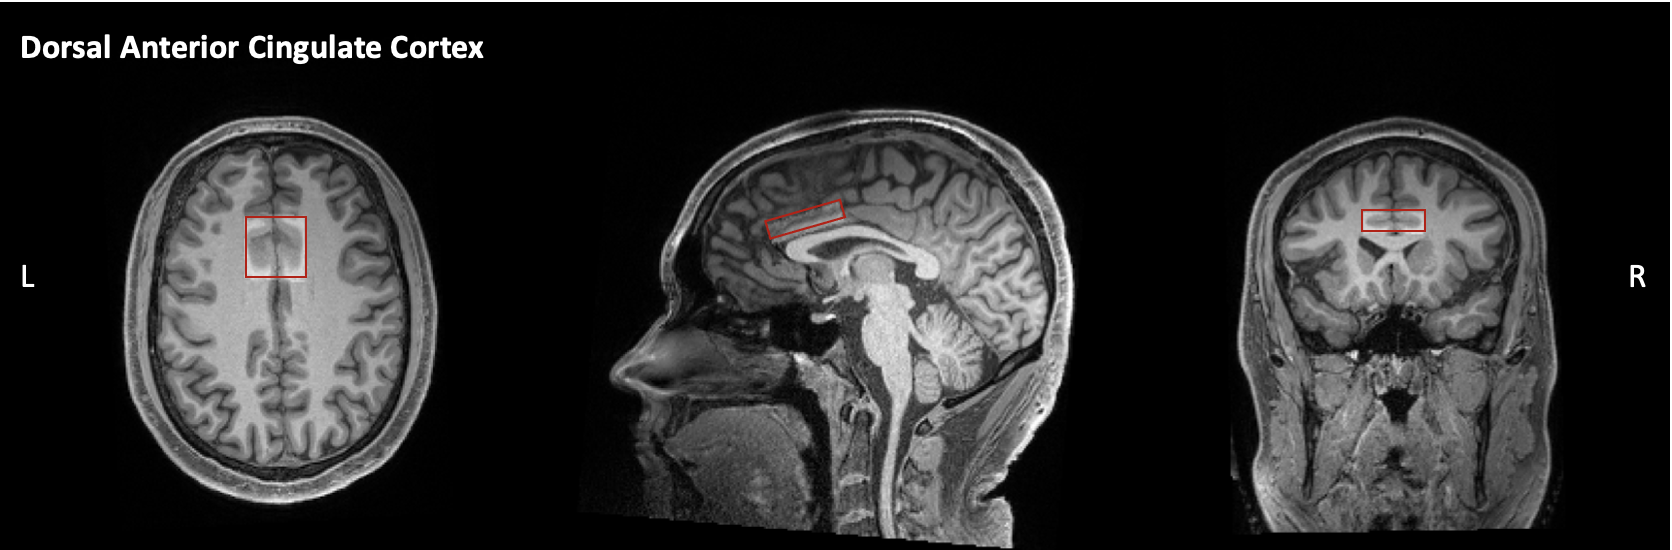
Proton magnetic resonance spectroscopy (1H-MRS) can provide valuable information about cortical activity and metabolite concentrations. Previous research using MRS has found alterations in the concentrations of neurotransmitters in neuropsychiatric disorders, notably in autism spectrum disorder (ASD) and early-onset psychosis (EOP). We used 1H-MRS to quantify signals associated with neurotransmitters in the dorsal anterior cingulate cortex (dACC), a brain region underlying social cognition, by measuring metabolite concentrations and its relationship to social impairments, in youth with ASD or EOP, and typically developing (TD) youth.
Introduction
Previous cross-sectional imaging studies have found an imbalance in the ratio of excitatory-inhibitory (E/I) cortical activity that may underlie the social impairments observed in autism spectrum disorder (ASD) and early-onset psychosis (EOP)1-4. The E/I imbalance theory posits the dysregulation of gamma-aminobutyric acid (GABA) and glutamate (Glu) neurometabolite concentrations, as a plausible mechanism to explain dysfunctional brain circuits in neurodevelopmental disorders, including ASD and EOP5,6. In this study we used MRS to examine NAA plus NAA-glutamate (tNAA), GABA+, and glutamate and glutamine (Glx) ratios with total creatine (tCr) in the dorsal anterior cingulate cortex (dACC) of adolescents with ASD, EOP, and typical development (TD) to assess changes in neurometabolite signaling previously evidenced in these neuropsychiatric groups.Methods
Magnetic resonance data were acquired on a 3-Tesla Siemens PRISMA scanner with 64-channel head coil for 25 adolescents with ASD aged 12-21 years (Mean age = 15.89), 23 age-matched EOP adolescents (Mean age = 16.42), and 21 age-matched TD controls (Mean age = 17.25). A T1-weighted, three-dimension magnetization-prepared rapid gradient-echo (MPRAGE) sequence was acquired and was prescribed parallel to the AC-PC line. 1H-MRS spectra were acquired using MEGA point-resolved selective spectroscopy (PRESS, TR/TE = 2000/68 ms). The 1H-MRS voxel was placed in the dACC (30 x 38 x 10 mm, Fig. 1). MEGA-PRESS data analysis was completed in the MATLAB-based toolbox Osprey7. Ratios of the following metabolite concentrations to tCr were quantified: GABA+, Glx, and tNAA. The social measure included was the WebCNP Emotion Differentiation Test (MEDF-36)8, which measures the ability to differentiate the intensity of facial expressions of emotion. Between-group differences were measured using univariate analysis of variance where p < .05 was considered significant. Pearson’s correlations were used to determine the relationship between neurometabolite concentrations and the MEDF-36 accuracy scores.Results
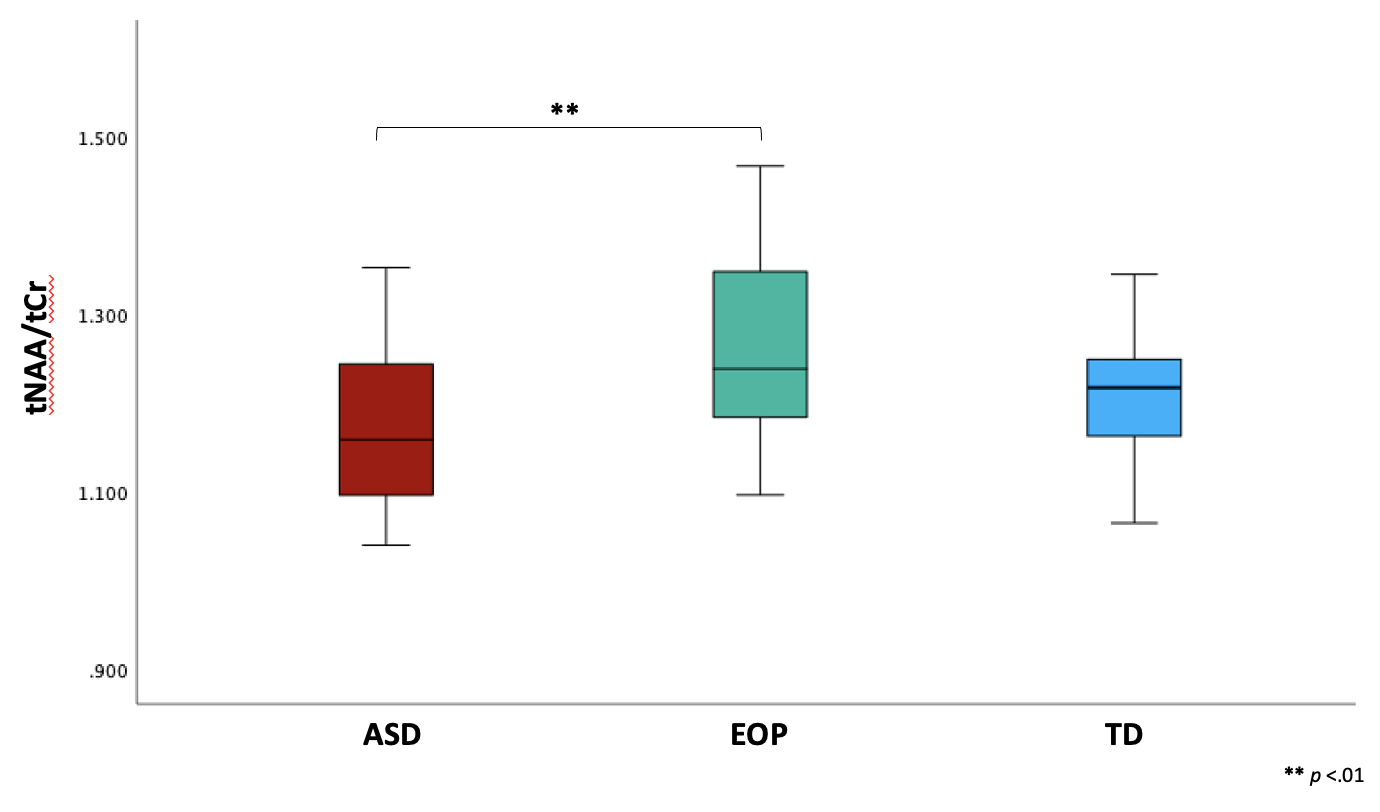
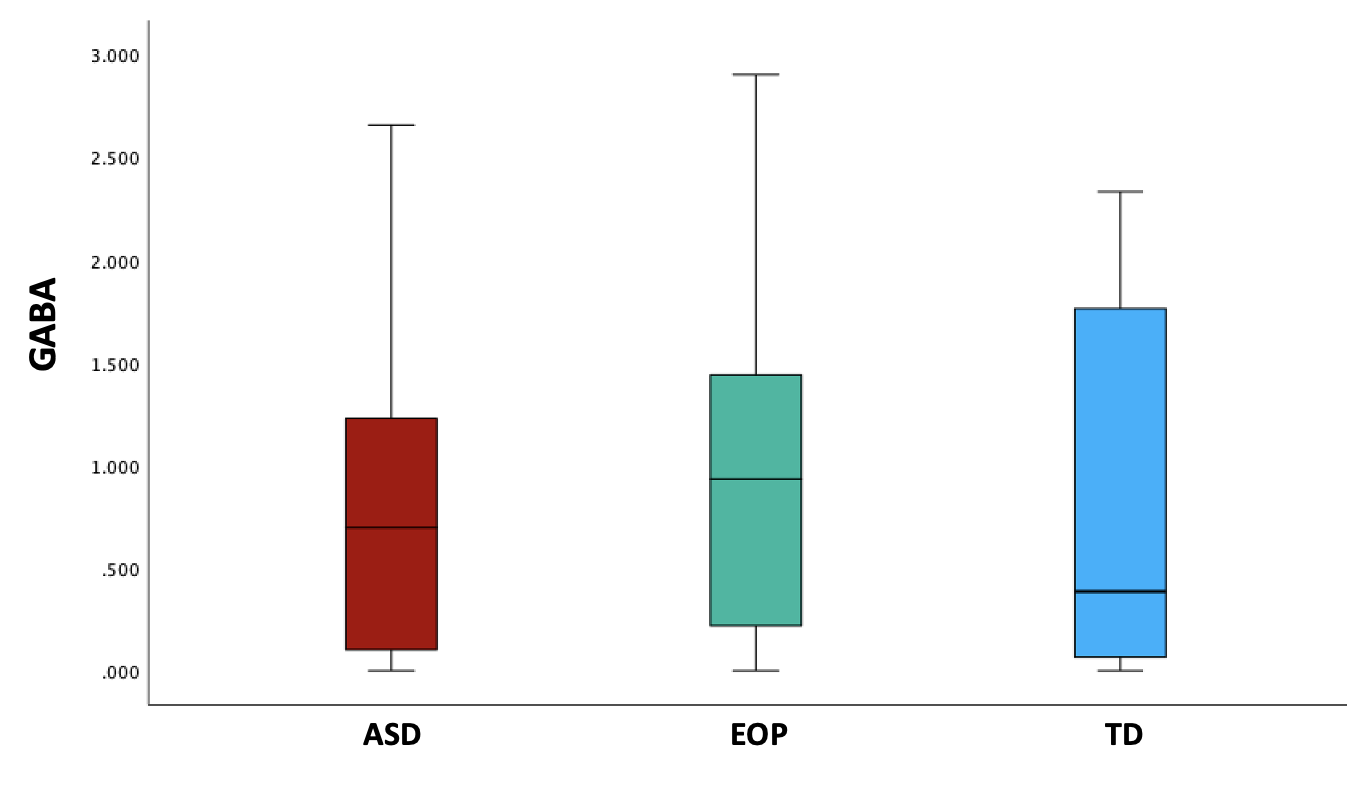
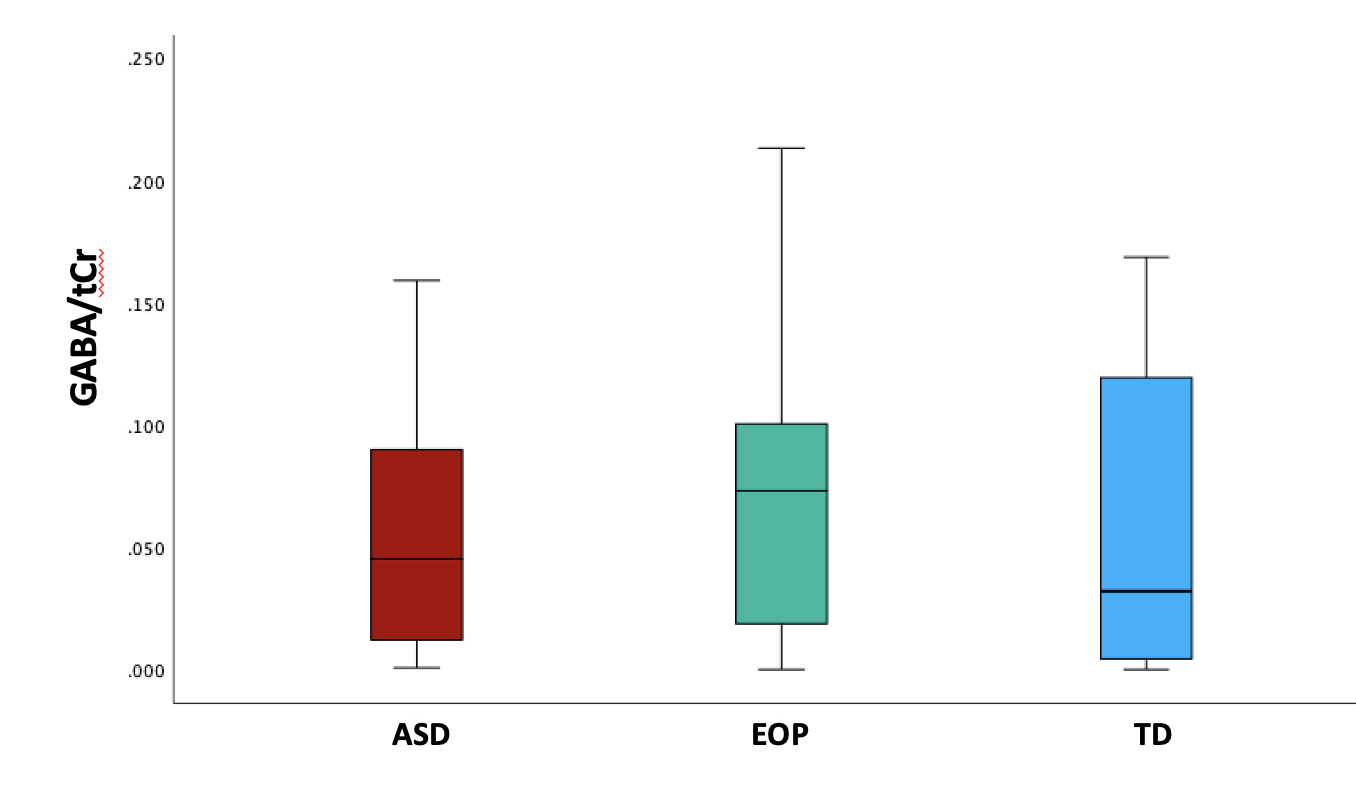
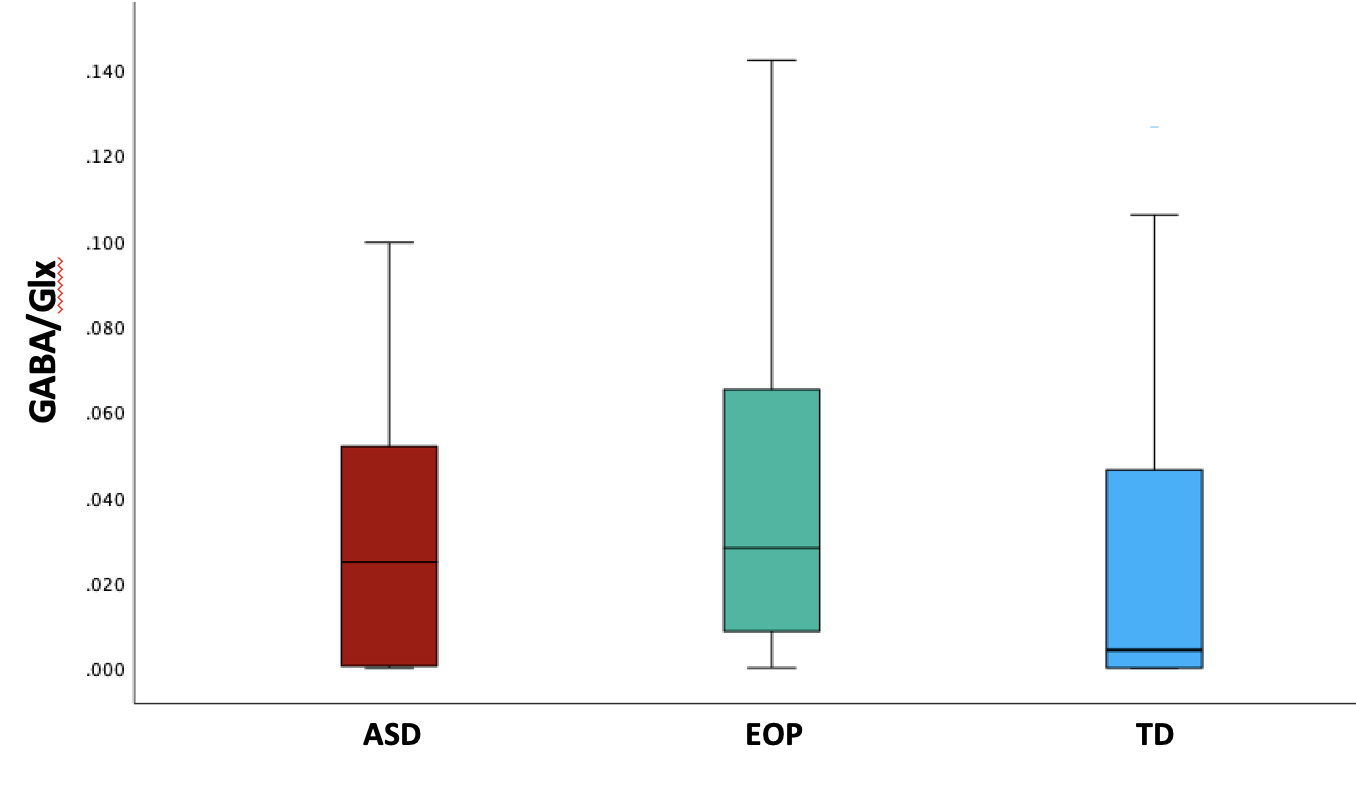
Between-group results revealed a significant difference of tNAA/tCr between the ASD and EOP group (p < .01), where EOP showed a higher concentration of tNAA/tCr in the dACC compared to both ASD group and TD controls (Fig. 2A). Additionally, better performance on the MEDF-36 task was associated with higher tNAA/tCr in ASD (r = .54, p < .05), but lower tNAA/tCr in TD controls (r = -.60, p < .05). No other significant group differences in neurometabolite concentrations of GABA+, GABA+/tCr, and GABA+/Glx (Fig. 2B-D) were observed. However, higher GABA+ (r = -.57, p < .05) and higher GABA+/tCr (r = -.54, p < .05) was associated with poorer performance on the MEDF-36 task in the ASD group, compared to EOP and TD controls. Higher GABA+/Glx was also associated with poorer performance on the MEDF-36 task in the ASD group (r = -.57, p < .05), compared to EOP and TD controls.Discussion
These findings suggest that differences in metabolite ratios can be attributed to the underlying pathophysiology of ASD and EOP. Specifically, EOP youth demonstrated higher NAA/tCr than both ASD youth and TD controls. Reductions in NAA have previously been identified in ASD compared to healthy controls in the ACC9 as well as other brain regions10,11. While few studies have investigated NAA in the dACC of subjects with first-episode psychosis, previous MRS studies have reported normal to elevated NAA levels in early schizophrenia in several brain regions, with reduced NAA levels observed in chronic schizophrenia12,13. In addition, reduced white matter NAA levels have been reported in the prefrontal cortex in chronic schizophrenia compared to early-onset psychosis, suggesting that NAA levels tend to decrease with illness progression13. Thus, our findings could suggest an initial increase of NAA may be observed in EOP, and reduced NAA in ASD could be due to neuronal hypofunction and axonal loss, as speculated in the previously mentioned studies10,13. Additionally, the ASD group showed a higher concentration of inhibitory neurometabolites such as GABA+ and its ratios to tCr and Glx, which were most associated with difficulty in differentiating facial emotions. Prior studies have postulated reduced GABA+ and elevated Glx in ASD and EOP14,15; however, few have examined metabolic concentrations in relation to social cognition tasks in these populations during the adolescent years. Further examination may be crucial to the understanding of the contribution of these metabolites to face-emotion processing impairments observed within each neuropsychiatric condition.Acknowledgements
K99MH113820, R21MH116433
References
1. Siegel-Ramsay JE, Romaniuk L, Whalley HC, Roberts N, Branigan H, Stanfield AC, Lawrie SM, Dauvermann MR. Glutamate and functional connectivity-support for the excitatory-inhibitory imbalance hypothesis in autism spectrum disorders. Psychiatry Research: Neuroimaging. 2021 Jul 30;313:111302.
2. Carlsson ML. Hypothesis: is infantile autism a hypoglutamatergic disorder? Relevance of glutamate–serotonin interactions for pharmacotherapy. Journal of neural transmission. 1998 Jul;105(4):525-35.
3. Egerton A, Brugger S, Raffin M, Barker GJ, Lythgoe DJ, McGuire PK, Stone JM. Anterior cingulate glutamate levels related to clinical status following treatment in first-episode schizophrenia. Neuropsychopharmacology. 2012 Oct;37(11):2515-21.
4. Howes OD, Shatalina E. Integrating the neurodevelopmental and dopamine hypotheses of schizophrenia and the role of cortical excitation-inhibition balance. Biological psychiatry. 2022 Jun 22.
5. Ajram LA, Pereira AC, Durieux AM, Velthius HE, Petrinovic MM, McAlonan GM. The contribution of [1H] magnetic resonance spectroscopy to the study of excitation-inhibition in autism. Progress in Neuro-Psychopharmacology and Biological Psychiatry. 2019 Mar 8;89:236-44.
6. Allen P, Sommer IE, Jardri R, Eysenck MW, Hugdahl K. Extrinsic and default mode networks in psychiatric conditions: Relationship to excitatory-inhibitory transmitter balance and early trauma. Neuroscience & Biobehavioral Reviews. 2019 Apr 1;99:90-100.
7. Oeltzschner G, Zöllner HJ, Hui SC, Mikkelsen M, Saleh MG, Tapper S, Edden RA. Osprey: Open-source processing, reconstruction & estimation of magnetic resonance spectroscopy data. Journal of neuroscience methods. 2020 Sep 1;343:108827.
8. Gur RC, Richard J, Hughett P, Calkins ME, Macy L, Bilker WB, Brensinger C, Gur RE. A cognitive neuroscience-based computerized battery for efficient measurement of individual differences: standardization and initial construct validation. Journal of neuroscience methods. 2010 Mar 30;187(2):254-62.
9. Tebartz van Elst L, Maier S, Fangmeier T, Endres D, Mueller GT, Nickel K, Ebert D, Lange T, Hennig J, Biscaldi M, Riedel A. Disturbed cingulate glutamate metabolism in adults with high-functioning autism spectrum disorder: evidence in support of the excitatory/inhibitory imbalance hypothesis. Molecular psychiatry. 2014 Dec;19(12):1314-25.
10. Otsuka H, Harada M, Mori K, Hisaoka S, Nishitani H. Brain metabolites in the hippocampus-amygdala region and cerebellum in autism: an 1H-MR spectroscopy study. Neuroradiology. 1999 Jul;41(7):517-9.
11. Horder J, Lavender T, Mendez MA, O'gorman R, Daly E, Craig MC, Lythgoe DJ, Barker GJ, Murphy DG. Reduced subcortical glutamate/glutamine in adults with autism spectrum disorders: a [1H] MRS study. Translational psychiatry. 2013 Jul;3(7):e279-.
12. Port JD, Agarwal N. MR spectroscopy in schizophrenia. Journal of Magnetic Resonance Imaging. 2011 Dec;34(6):1251-61.
13. Liemburg E, Sibeijn-Kuiper A, Bais L, Pijnenborg G, Knegtering H, Van der Velde J, Opmeer E, de Vos A, Lange DD, Wunderink L, Aleman A. Prefrontal NAA and Glx levels in different stages of psychotic disorders: a 3T 1H-MRS study. Scientific reports. 2016 Feb 23;6(1):1-8.
14. Kolodny T, Schallmo MP, Gerdts J, Edden RA, Bernier RA, Murray SO. Concentrations of cortical GABA and glutamate in young adults with autism spectrum disorder. Autism Research. 2020 Jul;13(7):1111-29.
15. Marsman A, Mandl RC, Klomp DW, Bohlken MM, Boer VO, Andreychenko A, Cahn W, Kahn RS, Luijten PR, Pol HE. GABA and glutamate in schizophrenia: A 7 T 1H-MRS study. NeuroImage: Clinical. 2014 Jan 1;6:398-407.
Figures