5047
7T MRI in Tourette syndrome and correlations with clinical ratings1NMR Group, Max Planck Institute for Human Cognitive and Brain Sciences, Leipzig, Germany, 2Clinic of Psychiatry, Social Psychiatry and Psychotherapy, Hannover Medical School, Hannover, Germany, 3Department of Nuclear Medicine, University of Leipzig, Leipzig, Germany, 4Max Planck Institute for Human Cognitive and Brain Sciences, Leipzig, Germany
Synopsis
Keywords: Psychiatric Disorders, Quantitative Susceptibility mapping, QSM, 7T, Tourette Syndrome, Substantia Nigra, Basal Ganglia
In this study, we used 7T MRI for identifying potential local associations of Quantitative Susceptibility Mapping (QSM) with tic severity in patients with Gilles de la Tourette syndrome (GTS), as well as T1w volumes for VBM analysis of the cerebellum. Our results indicate direct correlations of tic severity with the QSM values in substantia nigra and other basal ganglia regions, supporting the hypothesis that iron imbalance play a significant role in neurotransmitter dysregulations that lead to the symptomatology of GTS. VBM results show previously unreported GM morphometry alterations in Crus-I, a cerebellar region implicated in visual-motor integration, attention and cognition.Introduction
The manifestation of Gilles de la Tourette syndrome (GTS), a neuropsychiatric movement disorder, is closely related to neurotransmitter dysregulations, including the dopaminergic, glutamatergic and GABAergic systems1,2. The cortico-striatal and brainstem-striatal networks are thought to be roots of the pathogenesis, which leads to distinct motor and vocal tics in patients with GTS1. Substantia nigra (SN), red nucleus (RN), pallidum, caudate, putamen and thalamus are areas of interest3,4,5. Brain iron plays an important role in dopamine and other neurotransmitter syntheses and, thus, its connection to transmitter-related pathologies is inevitable6. Quantitative susceptibility mapping (QSM)7 is related to local tissue iron and may be used as an in-vivo surrogate of iron content.Cerebellum is associated with sensorimotor and executive functions as well as cognition, thus constitutes an area of interest in movement-related and psychiatric pathologies8. While QSM of sufficient quality is not easily achieved in cerebellar cortex, voxel-based morphometry (VBM) has the potential to identify structural changes that might contribute to the underlying pathophysiology.
We used 7T QSM to investigate the iron content in the subcortex of GTS patients in correlation with established clinical assessments, specifically, the Yale Global Tic Severity Scale (YGTSS)10. In the light of recent studies indicating that cerebellar-basal ganglia-cortical networks and structure play a role in GTS8,9,11,12,13 we used 7T T1-weighted images for VBM analysis, to identify potential gray matter (GM) volume differences in the cerebellar subregions.
Methods
14 GTS patients (age: 30±9.4 years, 2 females, off-treatment at the time of scanning and for at least a month prior) were recruited and individually assessed with the YGTSS. 15 controls (ages: 32±4.4 years, 4 females) were also recruited. 7T MRI acquisitions included MP2RAGE structural scans at 1mm isotropic nominal resolution and 3D multi-echo, gradient-recalled echo (GRE) at 0.8mm (9 echoes, minimum TE 5ms, inter-echo time 4.1ms, TR 48ms) on a MAGNETOM Terra (Siemens Healthineers, Erlangen).For QSM processing, the Laplacian method was used for phase unwrapping (dataset acquired at TE=13.2ms). Background-field gradients caused from low-frequency field variations were removed using V-SHARP. The Q-star method (STI Suite, MATLAB) was employed for field-to-source inversion14,15. QSM maps were referenced to the mean value of a manually delineated ventricular region in each volume (MRIcron16) for inter-subject comparative analysis. The MP2RAGE and the GRE magnitude volumes were masked, corrected for bias-field and registered using ANTs. FreeSurfer 5.317 was used for segmentation of the basal ganglia regions, based on a hybrid T1w/QSM contrast. Brainstem nuclei were manually delineated using MRIcron.
T1 scans were assessed for quality assurance and the SUIT toolbox18 was used for segmentation of cerebellar structures and brainstem. The isolated GM maps were visually inspected for segmentation misclassifications and corrected if necessary. DARTEL was used for normalization and re-slicing to the SUIT template and underwent modulation to compensate for volume changes induced by the processing steps, and finally, a FWHM 2mm Gaussian filter was applied18,19. A simple t-test between the processed volumes was implemented in SPM12, without using covariates.
Results
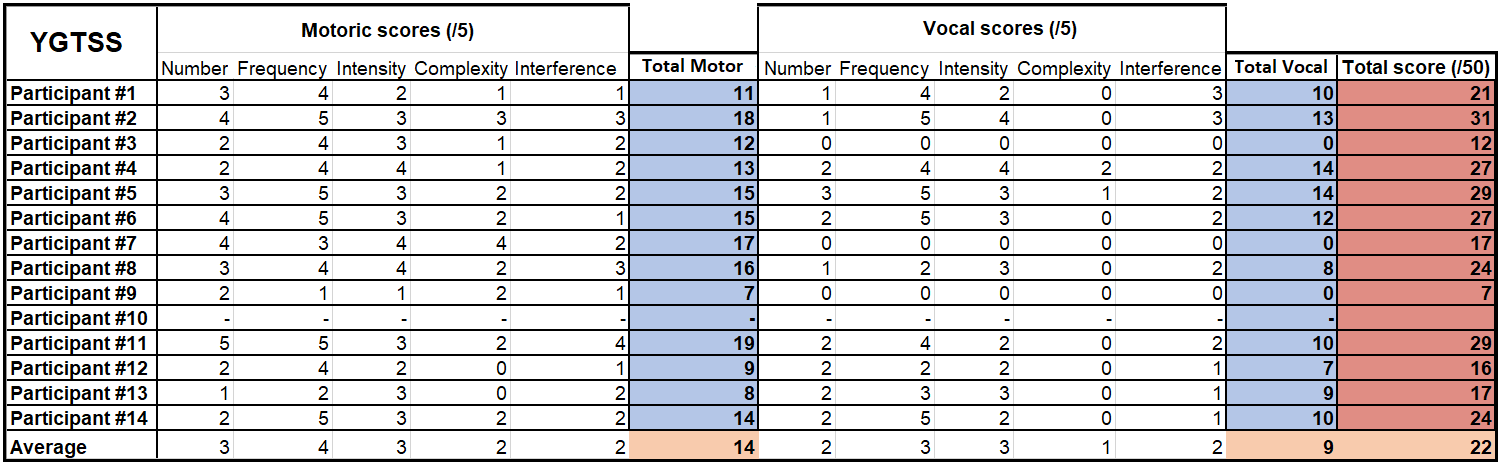
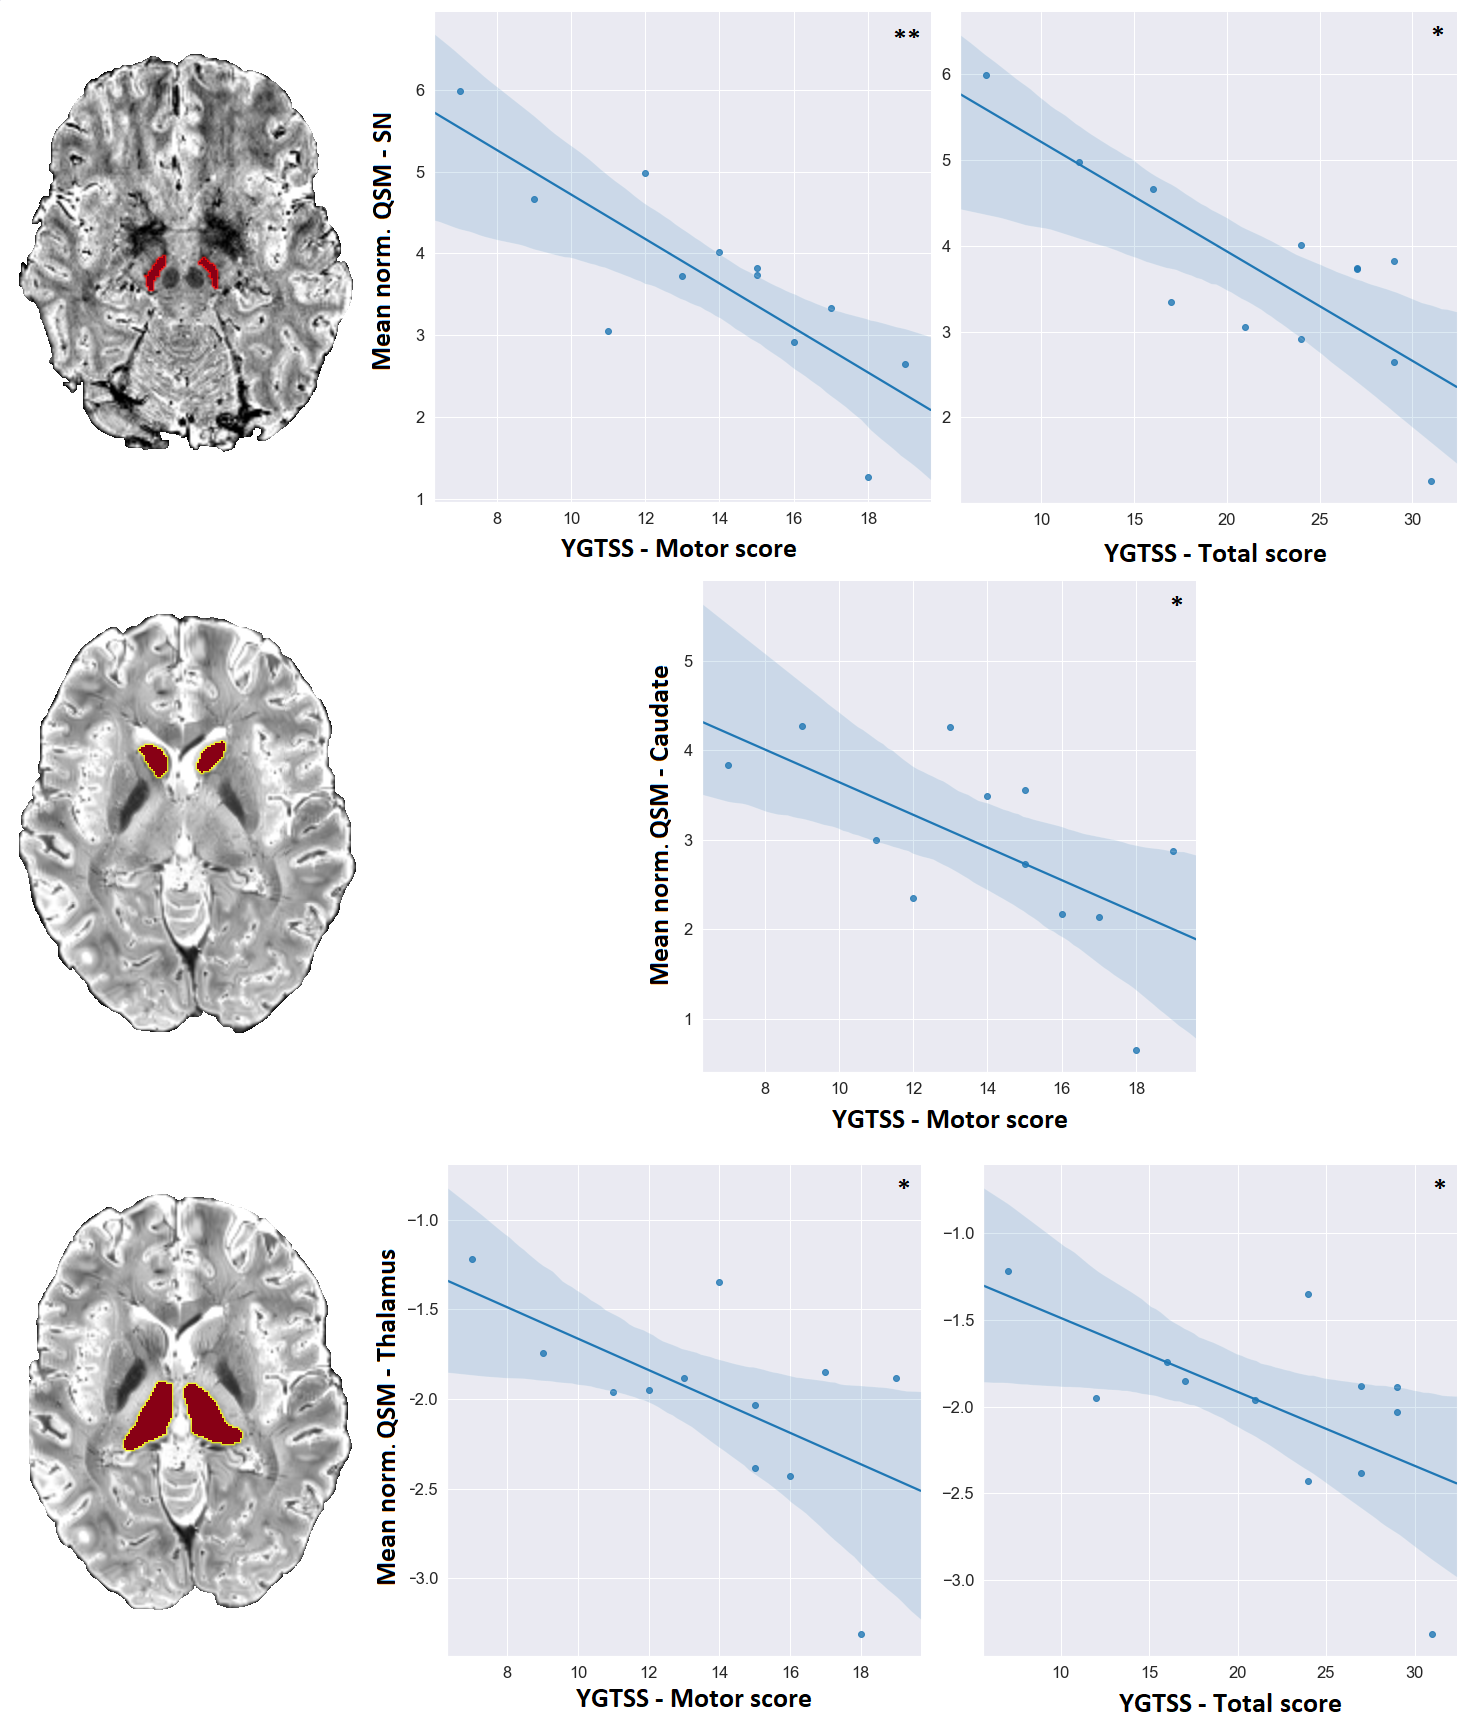
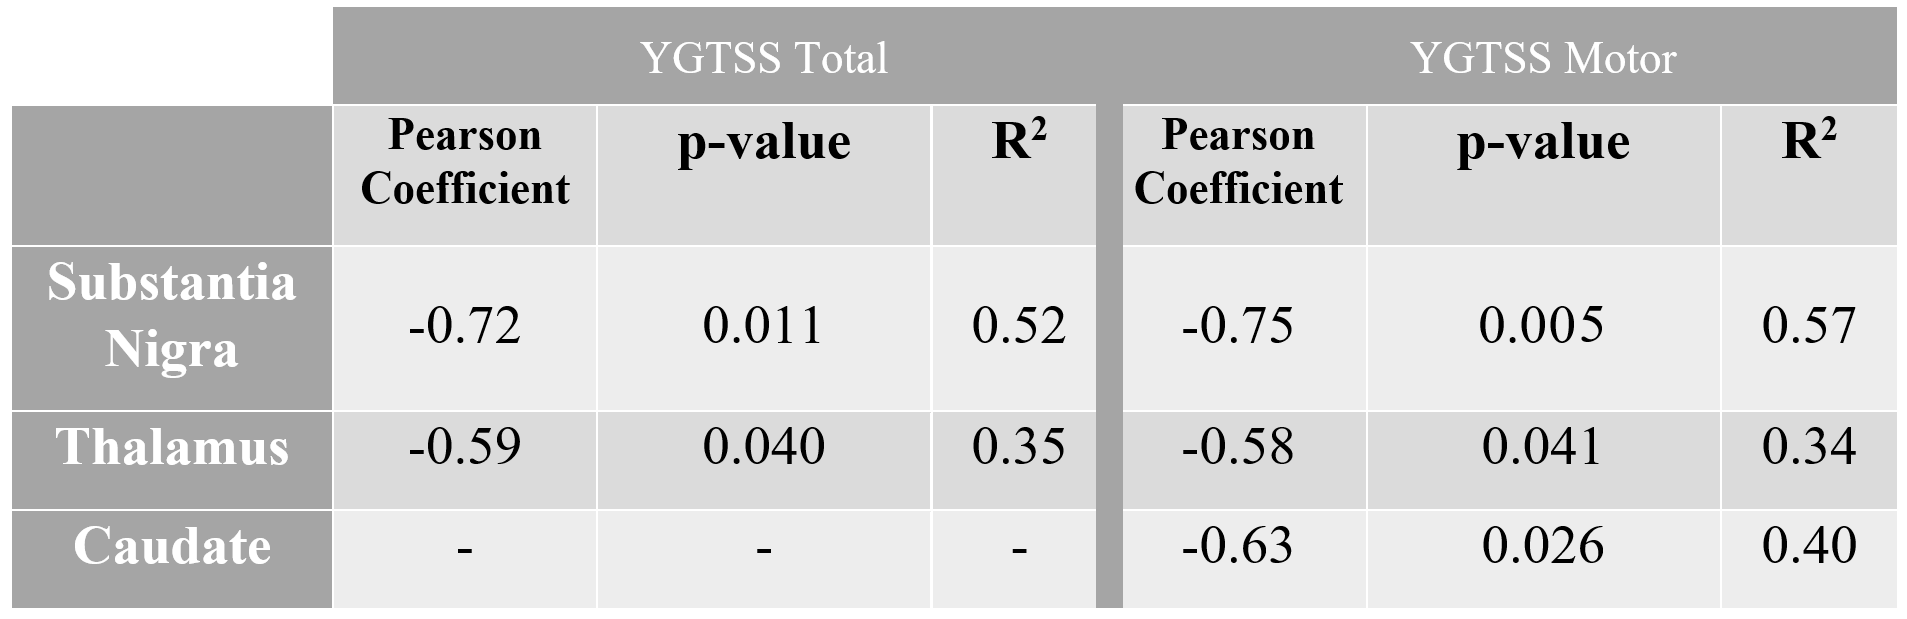
The YGTSS assessments scores are reported for all patients in Figure 1. It is worth to note that due to the nature of MRI examinations, recruitment was restricted to participants exhibiting only mild to moderate tics, which is also evident from the averages of each score.YGTSS scale and QSM values in SN and caudate and thalamus regions were negatively correlated, as seen in Figure 2. Analytical statistics are presented in Figure 3. In the remaining subcortical nuclei, p-values did not reach significance. The generally lower p-values obtained for correlations with the motor scores as compared to the total scores might reflect the particular involvement of these brain regions in movements as compared to vocalizations.
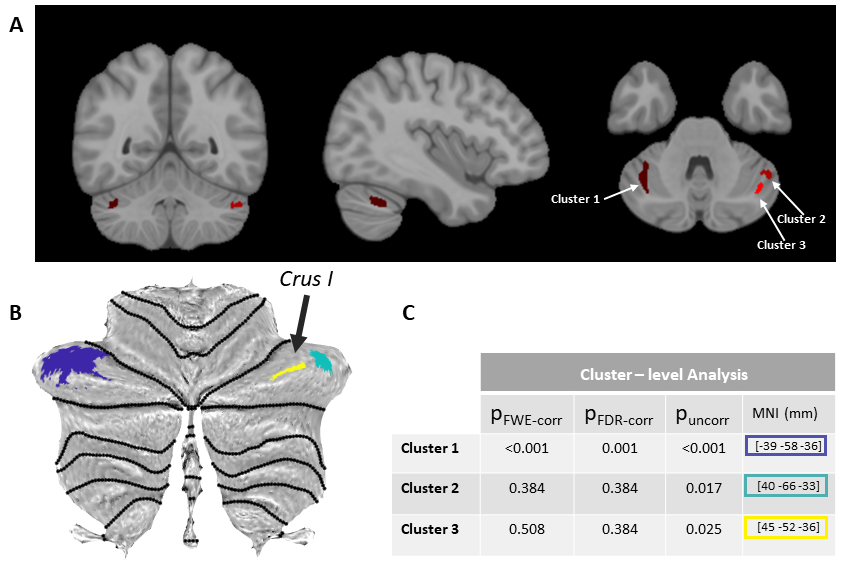
VBM results are shown in Figure 4. Two bilateral locations indicate increased GM volume. The specific locations of the VOIs are also indicated in the 3D rendering of the MNI brain (Coordinates: [–39,–58,–36],[40,–66,–33] and [45,–52,–36]) as well as the SUIT template and is identified as Crus I. For the cluster on the left Crus-I uncorrected and FDR-corrected p-values were <0.0001 and 0.001, respectively. The clusters on the right Crus-I (pUNCORR<0.02) did not survive FDR correction. No correlation was found between the YGTSS tic scores and cerebellar- grey matter volumes.
Discussion
SN is the primary input into the basal ganglia circuitry, a critical element of the dopaminergic system and motor function5. Our study indicates direct correlations of the clinical manifestation of GTS—as characterized by the most commonly accepted metric, YGTSS—with the QSM values in SN. This finding supports the hypothesis that iron imbalance plays a significant role in the dopamine dysregulations that lead to the motor and vocal tics in GTS. The correlations of the tic assessment YGTSS with thalamus and caudate local QSM values, shall initiate further research on the role of iron distribution to the circuitry.Our preliminary cerebellar-VBM results derived by 7T T1w MP2RAGE scans indicated statistically significant GM volume increase in the Crus-I region, known for its involvement in visual-motor integration, attention and cognition. These alterations constitute a GTS-relevant unprecedented finding and further analysis in a larger cohort is warranted for its full comprehension.
Acknowledgements
This work was funded by the EU through the ITN “INSPiRE-MED” (H2020-MSCA-ITN-2018, #813120).
Thanks to Caroline Fremer, Caroline Klages and Lisa Hartung from MHH for their help in the patients recruiting, to the MPI CBS radiographers Domenica Klank, Sylvie Neubert, Anke Kummer, Simone Wipper, Mandy Jochemko, Manuela Hofmann and Nicole Pampus for their help in acquisitions and preparations of participants and to Amira-Philine Büttner for her valuable help in acquisitions and data organization.
References
1.Jakubovski E, Müller-Vahl KR. [Gilles de la Tourette Syndrome: Symptoms, Causes and Therapy]. Psychotherapie, Psychosomatik, Medizinische Psychologie. 2017
2.Kanaan AS et al., Pathological glutamatergic neurotransmission in Gilles de la Tourette syndrome. Brain 2017; 140: 218-234.
3.Lixue L. et al., Effects of chemogenetic inhibition of d1 or d2 receptor-containing neurons of the substantia nigra and striatum in mice with Tourette syndrome. Front. Mol. Neurosci. 2021; 14: 779436.
4.Hamamoto Y, Kano Y. [Tourette Syndrome]. Brain Nerve 2018; 70: 1237-1245.
5.Groenewegen H.J. et al., Does an imbalance between the dorsal and ventral striato-pallidal systems play a role in Tourette's syndrome? A neuronal circuit approach, Brain Dev. 2003; 25(Suppl. 1): S3-S14.
6.Möller HE, Bossoni L, Connor JR, et al. Iron, myelin, and the brain: Neuroimaging meets neurobiology. Trends Neurosci. 2019; 42: 384-401.
7. Deistung A, Schweser F, Reichenbach JR. Overview of quantitative susceptibility mapping. NMR Biomed. 2017; 30: e3569.
8.Sigurdsson H.P. et al., Alterations in cerebellar grey matter structure and covariance networks in young people with Tourette syndrome, Cortex 2020; 126: 1-15.
9.Greene D.J. et al., Brain structure in pediatric Tourette syndrome, Mol. Psychiatry 2017; 22: 972-980.
10.Leckman J.F. et al., The Yale Global Tic Severity Scale: initial testing of a clinician-rated scale of tic severity. J Am Acad Child Adolesc Psychiatry 1989 28: 566-573.
11.Tikoo S. et al., The Cerebellum in Drug-naive Children with Tourette Syndrome and Obsessive-Compulsive Disorder. Cerebellum, 2022; 21(6):867-878Xin X. et al., Multivariate Classification of Brain
12.Blood-Oxygen Signal Complexity for the Diagnosis of Children with Tourette Syndrome. Mol Neurobiol. 2022;59(2):1249-1261
13.Ganos C. et al., A neural network for tics: insights from causal brain lesions and deep brain stimulation. Brain. 2022
14.Li, Wei et al. “5223 STI Suite: a Software Package for Quantitative Susceptibility Imaging.” (2013).
15.Özbay PS, Deistung A, Feng X, et al. A comprehensive numerical analysis of background phase correction with V-SHARP. NMR Biomed. 2017; 30: e3550.
16.Rorden C, Brett M. Stereotaxic display of brain lesions. Behav Neurol. 2000;
17.Freesurfer 5.3, https://surfer.nmr.mgh.harvard.edu/, Laboratory for Computational Neuroimaging, Athinoula A. Martinos Center for Biomedical Imaging
18.Diedrichsen J. et al., Imaging the deep cerebellar nuclei: A probabilistic atlas and normalization procedure. NeuroImage 2011; 54: 1786-1794.
19.Diedrichsen J. and Zotow E., Surface-based display of volume-averaged cerebellar data. PLoS One, 2015; 10: e0133402.
Figures