5038
Synthetic data driven learning for full-automatic hemoperfusion parameter estimation1Department of Electronic Science, Xiamen University, Xiamen, China, 2Department of Radiology, First Affiliated Hospital of Fujian Medical University, Fuzhou, China, 3MSC Clinical & Technical Solutions, Philips Healthcare, Shenzhen, China
Synopsis
Keywords: Machine Learning/Artificial Intelligence, Brain, Hemoperfusion parameter estimation
Hemoperfusion magnetic resonance (MR) imaging derived parameters characterize both endothelial hyperplasia and neovascularization that are associated with tumor aggressiveness and growth. However, the hemoperfusion parameter estimation is still limited by low reliability, high bias, long processing time, and operator experience dependency up to now. In this study, a synthetic data driven learning method for hemoperfusion parameter estimation is proposed. Image analysis shows that the proposed method improves the reliability and precision of hemodynamic parameter estimation in a full-automatic and high-efficient way.Introduction
Hemoperfusion magnetic resonance (MR) imaging techniques help quantify brain tumor microvessel proliferation and permeability, which is associated with tumor malignancy.1 Dynamic susceptibility contrast magnetic resonance imaging (DSC-MRI) and dynamic contrast enhanced magnetic resonance imaging (DCE-MRI) are two main hemoperfusion MR imaging techniques. Previous classical hemoperfusion parameter estimation methods suffer from limitations including large variance and bias in parameter predictions, long processing and computation time, and vulnerability to arterial input function (AIF) extraction operator experience.2 Recent machine learning methods still depend on the large amount of real hemoperfusion MRI data and external algorithms for automatic AIF selection.3 Here we proposed a synthetic data driven learning method for full-automatic hemoperfusion parameter estimation that aims at addressing the currently existing hardships.Methods
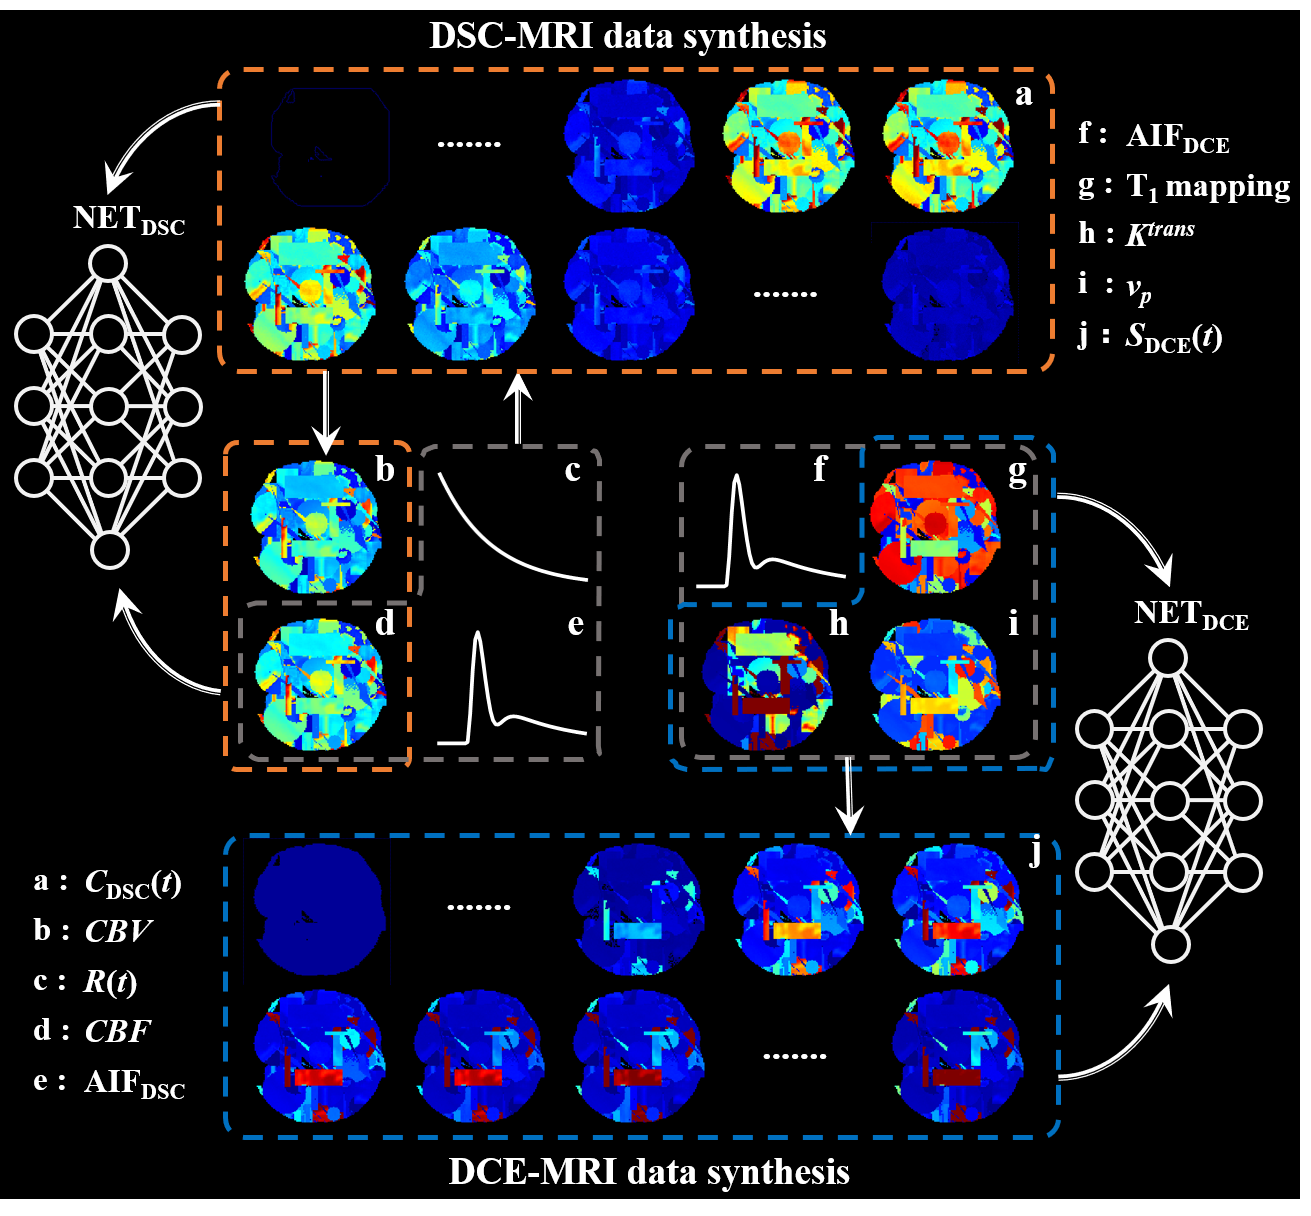
MR imaging: DSC- and DCE-MRI data of the human brain were acquired on a 3T SIEMENS Skyra scanner with a 16-channel head-neck coil. Detailed imaging acquisition protocol was as follows: (1) DSC-MRI: Single-shot gradient-echo EPI sequence, 220 × 220 mm2 field of view, 5 mm slice sickness, 6 mm spacing between slices, TE/TR = 30/1600 ms, echo train length = 63, voxel size = 1.7 × 1.7 × 5.0 mm3. A total of 1,200 images were obtained in 96 seconds (20 sections, 60 phases). (2) DCE-MRI: 3D gradient-echo sequence, 220 × 220 mm2 field of view, 5 mm slice sickness, 6 mm spacing between slices, TE/TR = 1.79/5.08 ms, voxel size = 0.7 × 0.7 × 5.0 mm3, 35 phases with temporal resolution = 5.9 s. Before the DCE-MRI, T1 mapping images were acquired using the same pulse sequence and parameters except for varied flip angles = 2° and 15°.Proposed scheme: Figure 1 illustrates the workflow of synthetic data generation for DSC- and DCE-MRI parameter estimation. The hemoperfusion parametric maps (CBV, CBF, Ktrans and vp) were first generated according to reasonable value distributions, then the time series of DSC- or DCE-MRI images were simulated according to the specific kinetic model of hemoperfusion. This enables the training data well-labeled and easily obtained, and facilitates the learning of nonlinear mapping between parametric maps and DSC/DCE image series for the deep neural network. It is worth noticing that AIFs for hemodynamic parameter estimation were automatically generated during data synthesizing, which facilitates the proposed method full-automatic.
Image analysis: Both DSC- and DCE-MRI have been proven reliable techniques in differentiating low-grade gliomas (LGGs) from high-grade gliomas (HGGs).4 To analyze the clinical diagnosis value of the proposed method, 29 patients with pathologically confirmed LGG or HGG were included in this study. DSC-MRI and DCE-MRI parameter estimations were also performed using the nordicICE software as reference (Nordic). Region of interest for glioma grading ability analysis was determined as the exact tumor parenchyma based on the contrast-enhanced T1-weighted image, T2-weighted and T2-FLAIR images to avoid tumor necrosis, cystic areas and macro vessels. Receiver operating characteristic (ROC) analysis was employed to evaluate the diagnostic value. Theoretically, DSC-MRI derived CBV and DCE-MRI derived vp provide similar physiological information.5 We assumed that there is a potential similarity between CBV and vp, and calculated the structure similarity (SSIM) between them to confirm the estimation precision of the proposed method and Nordic. We deemed that the higher the SSIM is, the more precise the calculated parametric maps are.
Results
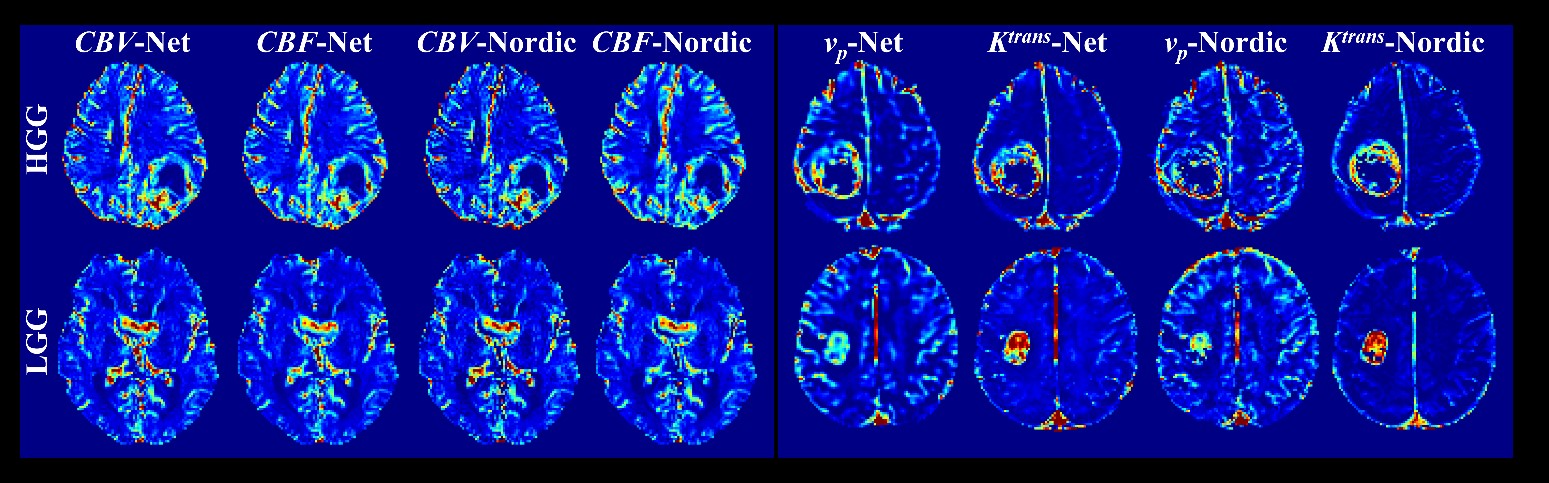
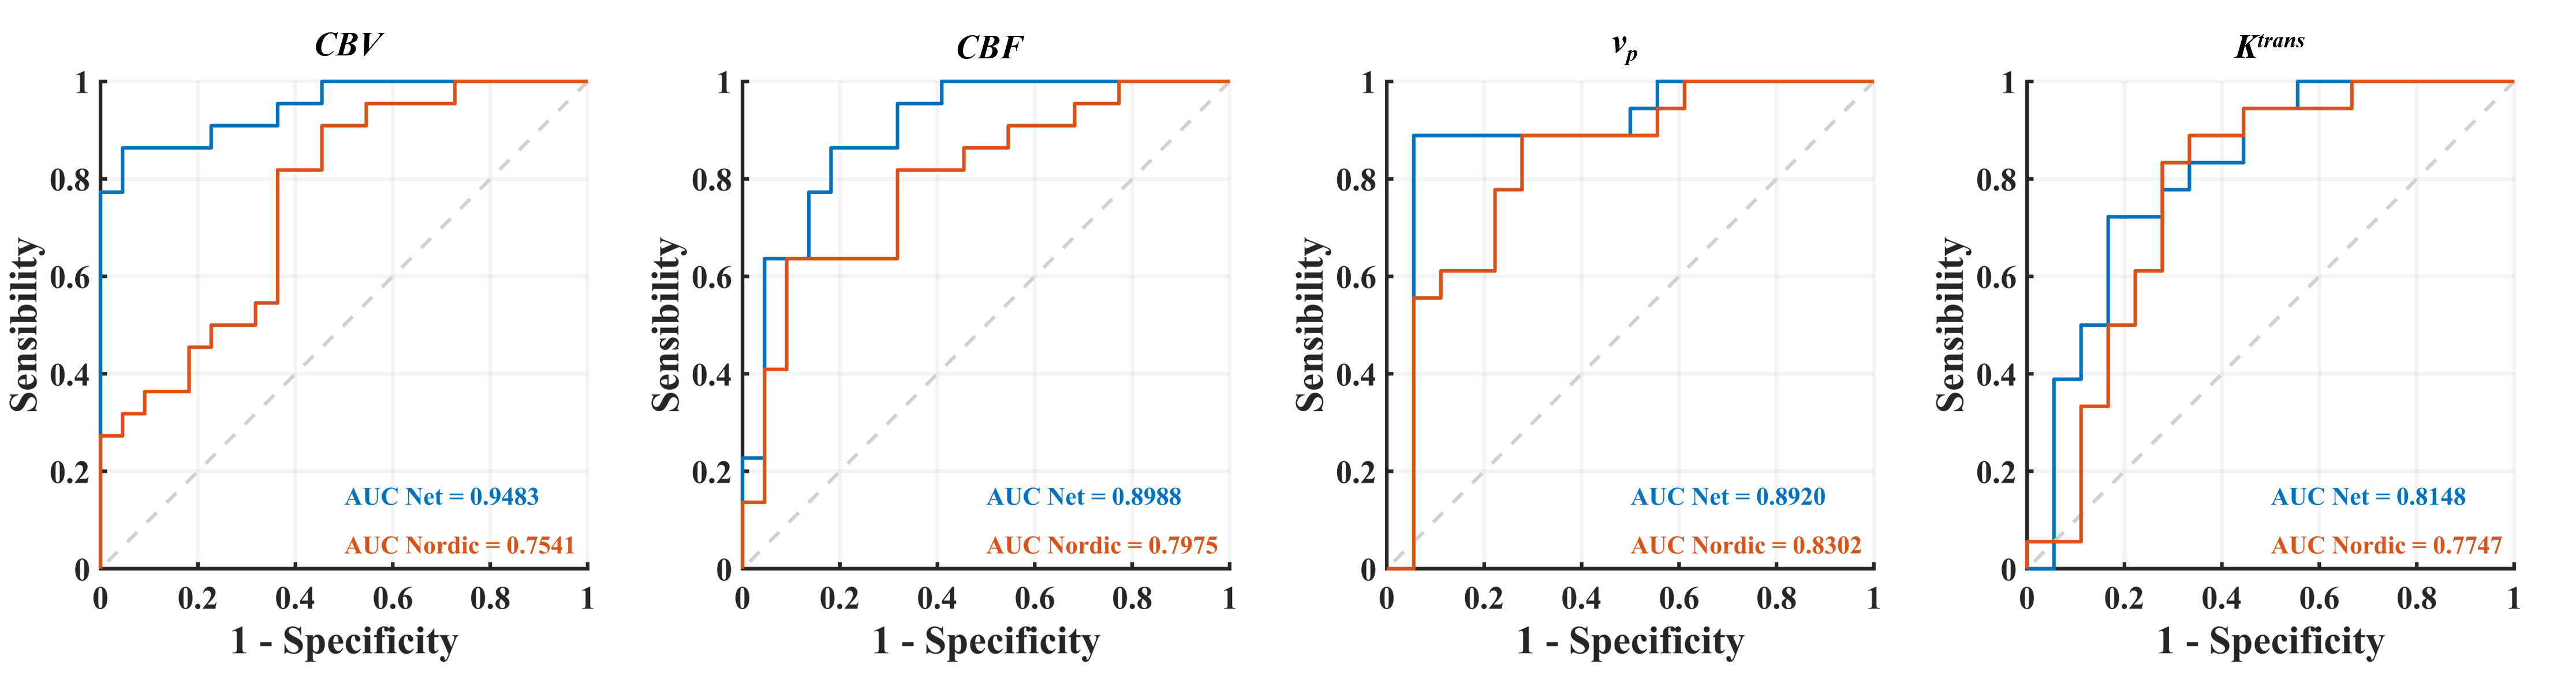
Figure 2 depicts the hemoperfusion parametric maps (CBV, CBF, Ktrans and vp) estimated from the proposed method and Nordic. All the hemoperfusion parametric maps estimated from the two methods are of high consistency in both LGG and HGG patients. Nonetheless, our proposed method improves the visual quality of all parametric maps with reduced noise and higher spatial coherency.Figure 3 shows the ROC curves of hemodynamic parameters for differentiating HGG and LGG. The AUC values of CBV, CBF, vp and Ktrans estimated from the proposed method are 0.9483, 0.8988, 0.8920 and 0.8148, respectively, showing high diagnostic value. While for Nordic, the corresponding values are 0.7541, 0.7975, 0.8302 and 0.7747, which is apparently lower than the proposed method.
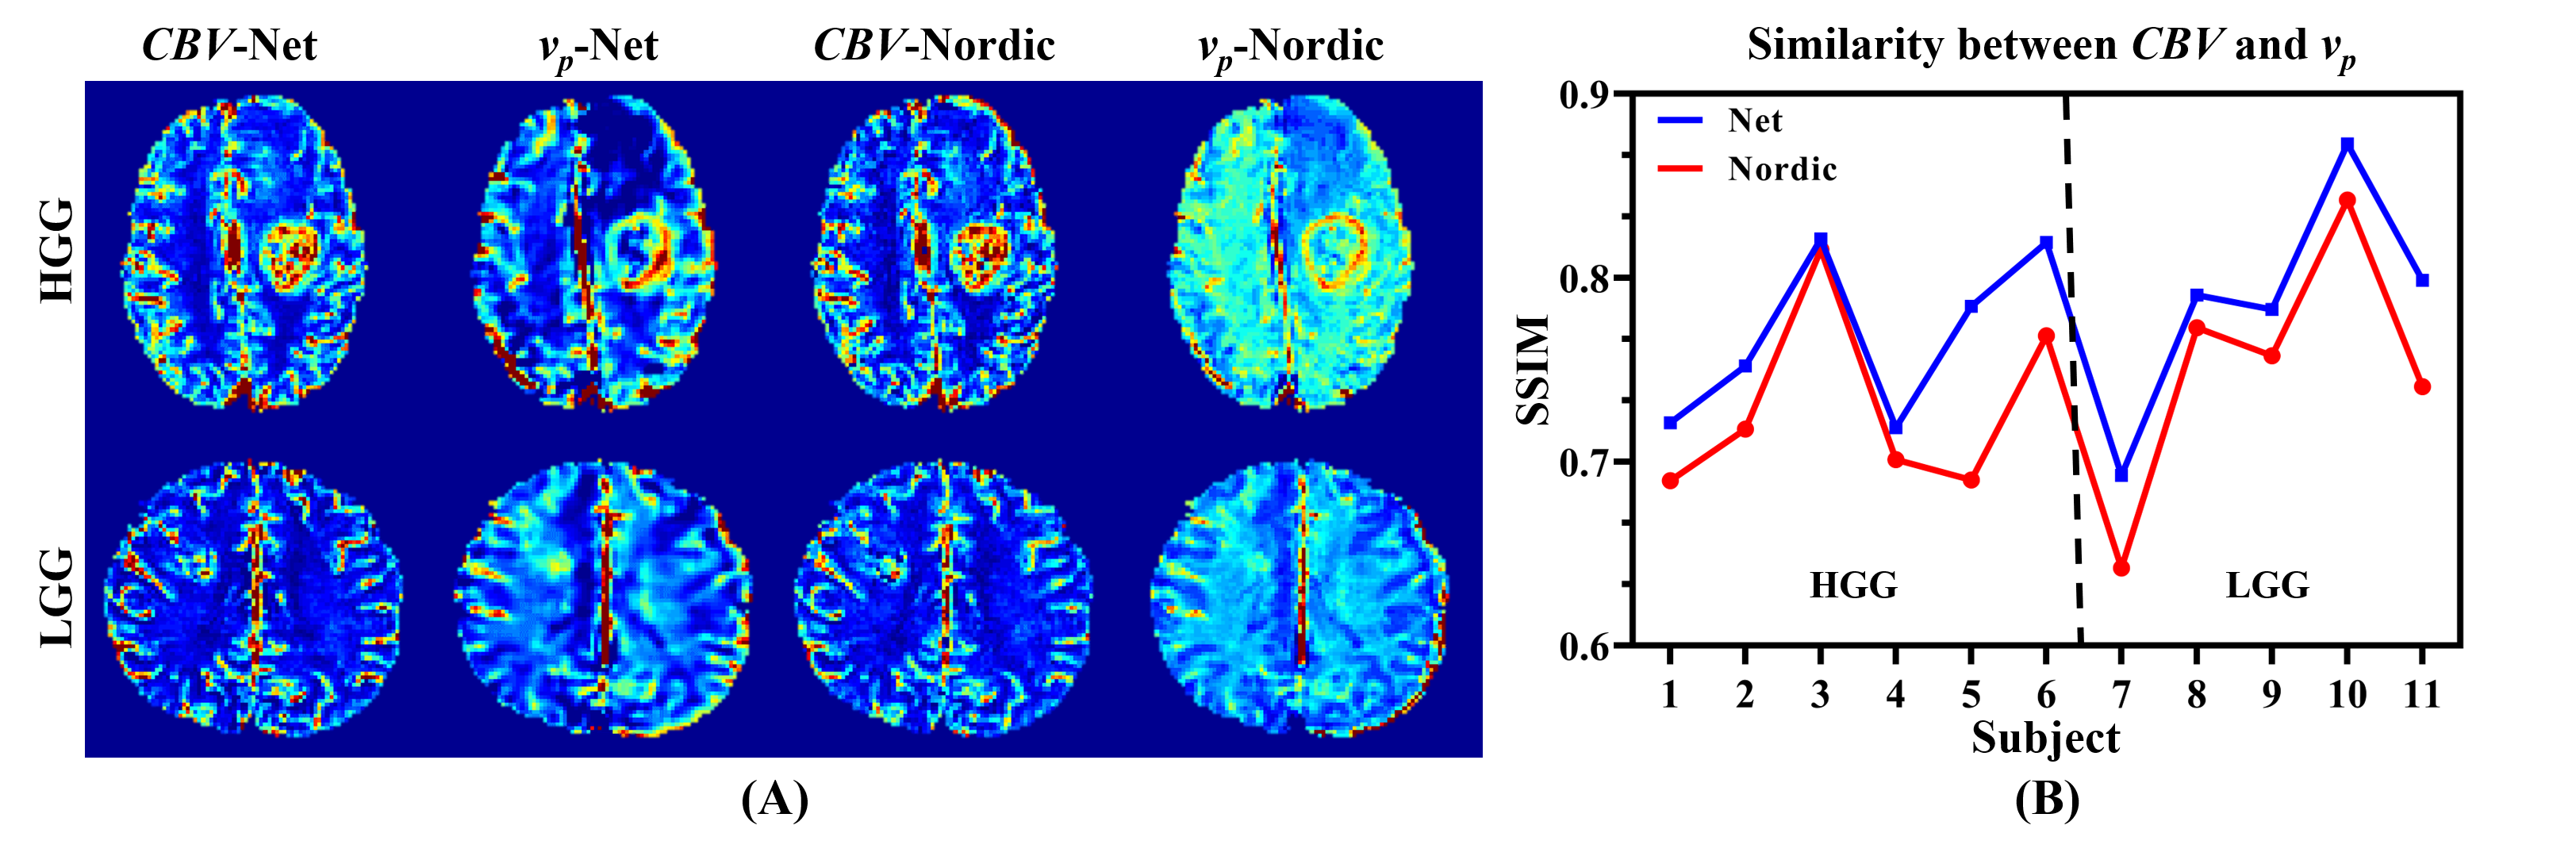
Figure 4 illustrates CBV and vp maps of 6 HGG patients and 5 LGG patients estimated from the proposed method and Nordic, together with the corresponding SSIM. For the proposed method, the estimated vp map is visually more similar to the CBV map than Nordic for both LGG and HGG patients. Moreover, the proposed method achieves higher SSIM between the DSC-MRI derived CBV and DCE-MRI derived vp for all 11 subjects compared to Nordic, implying higher hemodynamic parameter estimation precision.
Discussion and conclusion
In the present study, we put forward a full-automatic method for DSC- and DCE-MRI parameter estimation with synthetic data. Apart from the better parametric map quality, the performance in glioma grading of the proposed method shows a noticeable margin over the widely acknowledged software Nordic with obviously higher AUC of ROC curves. The higher SSIM between the proposed method estimated CBV and vp compared to Nordic further confirms a more precise estimation. Moreover, the proposed method reduces the estimation time from several minutes to tens of milliseconds. In summary, the proposed method improves the reliability and precision of hemodynamic parameter estimation in a full-automatic and high-efficient way.Acknowledgements
This work was supported by the National Natural Science Foundation of China under grant numbers 11775184, 82071913, and 22161142024.References
1. Anzalone N, Castellano A, Cadioli M, et al. Brain gliomas: multicenter standardized assessment of dynamic contrast-enhanced and dynamic susceptibility contrast MR images. Radiology 2018;287(3):933-943.
2. Ottens T, Barbieri S, Orton MR, et al. Deep learning DCE-MRI parameter estimation: Application in pancreatic cancer. Med Image Anal 2022;80:102512.
3. McKinley R, Hung F, Wiest R, Liebeskind DS, Scalzo F. A machine learning approach to perfusion imaging with dynamic susceptibility contrast MR. Front Neurol 2018;9:717.
4. Liang J, Liu D, Gao P, et al. Diagnostic values of DCE-MRI and DSC-MRI for differentiation between high-grade and low-grade gliomas: A comprehensive meta-analysis. Acad Radiol 2018;25(3):338-348.
5. Ludemann L, Grieger W, Wurm R, Wust P, Zimmer C. Glioma assessment using quantitative blood volume maps generated by T1-weighted dynamic contrast-enhanced magnetic resonance imaging: A receiver operating characteristic study. Acta Radiologica 2006;47(3):303-310.
Figures