5031
Resilience of synthetic CT DL network to varying ZTE-MRI input SNR1GE Healthcare, Munich, Germany, 2Department of Quantitative Biomedicine, University of Zurich, Zurich, Switzerland, 3Umeå University, Umeå, Sweden, 4Erasmus MC Cancer Institute, Rotterdam, Netherlands
Synopsis
Keywords: Machine Learning/Artificial Intelligence, Radiotherapy, MR-only RT, Synthetic CT, Multi-task CNN, PET/MR
Many recent works have proposed methods to convert MRI into synthetic CT (sCT). While they have demonstrated a certain level of accuracy, not many have studied the robustness of those methods. In this work, we study the robustness of a multi-task deep learning (DL) model that computes sCT images from fast ZTE MR images under different levels of image noise. We evaluate its impact on radiation therapy planning. The proposed method demonstrates resilience against input noise variations. It makes way for a clinically acceptable dose calculation with a fast input image acquisition.Introduction
Generation of synthetic CT (sCT [HU]) from MR images is of interest for applications such as MR-only radiation therapy (RT) planning, PET/MR attenuation-correction (AC), and MR bone imaging. Many methods are recently proposed for this purpose [1,2] and some are available for clinical use [3,4]. While the proposed methods are demonstrated to generate sCT with a certain level of accuracy, not many works have focused on assessing the robustness of the proposed method. In this work, we study the robustness of a multi-task deep learning (DL) model that computes sCT images using fast ZTE MR images under different levels of image noise and evaluate its impact on MR-only RT planning.Methods and Materials
Patient data: MR scans were performed using 3T, 1.5T, and time-of-flight (TOF) Signa PET/MR scanners (all GE Healthcare, Chicago, IL, USA) using a fast in-phase ZTE protocol (resolution=1.5mm3; BW=±62.5kHz; scan time=1min37s). The 3D radial ZTE images were reconstructed to twice the nominal FOV of 60cm3 (which was enabled by 2x radial oversampling). For each patient also a corresponding CT was available. The IRB approved studies from multiple clinical sites included 77 brain and head-neck patients in total. ZTE image noise variation: Images acquired with the protocol mentioned above and reconstructed on the scanner are of low-to-intermediate SNR especially in regions of weak receive coil coverage. The images were denoised by 0%, 75% and 100% using a DL-based image reconstruction method as described in [5]. Fig.1 illustrates the ZTE images at 0% (top, left), 75% (top, middle), and 100% (top, right) denoising together with corresponding CT (bottom row). Table-1 describes the composition of the training, validation, and test cohorts from different SNR levels. SNR Computation: The SNR values of the input ZTE images were calculated using the statistics in two separate regions of a single image as described in [6]. ZTE Pre-processing: Intensity correction was performed on ZTE images using ITK N4 algorithm. CT to ZTE-MR registration: CT images were registered to ZTE using a combination of rigid and diffeomorphic dense registration algorithms developed in ITK [7].Deep learning based sCT computation: A 2D supervised multi-task CNN in a UNet like architecture was developed to compute sCT from ZTE MRI [8]. The available image volumes were divided approximately 75:25 for training and validation and the remaining 5 cases were set apart for testing the performance. Training and validation cohorts were formed by augmenting images from different SNRs amounting to a total of 25736 slices from a total of 164 image volumes and each epoch was validated on 7955 slices from 53 cases. Predicted slices were reconstituted to form the whole sCT volume. sCT evaluation: We computed mean absolute error (MAE) in different regions between sCT and real CT as a measure of HU value prediction accuracy. Dice similarity coefficient between CT bone region and DL predicted bone region was used as a metric for bone classification accuracy. Clinical evaluation: Clinical performance was retrospectively evaluated on 5 cancer patients with Head/Neck tumors treated at one of the sites. Their clinically used treatment plans were recalculated on both CT and sCT image data, using the treatment planning software OnCentra (Oncentra, Elekta, Stockholm, Sweden). Dose differences between CT and sCT relative to the prescribed dose were calculated for their planned target volumes (PTVs) (Table 2). The relative dose differences were found to be well within acceptable criteria for clinical usage mentioned in [9,10].
Result & Discussion
Visual comparison of the generated sCT images with the corresponding real CT shows the consistent characteristics of the sCT images maintained with varying noise levels in the input ZTE images (Fig.1). The qualitative comparison of variations in the predicted sCT HU values as compared with CT in the soft-tissue and the bone regions are shown in Fig.2(a) and Fig.2(b) respectively. The quantitative metrics in Table-2 show the extent to which estimated HU values vary and bone classification difference with changing input SNR levels. The last column shows the corresponding impact on relative average dose difference in RT planning.Conclusion
We have presented a study of sCT generating DL model performance with varying input ZTE SNR levels. The proposed method, trained only with higher SNR images, demonstrates a level of resilience against noise variations which suggests that it can be used even in absence of an additional DL denoising, thus making possible a clinically acceptable dose calculation with a fast input image acquisition. Further studies are planned to similarly compare the effect of pushing for even faster acquisition.Acknowledgements
This research is part of the Deep MR-only Radiation Therapy activity that has received funding from EITHealth. EIT Health is supported by the European Institute of Innovation and Technology (EIT), a body of the European Union receives support from the European Union’s Horizon 2020 Research and innovation program.References
[1]. MF Spadea, et al, Medical Physics 2021; Vol.48 Issue.11, Pages 6537-6566[2]. Y Li, et al, BioMed Research International, Vol. 2020, Article ID 5193707, 9 pages, 2020
[3]. E Palmer, et al, Physics and Imaging in Radiation Oncology, Volume 17, 2021, Pages 36-42
[4]. M Lerner, et al, Radiation Oncology volume 16, Article number: 66, 2021
[5]. RM Lebel, arXiv:2008.06559v1
[6]. SB Reeder, Parallel Imaging in Clinical MR Applications, pp 49–61, DOI: 10.1007/978-3-540-68879-2_4
[7]. B.B Avants, et al, Penn Image Computing and Science Laboratory, 2009
[8]. S Kaushik, et al, arXiv:2203.16288v2
[9]. JB Smilowitz, et al, AAPM Medical, J Appl Clin Med Phys. 2015;16:14-34
[10]. ME Korsholm et al. Radiation Oncology 2014, 9:16
Figures
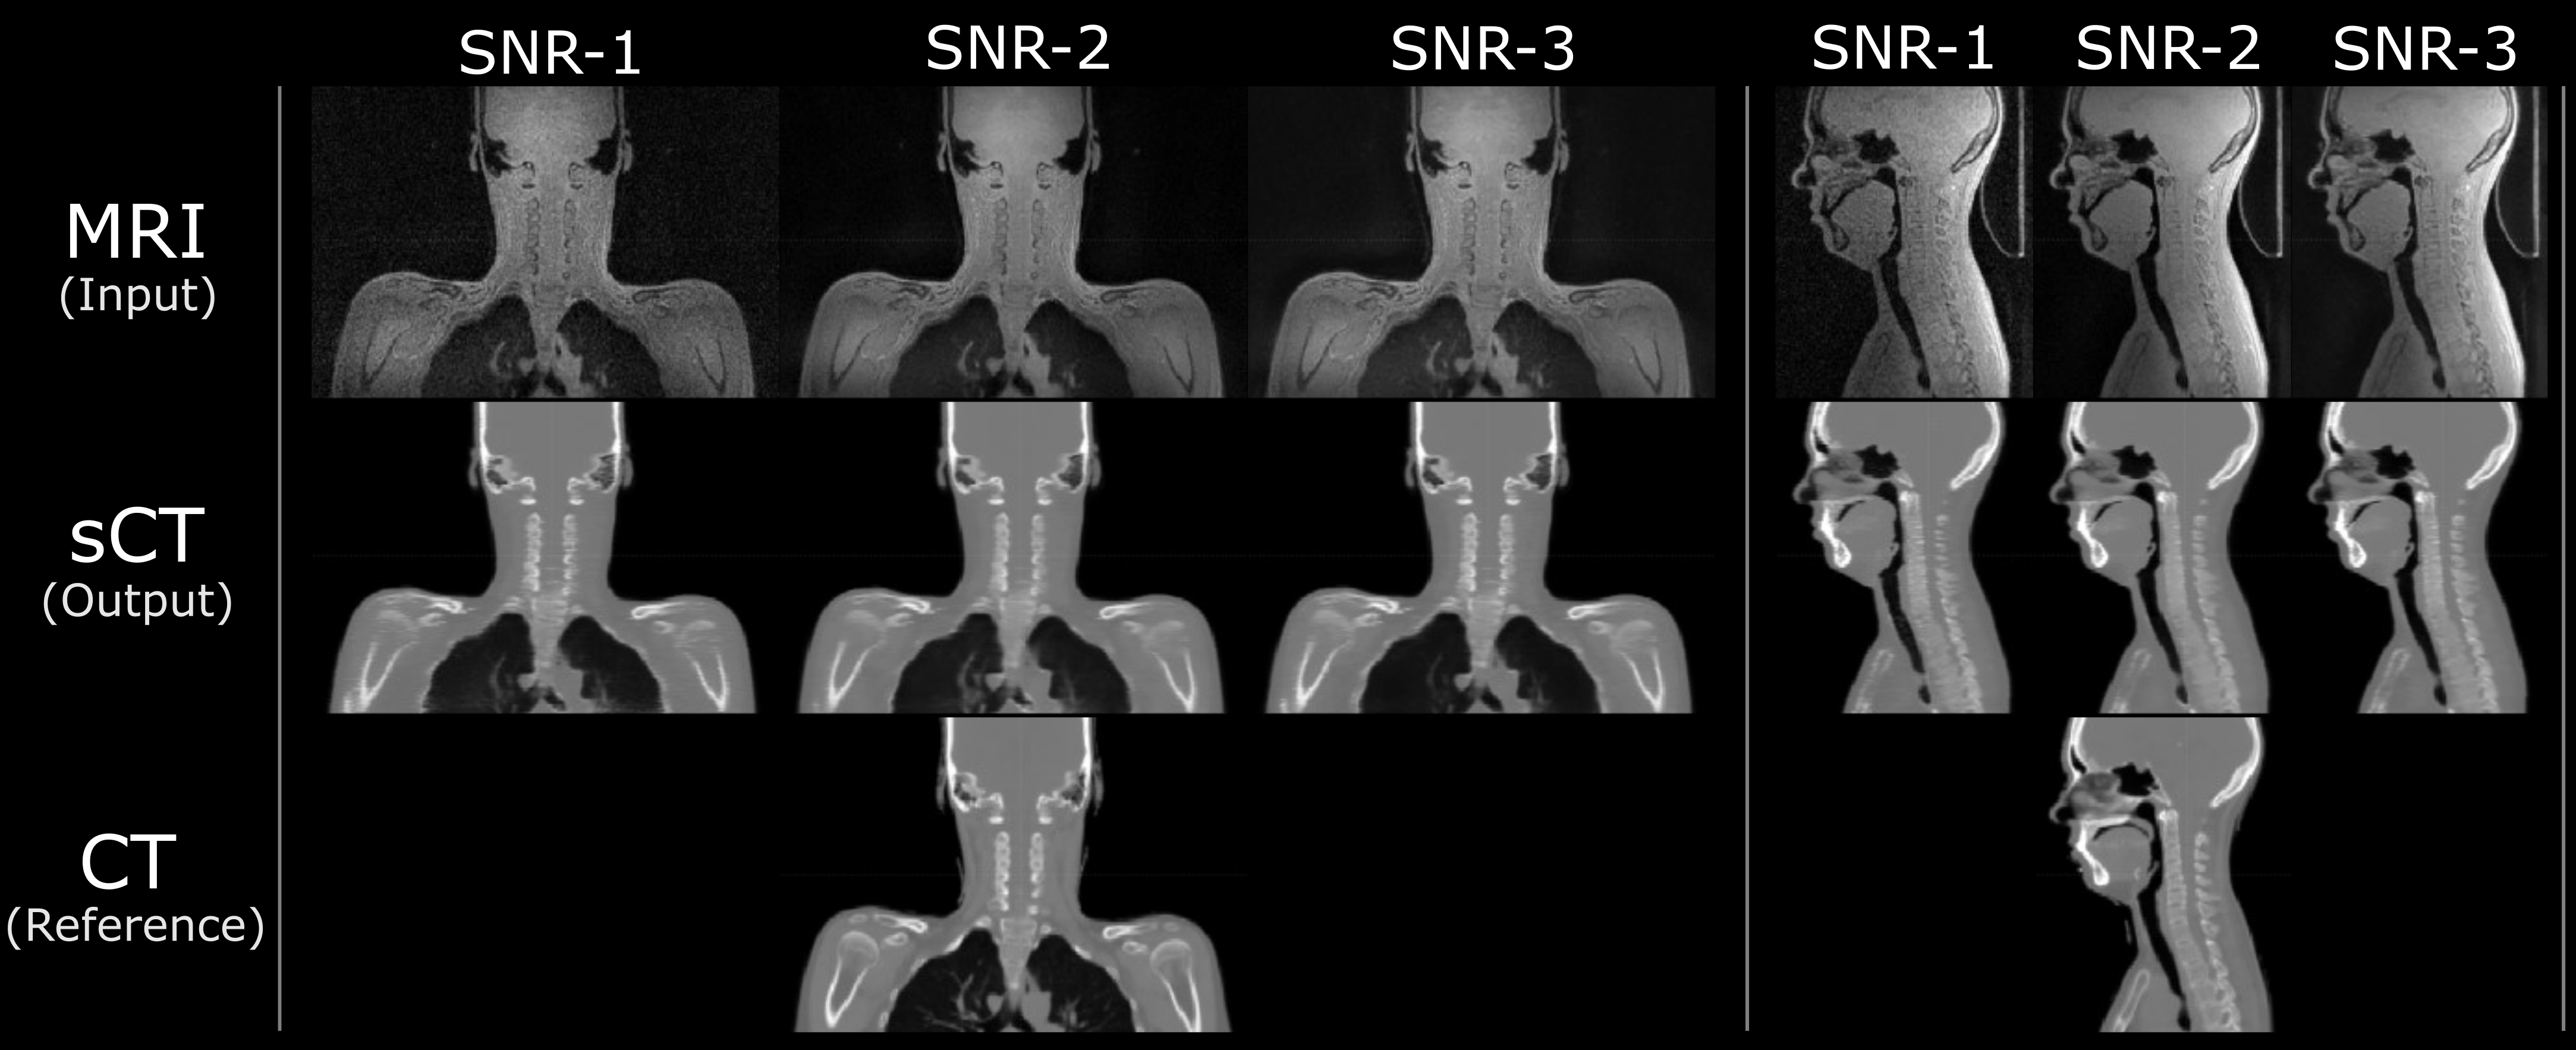
Fig.1: The sCT images generated from different ZTE input noise levels all maintain structural match to the input ZTE, and bears realistic appearance of the true CT.
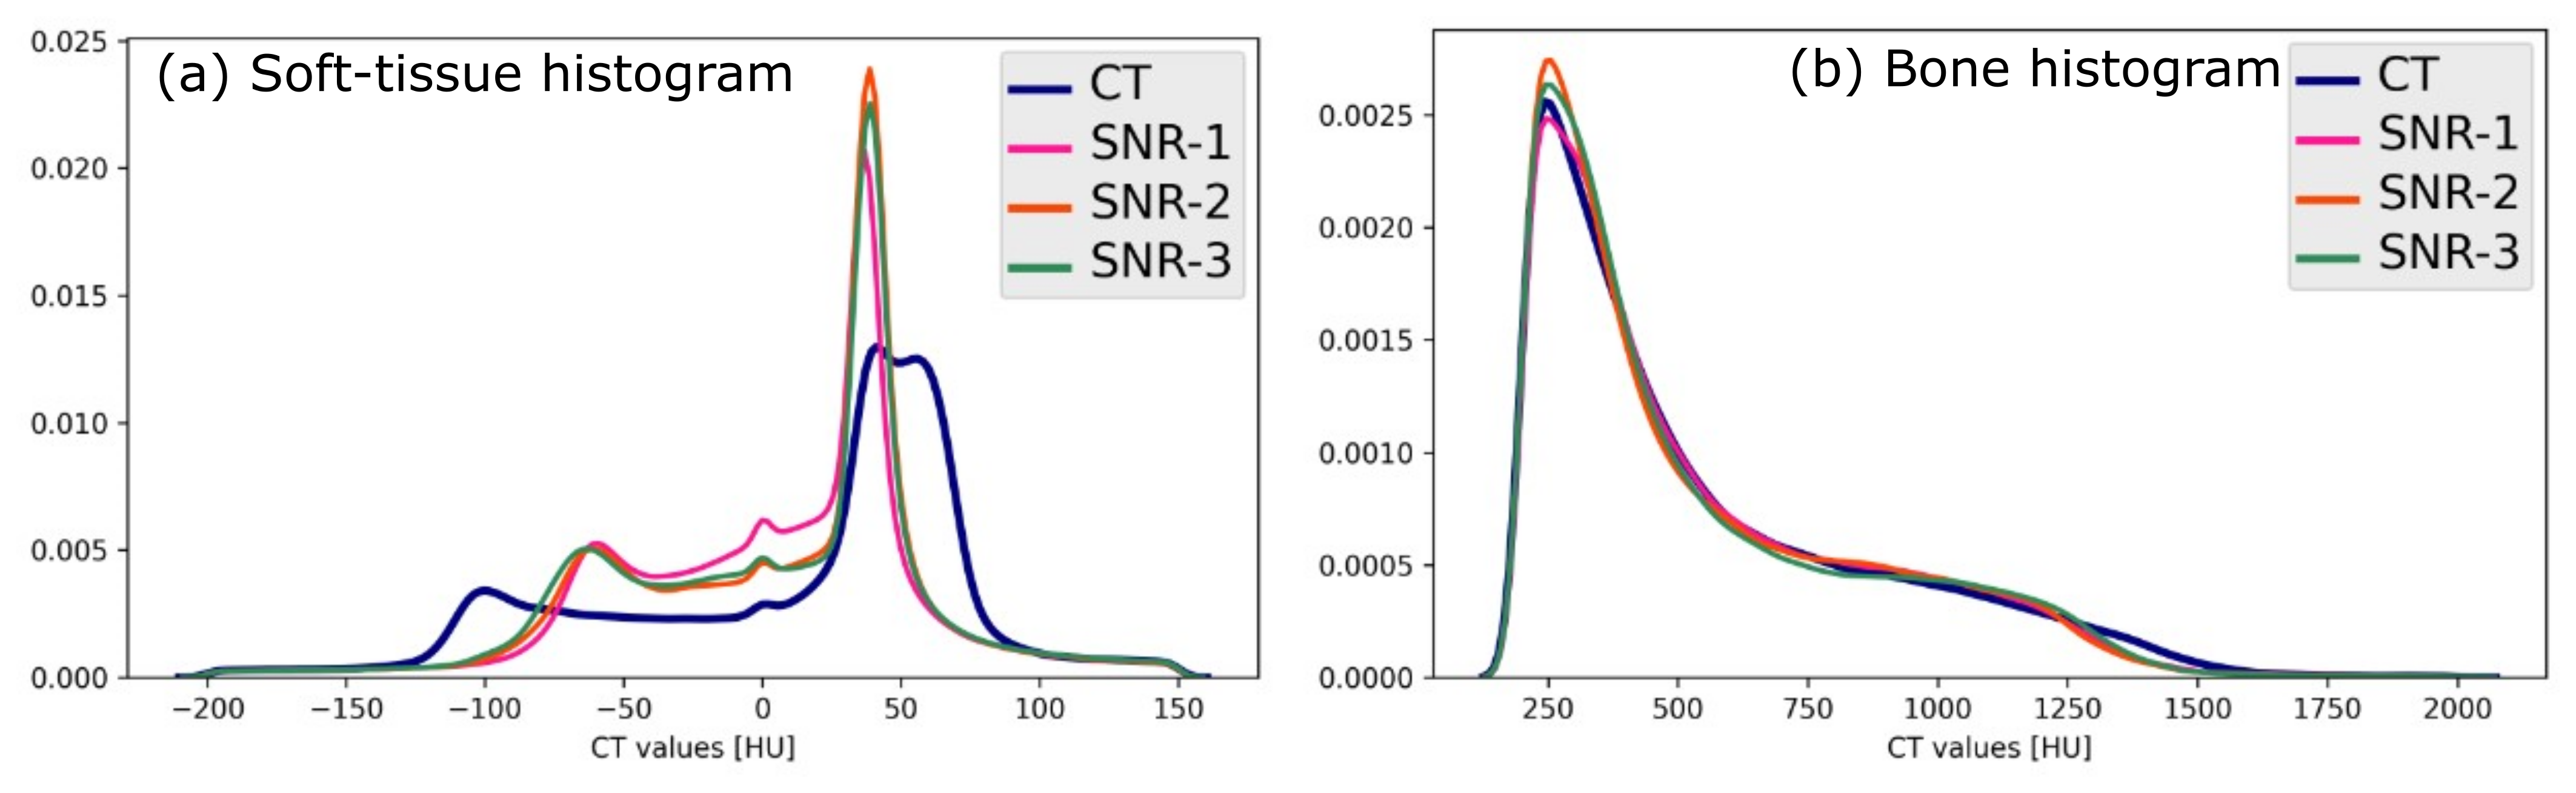
Fig.2: (a) sCT value histogram in comparison with CT in the soft-tissue region and (b) in the bone region shows a consistent prediction from varying input image characteristics. The shape of the soft-tissue histogram also depicts the differentiation of fat-tissue and water-tissue peaks in the sCT although the input image is a PDw image.

Table-1: Composition of the train, validation, and test cohorts from different input SNR(dB) levels. Each column indicates the SNR value and the number of contributing images are mentioned in the brackets.

Table-2: Quantitative evaluation of the sCT output for different ZTE input SNR. MAEx: Mean absolute error in different regions of the sCT; Dice: Classification accuracy measured by Dice similarity coefficient between sCT and CT bones; RDD: Relative average dose difference in the trarget volume between sCT and CT based planning.