5030
Synthetising myelin water fraction from T1-weighted and T2-weighted data: an image-to-image translation approach1Cardiff University Brain Research Imaging Centre, Cardiff University, Cardiff, United Kingdom
Synopsis
Keywords: Machine Learning/Artificial Intelligence, Brain
Myelin biomarkers are a fundamental tool for both neuroscience research and clinical applications. Despite several quantitative MRI methods available for their estimation, in several cases qualitative approaches are the only viable solution. To get the best of both the quantitative and qualitative worlds, here we propose an image-to-image translation method to learn the mapping between common routine scans and a quantitative myelin metric. To achieve this goal, we trained a generative adversarial network on a relatively large dataset of healthy subjects. Both the qualitative and quantitative results show good agreement between the predicted and the ground-truth maps.Purpose
Myelin plays a central role in the central and peripheral nervous system1, and providing a non-invasive and reliable way to measure it has been an active area of MRI research for over two decades2,3. Currently both qualitative and quantitative approaches are used to estimate myelin content. At one end of the spectrum, quantitative approaches (quantitative magnetization transfer, relaxometry) have shown promising results4, both in terms of relationship with histology and clinical applications. Unfortunately, these approaches require additional sequences and long acquisition time that is problematic for clinical applications. At the other end of the spectrum, a widespread qualitative method relies instead on the ratio between T1-weighted (T1w) and T2-weighted (T2w) data5. Despite the advantage given by the ubiquity of these data, the maps have an arbitrary contrast and a range of values difficult to interpret. To close the gap between these two perspectives, here we propose to leverage image-to-image translation and generative adversarial networks (GANs)6 to develop a method to estimate myelin water fraction (MWF) from T1w and T2w data.Datasets and pre-processing
117 healthy subjects (mean age[SD]: 30.85[10.97]; gender ratio F/M: 0.61) were scanned in two different sessions on two different scanners. T1w and T2w images were acquired on a Siemens Prisma 3T using respectively a magnetization-prepared 180-degrees radio-frequency pulses and rapid gradient-echo (MPRAGE) sequence (TR: 2300 ms; TE: 2 ms; FOV: 256x256x192 mm, voxel size: 1x1x1 mm, FA: 9°, TI: 857 ms, GRAPPA factor: 2, phase-encoding direction: A>>P) and a turbo spin echo sequence (TR: 8000 ms; TE: 82 ms;voxel size: 1x1x2 mm, sagittal acquisition). In a separate session, multi-component relaxometry data were acquired on a Siemens Magnetom Connectom 3T scanner using sequences implementing the McDESPOT protocol7, including T1w 3D spoiled gradient-recalled echo sequence (SPGR) image, an inversion recovery-prepped SPGR image and a steady-state free precession (SSFP) image. Data acquisition details have been reported previously8. The T1w volumes were regridded to match the spatial resolution of the T2w ones. A non-linear transformation from the anatomical to the MNI space was estimated using ANTs9 to then align the JHU atlas template with the T1w data. Preprocessing of multi-component relaxometry data included brain extraction using HD-BET10 followed by T1w resampling and masking brain-extracted data to SPGR-IR resolution using ANTs. SSFP and SPGR data were corrected for motion (MCFLIRT11) and SPGR-IR data were linearly registered to the motion corrected SPGR (FLIRT12). These data were then used to create B1, T1 and B0 maps (QUIT13, DESPOT114,15, DESPOT216). The mcDESPOT three-compartment model7 was used to separate SPGR and SSFP signals into multiple pools, to finally estimate the MWF map. The final maps were then aligned back to the anatomical data.Training procedure and experiments
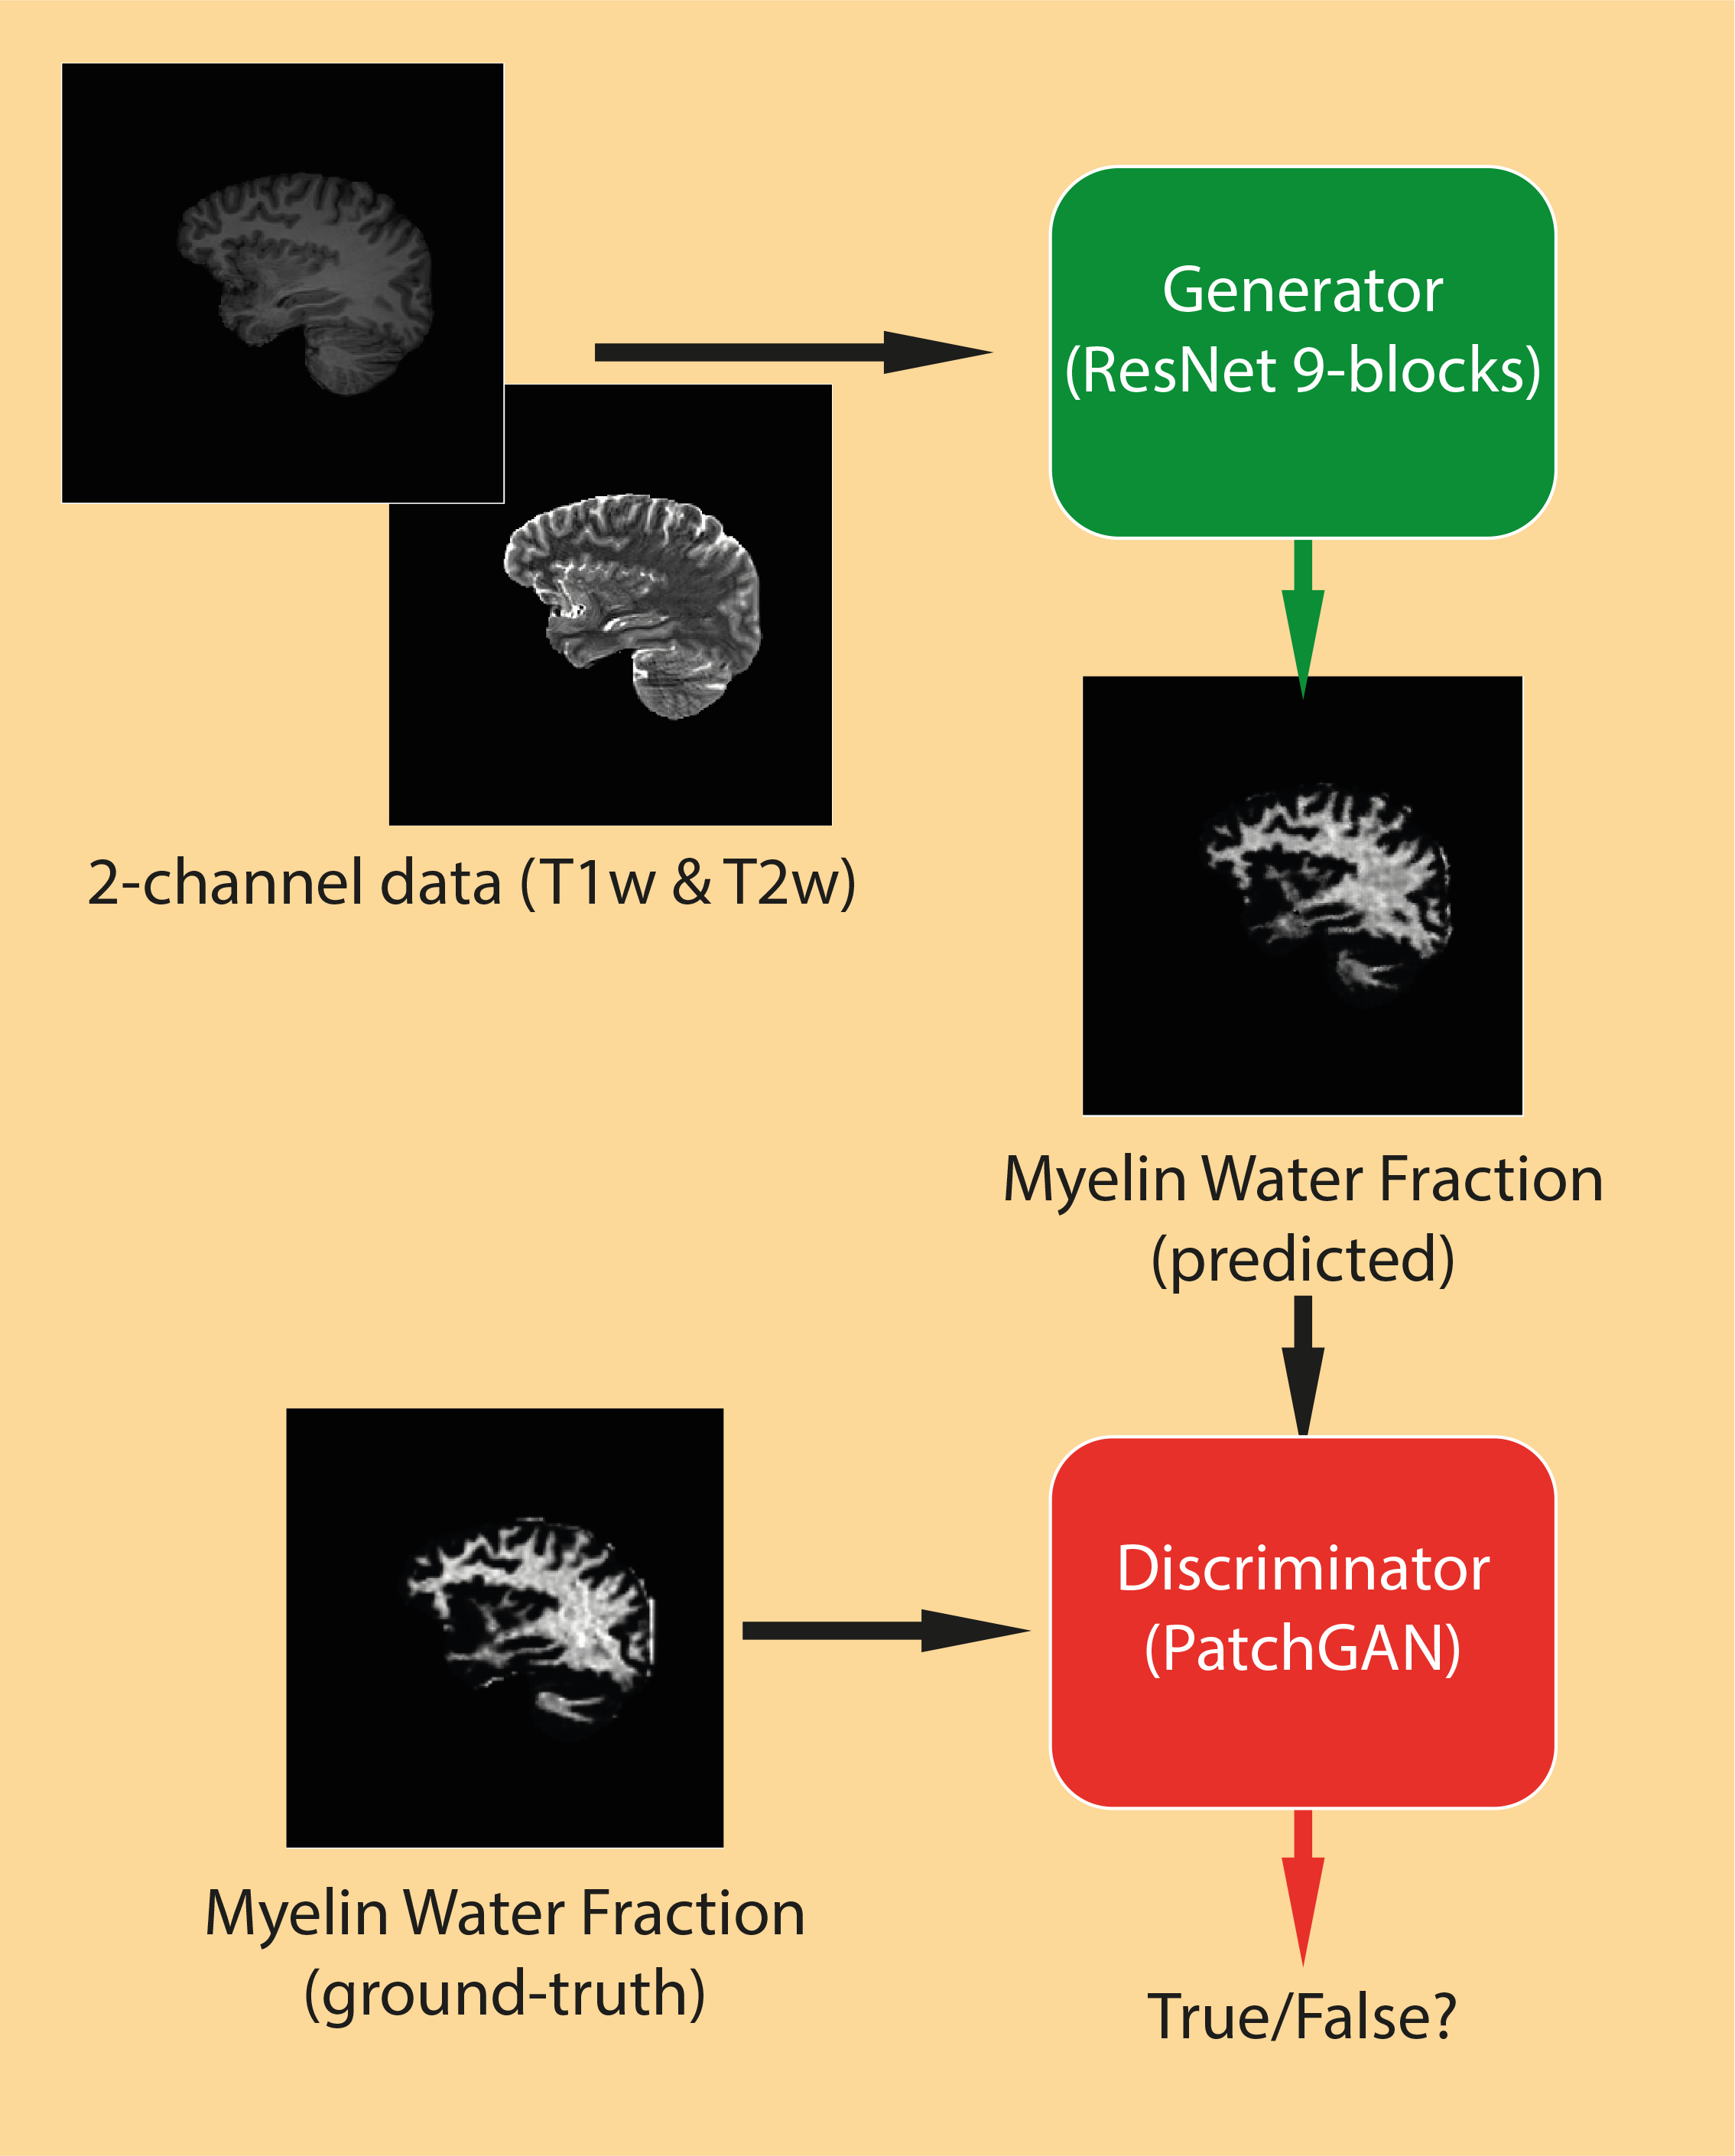
The obtained MWF, T1w and T2w images were subdivided in sagittal slices and used to train a conditional GAN, based on the pix2pix architecture6 (fig.1). Briefly, this architecture relies on a generator (using ResNet17) that predicts a target given a source, and on a discriminator (using PatchGAN18) that classifies targets as real or fake. In this application, the network is designed to take as input a two-channel image, with the channels corresponding respectively to the T1w and T2w data, and to return as an output the estimated MWF map. The dataset was randomly split in training, validation and test sets according to the proportion 80/10/10 (training: 93 subjects (4929 slices), test/validation: 12 subjects each). The validation set was never provided to the network but used to tune the model, while the test set was evaluated only at the end. The predictions from the network were then assessed qualitatively through comparisons with the ground-truth, and quantitatively through regions of interest (ROIs) from the JHU atlas (corpus callosum; corticospinal tract).Results
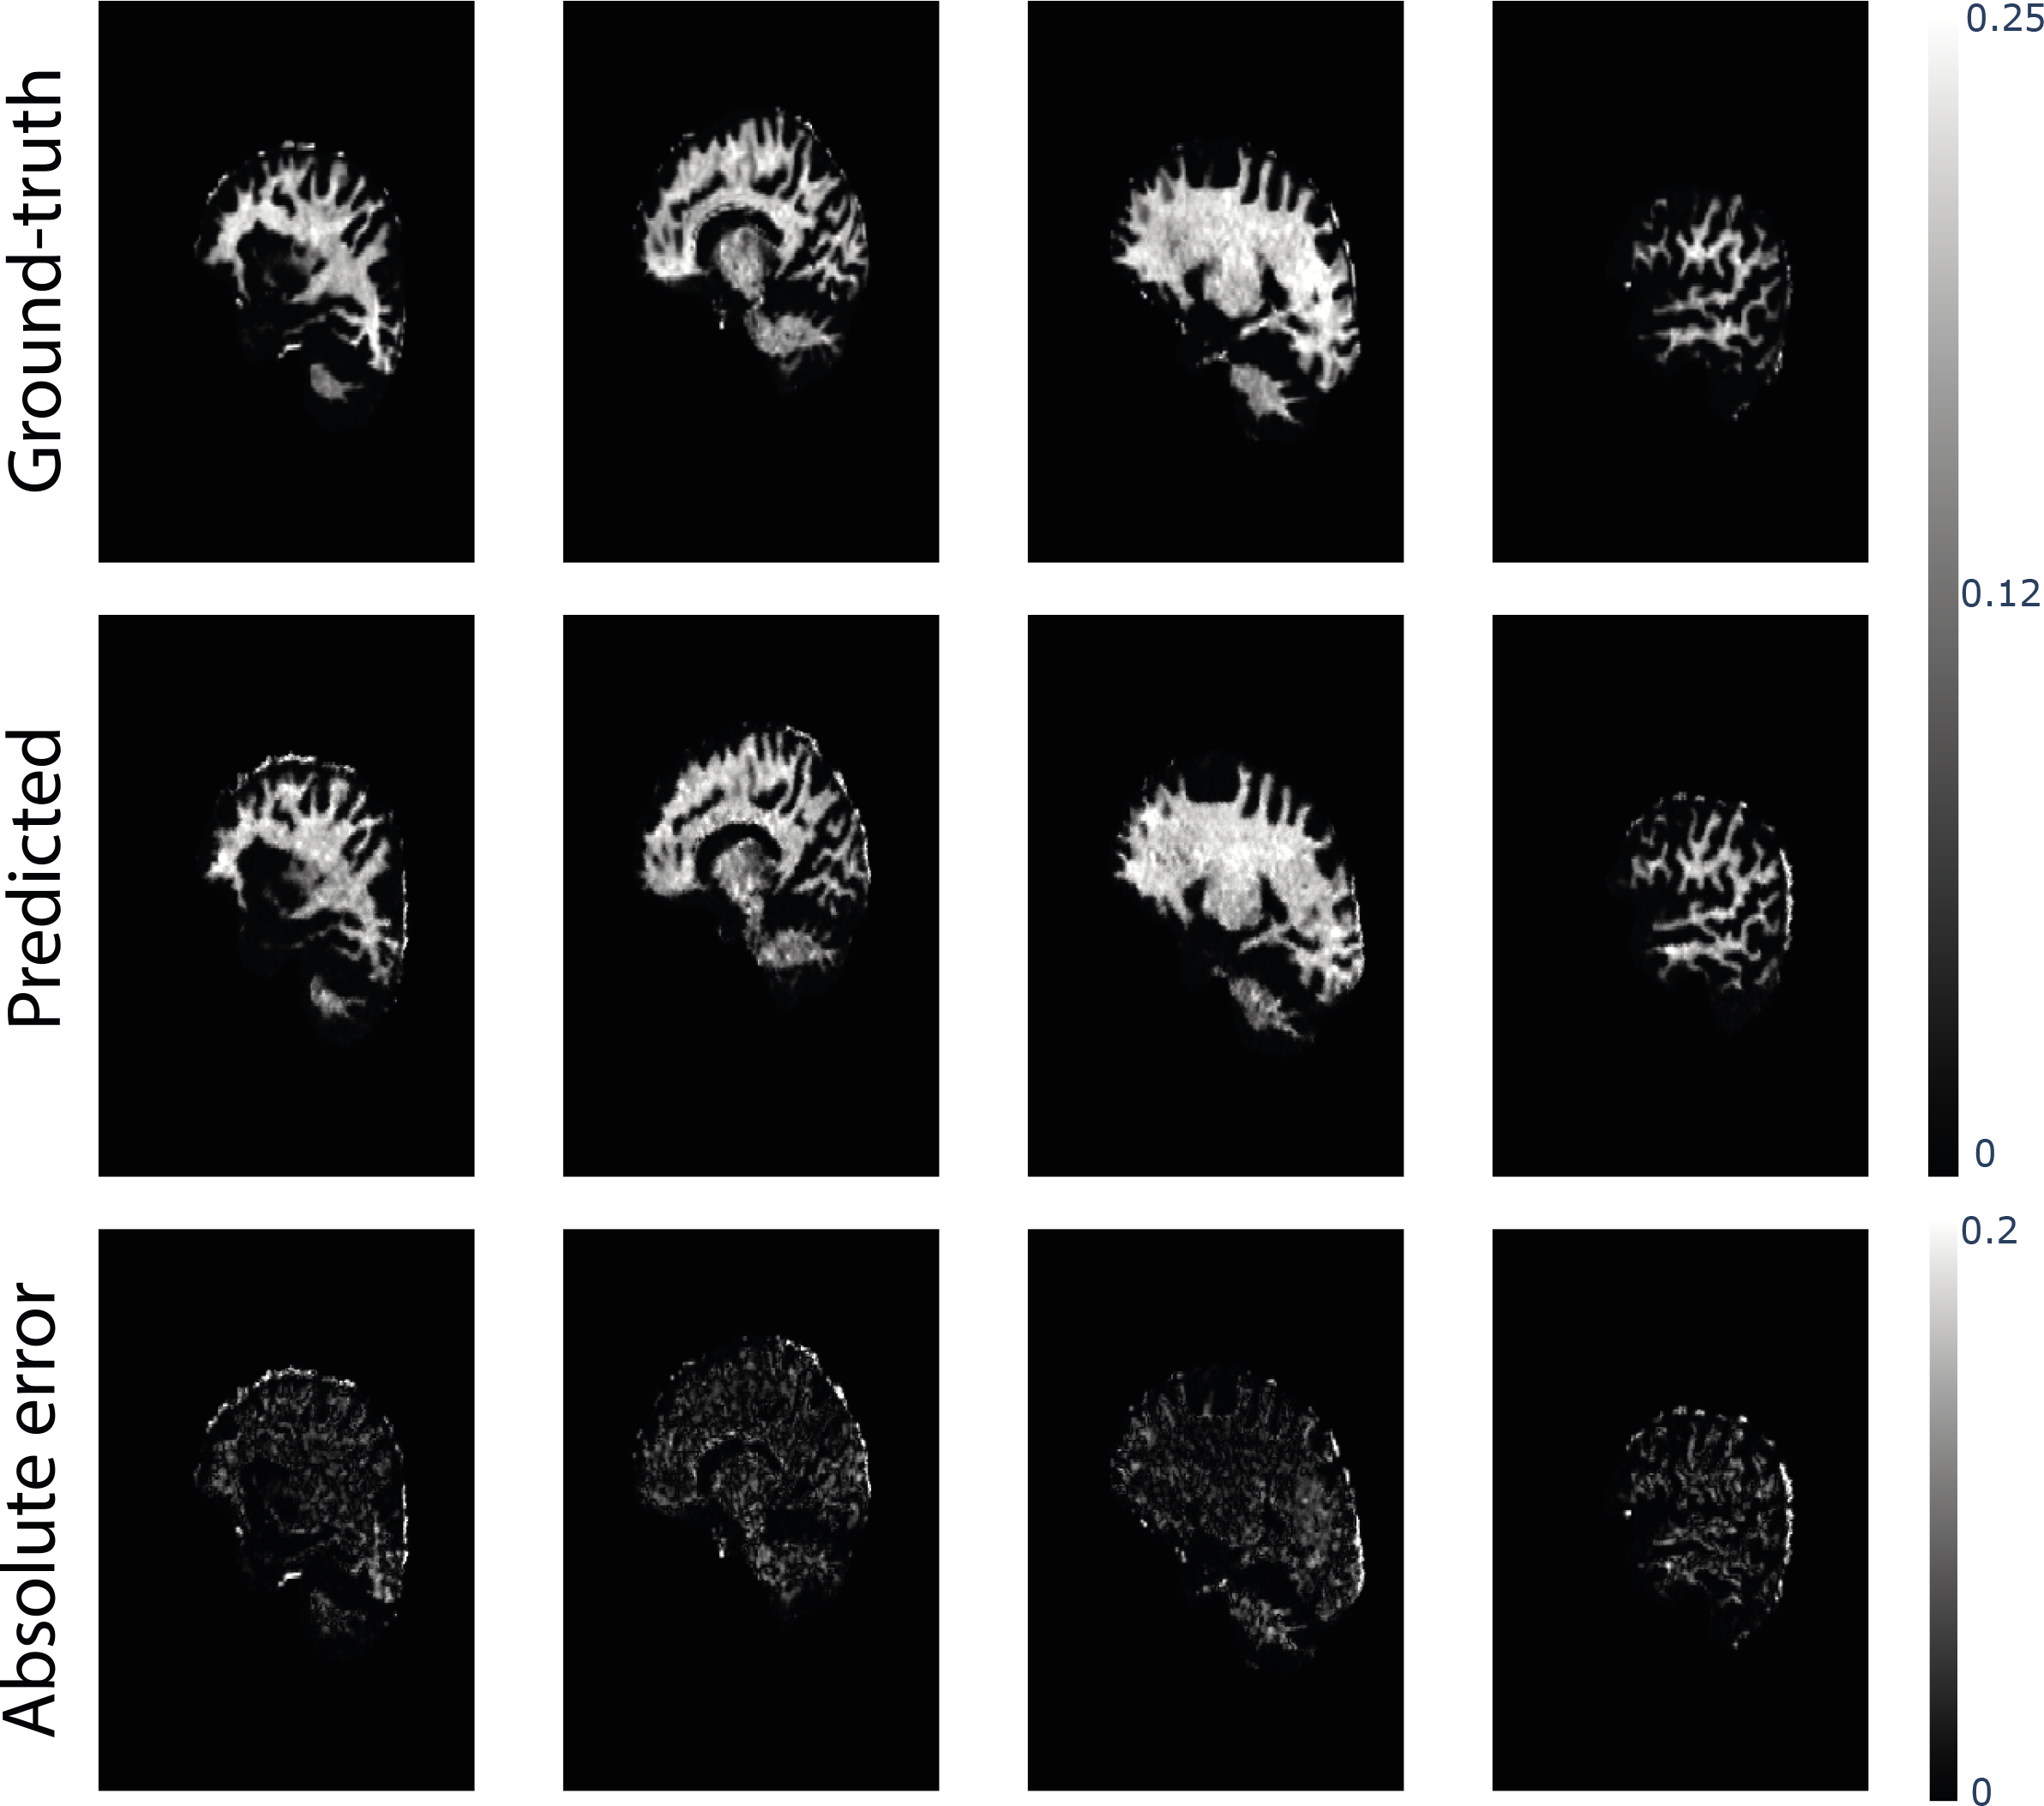
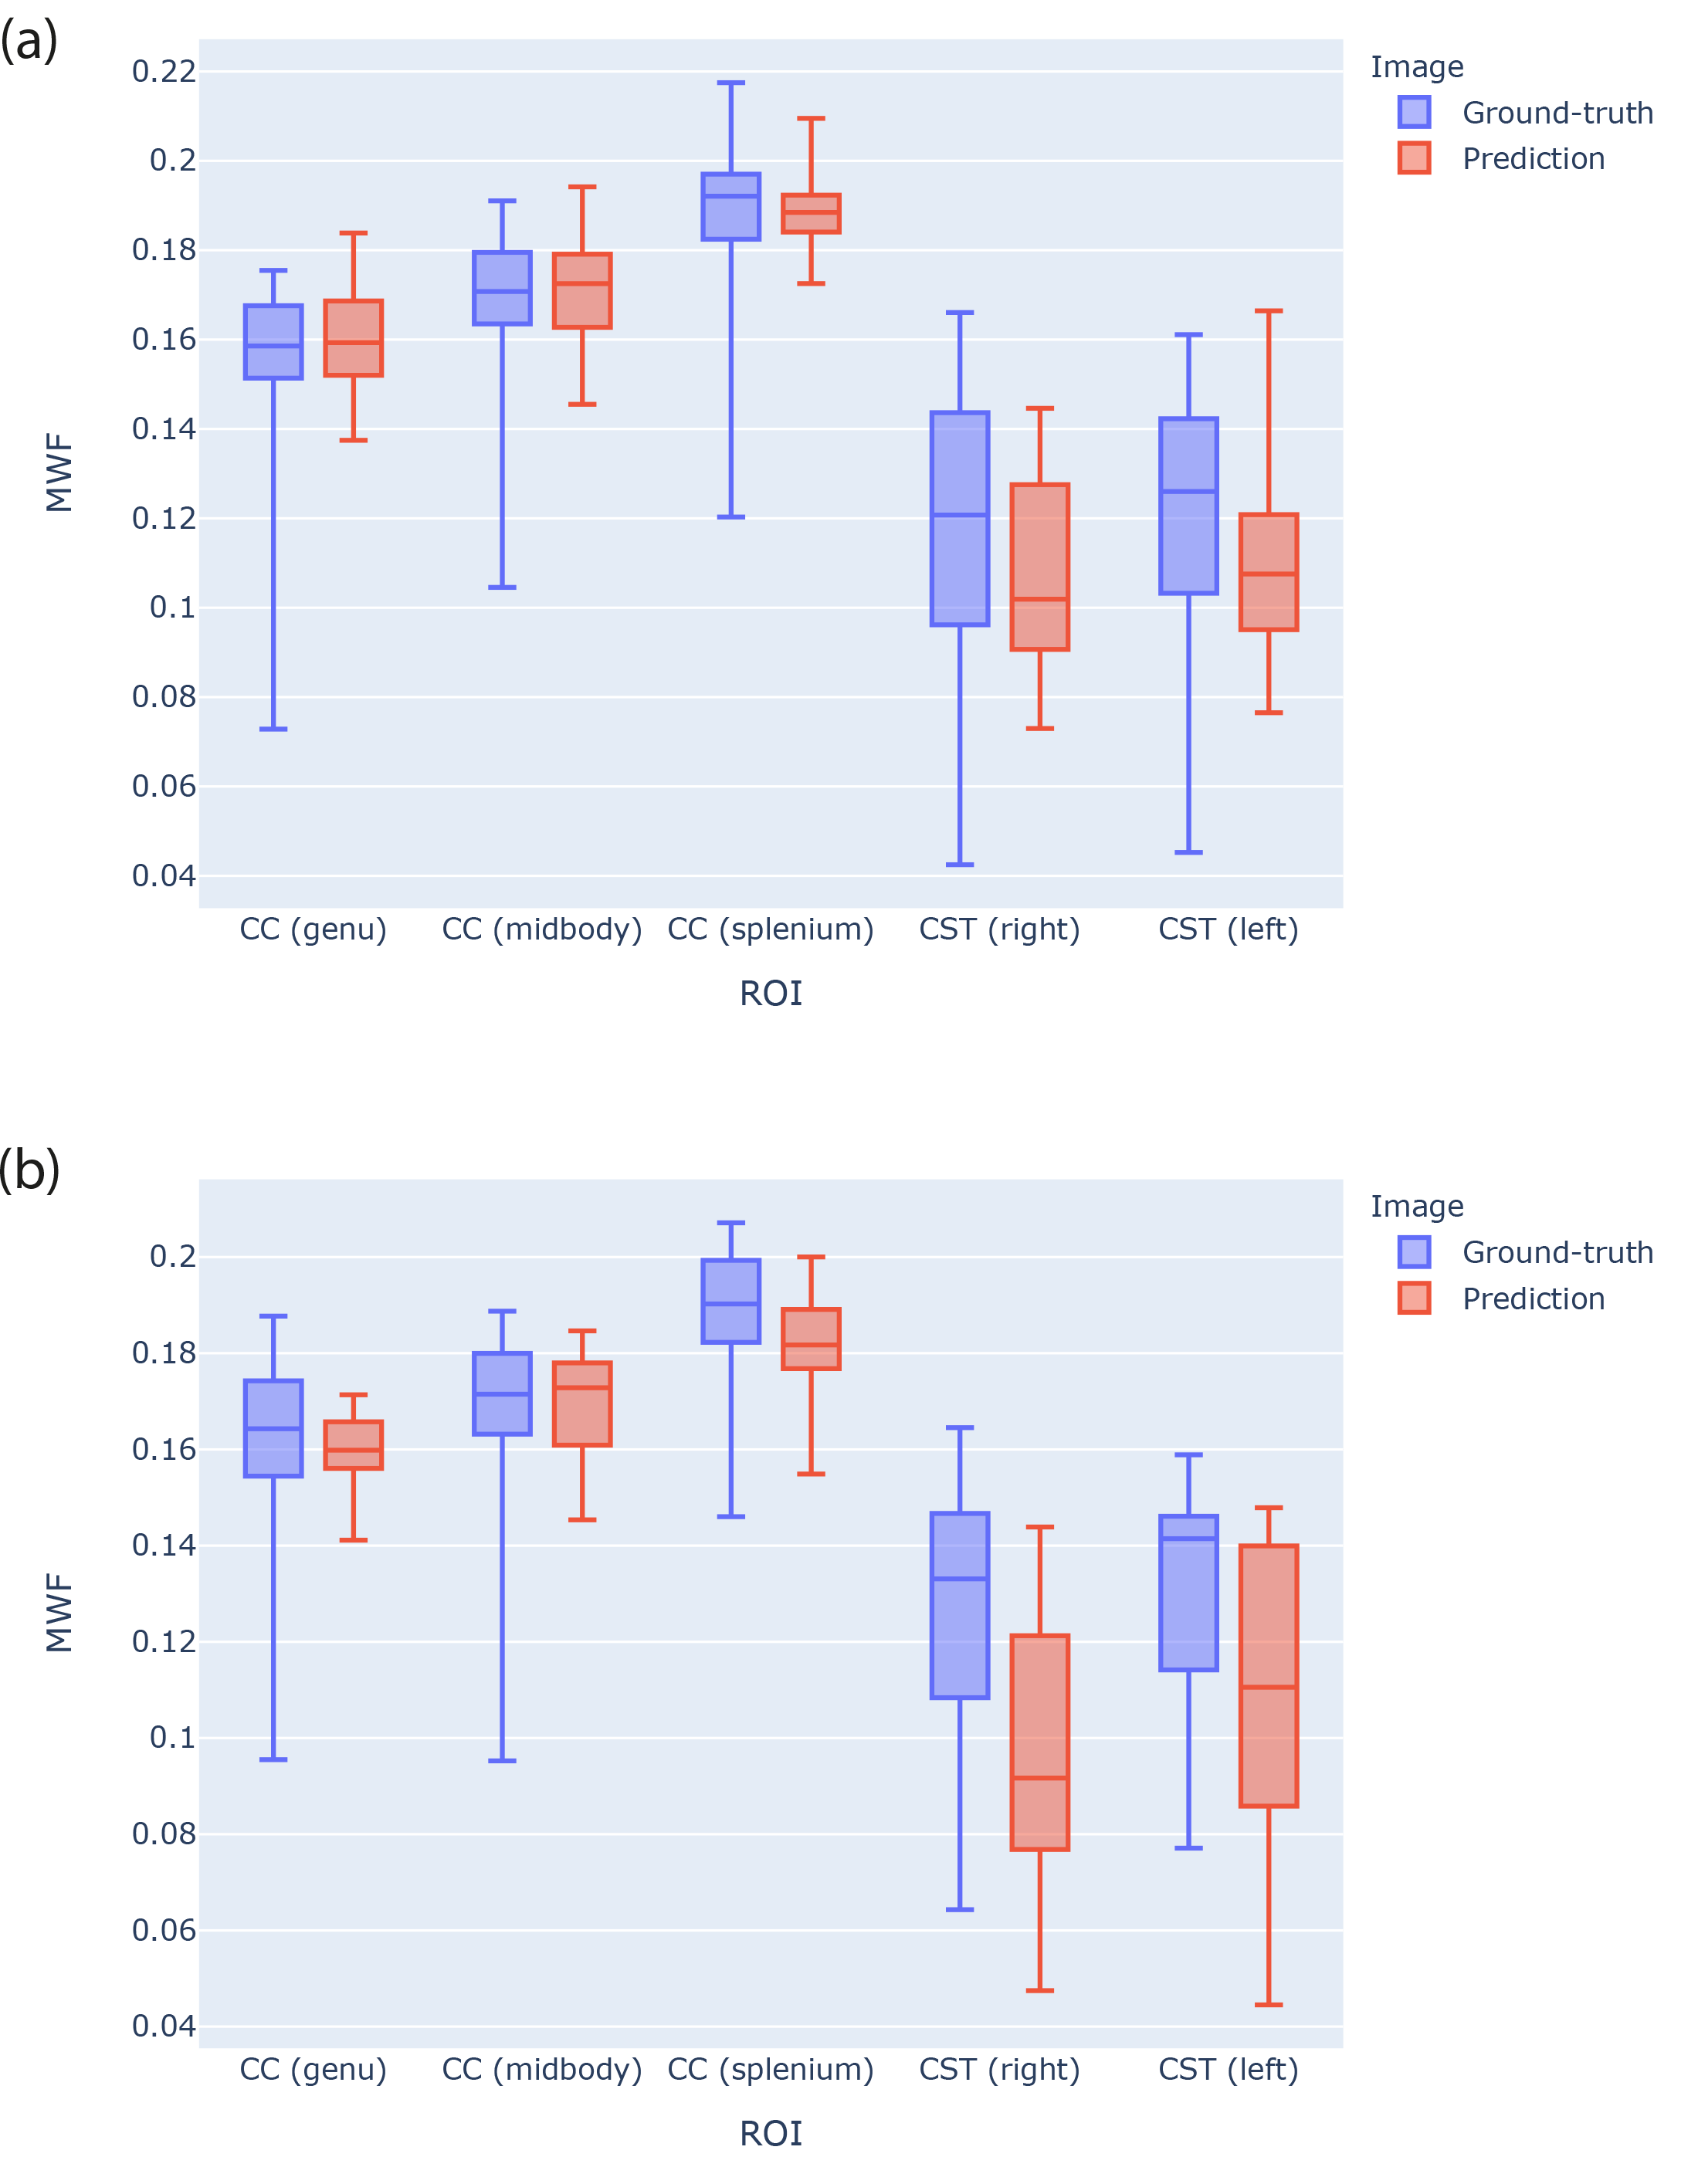
The network was trained using the Adam optimization algorithm for 100 epochs (50 with constant learning rate of 0.0002, and 50 with the learning rate decaying to zero; momentum term: 0.5). To make the network more robust, data was augmented with random rotations (up to 30°) and translations (up to 10 voxels). To preserve the contrast, L1 loss hyperparameter was set to 1000. Fig.2 shows some randomly picked examples of ground-truth and predicted MWF from the test set with their absolute error. The distribution overall strongly resembles the ground-truth, with higher errors localized only in portions of non-brain tissue that were not excluded during the masking. From a quantitative perspective, fig.3 shows the average MWF for five ROIs respectively for the validation(a) and test(b) sets. In both cases, the distributions show similar values and present correspondent ranges for each ROI.Discussion
The results here presented show the potential of image-to-image translation for myelin estimation purposes. Qualitative and quantitative comparisons demonstrate an overall agreement, that could potentially lead to use synthetised MWF for ROI-based analysis. We envision that this approach could provide interpretable, standardised myelin maps in datasets and protocols where the inclusion of quantitative tailored acquisitions is not a viable option. To ensure a wider adoption, future work will focus on tackling two major challenges: (1) harmonization19, to make this approach generalize to data acquired on any scanner; and (2) pathology, leveraging uncertainty estimation20 in GANs to aid the network in detecting and accounting for lesions and abnormal contrast.Acknowledgements
The data were acquired at the UK National Facility for In Vivo MR Imaging of Human Tissue Microstructure funded by the EPSRC (grant EP/M029778/1), and The Wolfson Foundation, and supported by a Wellcome Trust Investigator Award (096646/Z/11/Z) and a Wellcome Trust Strategic Award (104943/Z/14/Z). This work was also supported from the Wellcome Trust through a Sir Henry Wellcome Postdoctoral Fellowship (213722/Z/18/Z).References
1. Nave KA, Werner HB. Myelination of the nervous system: mechanisms and functions. Ann Rev Cell Develop Biol. 2014; 30:503–533.
2. Stanisz GJ, Kecojevic A, Bronskill MJ, et al. Characterizing white matter with magnetization transfer and T(2). Magn Reson Med. 1999; 42:1128-1136.
3. MacKay A, Whittall K, Adler J, et al. In vivo visualization of myelin water in brain by magnetic resonance. Magn Reson Med. 1994; 31:673–677.
4. Mancini M, Karakuzu A, Cohen-Adad J, et al. An interactive meta-analysis of MRI biomarkers of myelin. eLife. 2020; 9:e61523.
5. Ganzetti M, Wenderoth N, Mantini D. Whole brain myelin mapping using T1- and T2-weighted MR imaging data. Front Hum Neurosci. 2014; 8.
6. Isola P, Zhu J, Zhou T, et al. Image-to-Image Translation with Conditional Adversarial Networks. CVPR; 2017.
7. Deoni SCL, Matthews L, Kolind SH. One component? Two components? Three? The effect of including a nonexchanging “free” water component in multicomponent driven equilibrium single pulse observation of T1 and T2. Magn Reson Med. 2013; 70:147-154.
8. Koller K, Rudrapatna U, Chamberland M, et al. MICRA: Microstructural image compilation with repeated acquisitions. Neuroimage. 2021; 225:117406.
9. Avants BB, Tustison N, Song G. Advanced normalization tools (ANTS). Insight J. 2009; 2(365):1-35.10. Isensee F, Schell M, Pflueger I, et al. Automated brain extraction of multisequence MRI using artificial neural networks. Hum Brain Mapp. 2019; 40(17):4952-64.
11. Jenkinson M, Bannister P, Brady JM, et al. Improved Optimisation for the Robust and Accurate Linear Registration and Motion Correction of Brain Images. NeuroImage. 2002; 17(2):825-841.
12. Jenkinson M, Smith S. A global optimisation method for robust affine registration of brain images. Med Image Anal. 2001; 5(2):143-56.
13. Wood. QUIT: QUantitative Imaging Tools. J Open Source Software. 2018; 3(26):656.
14. Deoni SC. High‐resolution T1 mapping of the brain at 3T with driven equilibrium single pulse observation of T1 with high‐speed incorporation of RF field inhomogeneities (DESPOT1‐HIFI). J Magn Res. 2007; 26(4):1106-11.
15. Homer J, Beevers MS. Driven-equilibrium single-pulse observation of T1 relaxation. A re-evaluation of a rapid 'new' method for determining NMR spin-lattice relaxation times. J Magn Reson. 1985; 63:287–297.
16. Deoni SC, Rutt BK, Peters TM. Rapid combined T1 and T2 mapping using gradient recalled acquisition in the steady state. Magn Reson Med. 2003; 49(3):515-26.
17. He K, Zhang X, Ren S, et al. Deep residual learning for image recognition. CVPR; 2016.
18. Zou Z, Lei S, Shi T, et al. Deep adversarial decomposition: A unified framework for separating superimposed images. CVPR; 2020.
19. Ravano V, Démonet J, Damian D. Protocol harmonization using a generative adversarial network decreases morphometry variability. Ann Proc ISMRM; 2022.
20. Tomczak A, Gupta A, Ilic S, et al. What Can We Learn About a Generated Image Corrupting Its Latent Representation?. MICCAI; 2022.
Figures