5027
Conditional VAE for Single-Voxel MRS Data Generation1Biomedical Engineering - Medical Image Analysis Group, Eindhoven University of Technology, Eindhoven, Netherlands, 2MR R&D - Clinical Science, Philips Healthcare, Best, Netherlands
Synopsis
Keywords: Machine Learning/Artificial Intelligence, Spectroscopy, deep learning, generative modelling
We propose a conditional VAE to synthesize single-voxel MRS data. This deep learning method can be used to enrich in-vivo datasets for other machine learning applications, without using any physics-based models. Our work is a proof-of-concept study which demonstrates the potential of a cVAE for MRS data generation by using a synthetic dataset of 8,000 spectra for training. We evaluate our model by performing a linear interpolation of the latent space, which shows that spectral properties are captured in the latent space, meaning that our model can learn spectral features from the data and can generate new samples.Introduction
Deep Learning (DL) has recently become a prominent tool to process and analyze single-voxel MRS1,2. However, training modern DL models usually requires large datasets which are not always available due to privacy concerns, time consuming acquisitions, and costs involved. One solution to tackle such data scarcity challenges, is to use simulations to generate data for the purpose of data augmentation. Unfortunately, modeling macromolecules3 and scan imperfections4 (e.g., eddy currents, nuisance signals, frequency/phase drifts etc.) remain challenging, making it difficult to simulate realistic conditions using only physics-based models.Variational Autoencoders5 (VAEs) and conditional VAEs6 (cVAEs) are data-driven generative models that have been successfully adopted in biomedical research for tackling data scarcity7. These models try to learn low-dimensional features, known as the latent space, of the training dataset and in turn can generate new examples by sampling from the learned latent space. This generative method does not require physics-based models to simulate realistic conditions.
We propose a cVAE to synthesize single-voxel MRS data for the purpose of enriching existing in-vivo MRS datasets for DL applications. Our work is a proof-of-concept study which demonstrates the potential of a cVAE for MRS data generation by using a synthetic dataset for training. This work is a first step towards using in-vivo spectra for deep generative modelling.
Methods
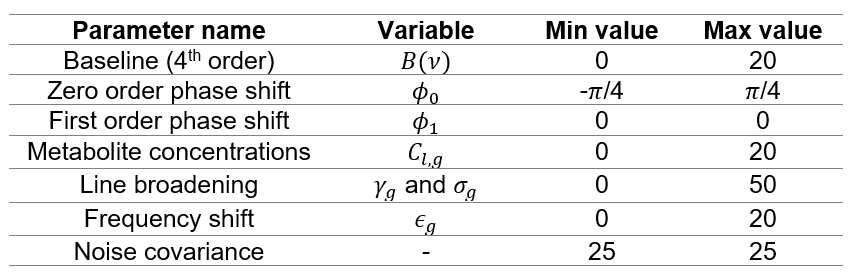
We generate a synthetic dataset using the basis set from the MRS fitting challenge 20168 of the ISMRM MRS study group. Simulated spectra are generated using the parameterized signal model from FSL-MRS9:$$Y(\nu) = B(\nu) + \exp[i(\phi_0+\nu\phi_1)]\sum_{g=1}^{N_G}\sum_{l=1}^{N_g}C_{l,g} M_{l,g}(\nu;\gamma_g,\sigma_g,\epsilon_g)$$
with
$$M_{l,g}(\nu;\gamma_g,\sigma_g,\epsilon_g)=\mathcal{F}\left\{m_{l,g}(t)\exp\left[-((\gamma_g + \sigma^2_gt)+i\epsilon_g)t\right] \right\}$$
where $$$B(\nu)$$$ is the baseline, $$$\phi_0$$$ and $$$\phi_1$$$ the zero- and first-order phase shifts, $$$ C_{l,g} $$$ the metabolite concentration for metabolite $$$l$$$ in group $$$g$$$ , $$$\mathcal{F}$$$ the Fourier transform, $$$m_{l,g}(t)$$$ the basis set, $$$\gamma_g$$$ and $$$\sigma_g$$$ the line broadening parameters and $$$\epsilon_g$$$ the frequency shift. All parameters, except $$$m_{l,g}(t)$$$, are uniformly sampled within a specified range in order to generate 8,000 synthetic spectra (see Table 1). For simplicity, only two metabolites ($$$N_g=2$$$) are simulated (Phosphocreatine (PCr) and N-Acetylaspartic acid (NAA)) and the specified ranges of the parameters are chosen in such a way that clear visible differences between spectra are present. Gaussian noise with a covariance of 25 is added to the simulated spectra and both metabolites are considered as one group ($$$N_G=1$$$).
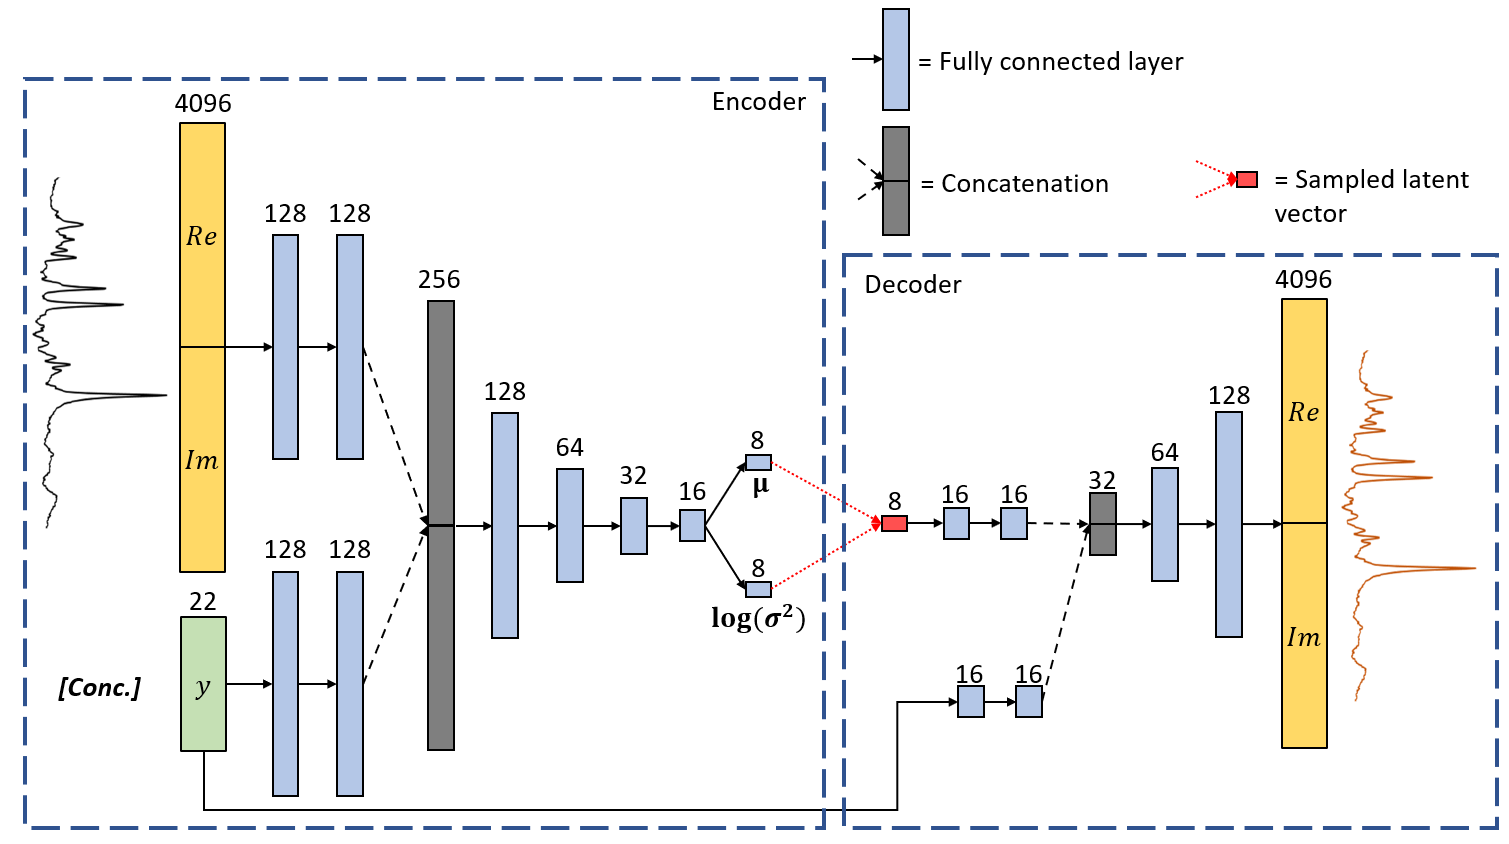
The cVAE model consists of an encoder and a decoder neural network (see Figure 1). The encoder is comprised of two input blocks, one with the real and imaginary part of the spectra and one with the metabolite concentrations as the labels. This input is encoded into the latent space and decoded back to reconstruct the original input spectra. The model is trained using a mean squared error (MSE) reconstruction loss and the Kullback–Leibler (KL)-divergence of the latent space distribution with a standard Gaussian prior. The synthetic dataset is split in a training (6,000) and validation (2,000) set.
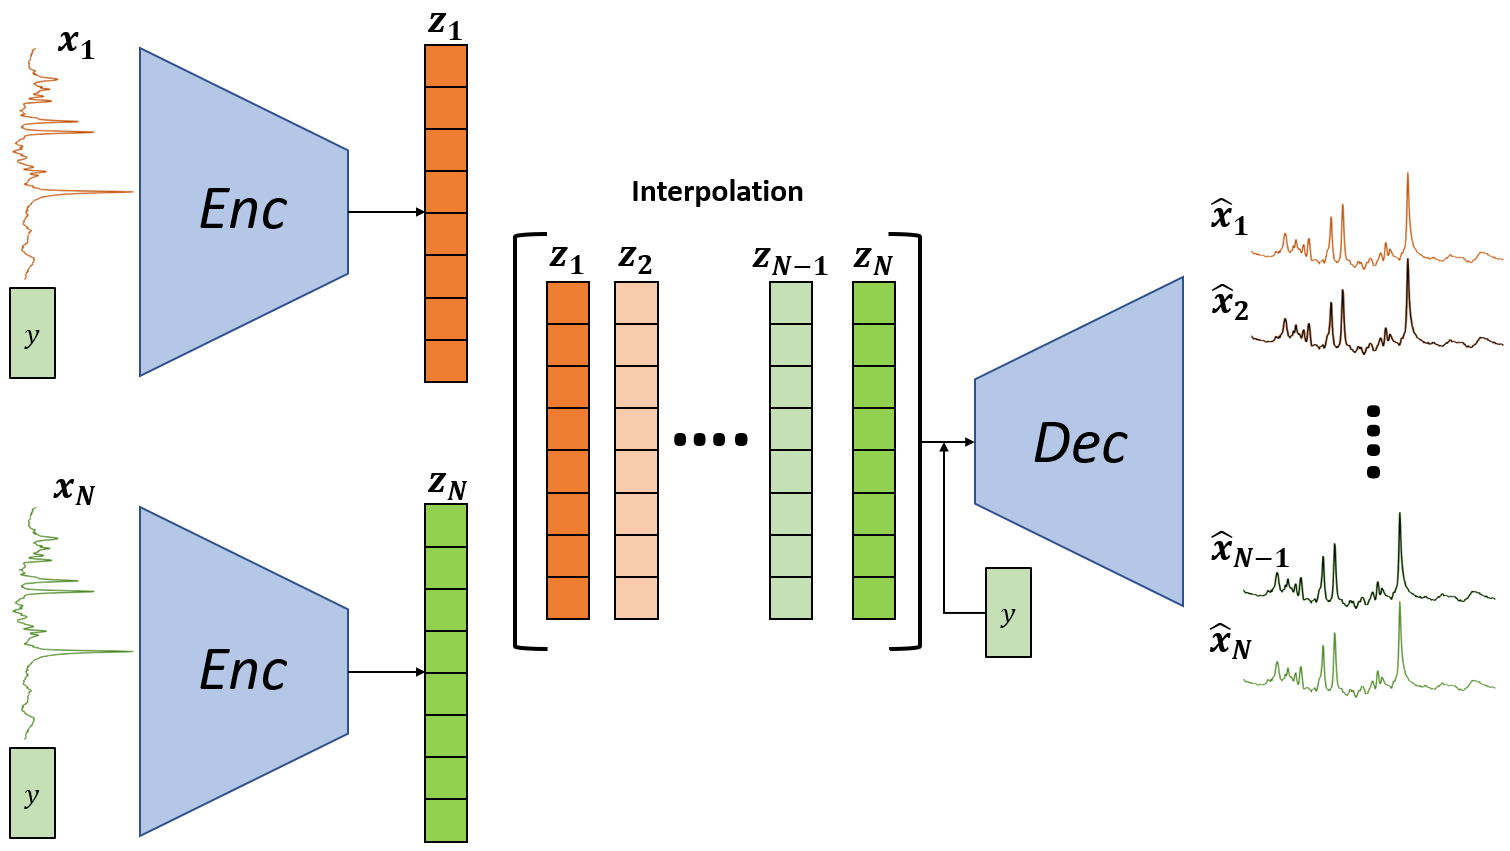
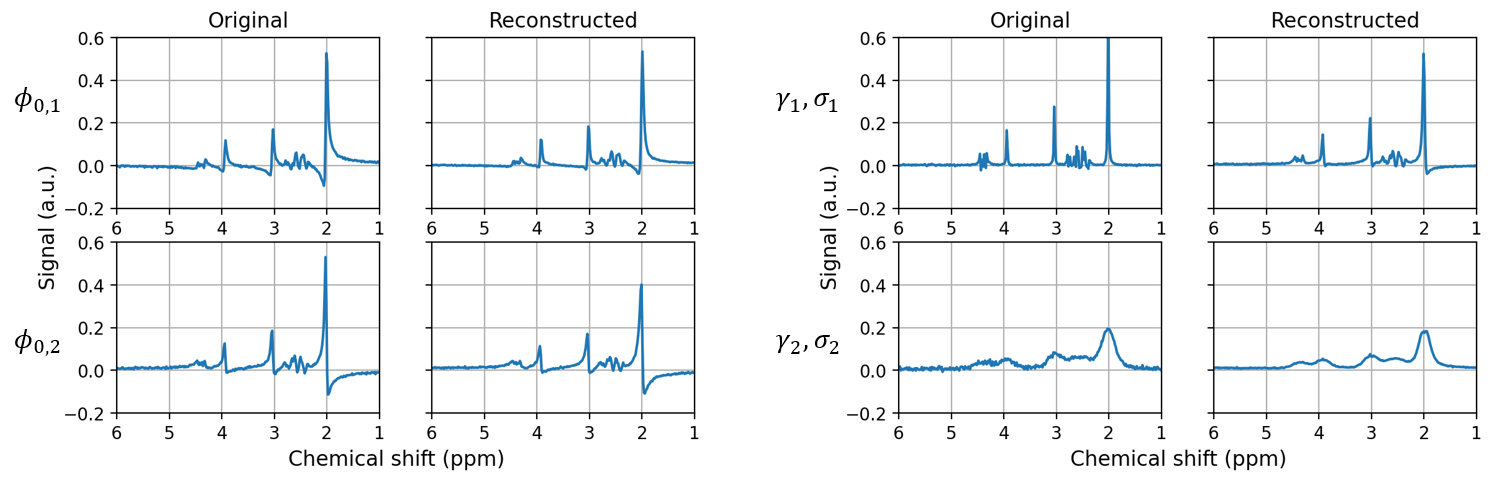
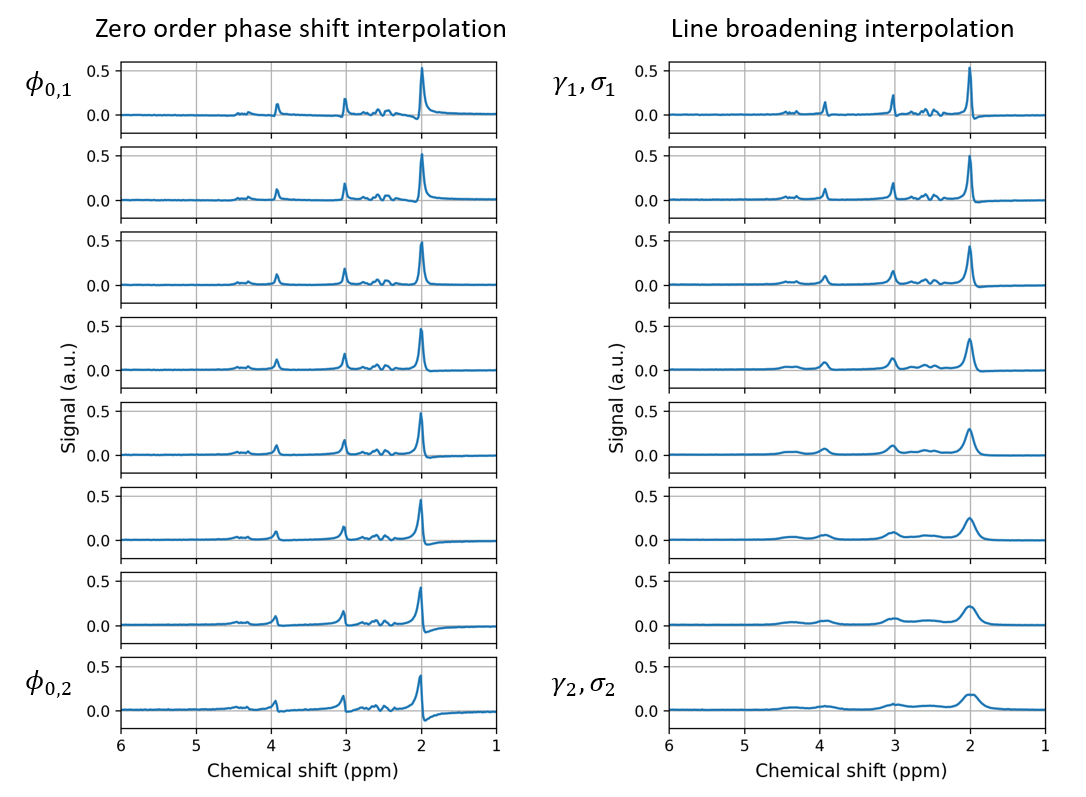
To evaluate the generative part of the cVAE, a latent space evaluation is done to check whether the spectral parameters are captured in the latent space. This evaluation is done for the zero-order phase shift ($$$\phi_0$$$) and the line broadening parameters ($$$\gamma_g$$$ and $$$\sigma_g$$$), by generating an additional test set of four spectra. All test spectra had the same values for $$$B(\nu)$$$, $$$\phi_1$$$, $$$\epsilon_g$$$ and the noise covariance. The metabolite concentrations for PCr and NAA were fixed to 5.0 and 15.0 respectively. One pair of the four spectra had different $$$\phi_0$$$ (i.e., $$$\phi_{0,1}$$$ and $$$\phi_{0,2}$$$) and the other pair had different $$$\gamma_g$$$ and $$$\sigma_g$$$ (i.e., $$$\gamma_1$$$, $$$\sigma_1$$$ and $$$\gamma_2$$$, $$$\sigma_2$$$). The difference between these values is equal to the maximum range from Table 1. The two pairs of corresponding spectra are encoded to a latent vector and linearly interpolated to a total of eight spectra per pair. An overview of the interpolation procedure is shown in Figure 2.
Results
Figure 3 shows the four spectra from the test set with their corresponding reconstructions. This figure demonstrates that the cVAE model can create accurate reconstructions. Some inconsistencies can be spotted concerning the phase shifts and peak amplitudes when comparing the original with the reconstruction. Additionally, the noise in the original spectra seems to be removed, which was expected because VAEs are known to have denoising properties7. The interpolation results in Figure 4 show smooth transitions between $$$\phi_{0,1}$$$ and $$$\phi_{0,2}$$$ and between $$$\gamma_1$$$, $$$\sigma_1$$$ and $$$\gamma_2$$$, $$$\sigma_2$$$. This indicates that the parameters from Table 1, excluding the metabolite concentrations, are described by the latent space.Discussion and Conclusion
We showed that our proposed cVAE model can generate new spectra that are similar to the initial dataset and that spectral properties can be encoded in the latent space. However, a quantitative evaluation is still necessary to fully understand and explain the structure of the latent space. This study can be seen as the first step towards a generative model to enrich an in-vivo dataset for training DL applications. Future work will focus on model optimization for more control in the generative process and the inclusion of in-vivo data. Applications for the encoder, such as spectral classification, will also be investigated.Acknowledgements
This research is a part of the Spectralligence project, supported by the Information Technology for European Advancement program (ITEA4) under project No. 20209.References
1. Chen D, Wang Z, Guo D, Orekhov V, Qu X. Review and Prospect: Deep Learning in Nuclear Magnetic Resonance Spectroscopy. Chem – Eur J. 2020;26(46):10391-10401. doi:10.1002/chem.202000246
2. Rajeev SK, Rajasekaran MP, Krishna Priya R, Al Bimani A. A Review on Magnetic Resonance Spectroscopy for Clinical Diagnosis of Brain Tumour using Deep Learning. In: 2021 3rd International Conference on Advances in Computing, Communication Control and Networking (ICAC3N). ; 2021:461-465. doi:10.1109/ICAC3N53548.2021.9725561
3. Cudalbu C, Behar KL, Bhattacharyya PK, et al. Contribution of macromolecules to brain 1H MR spectra: Experts’ consensus recommendations. NMR Biomed. 2021;34(5):e4393. doi:10.1002/nbm.4393
4. Near J, Harris AD, Juchem C, et al. Preprocessing, analysis and quantification in single-voxel magnetic resonance spectroscopy: experts’ consensus recommendations. NMR Biomed. 2021;34(5):e4257. doi:10.1002/nbm.4257
5. Kingma DP, Welling M. Auto-Encoding Variational Bayes. Published online May 1, 2014. doi:10.48550/arXiv.1312.6114
6. Kingma DP, Mohamed S, Jimenez Rezende D, Welling M. Semi-supervised Learning with Deep Generative Models. In: Advances in Neural Information Processing Systems. Vol 27. Curran Associates, Inc.; 2014. Accessed October 7, 2022. https://proceedings.neurips.cc/paper/2014/hash/d523773c6b194f37b938d340d5d02232-Abstract.html
7. Wei R, Mahmood A. Recent Advances in Variational Autoencoders With Representation Learning for Biomedical Informatics: A Survey. IEEE Access. 2021;9:4939-4956. doi:10.1109/ACCESS.2020.3048309
8. Marjanska M, Deelchand DK, Kreis R. MRS fitting challenge data setup by ISMRM MRS study group. Published online April 16, 2021. doi:10.13020/kw61-3j13
9. Clarke WT, Stagg CJ, Jbabdi S. FSL-MRS: An end-to-end spectroscopy analysis package. Magn Reson Med. 2021;85(6):2950-2964. doi:10.1002/mrm.28630
Figures