5021
Micro-anisotropy and time-dependent diffusion in the mouse brain in vivo with spherical tensor encoding and the spectral principal axis system1Danish Research Centre for Magnetic Resonance, Centre for Functional and Diagnostic Imaging and Research, Copenhagen University Hospital Amager and Hvidovre, Copenhagen, Denmark, 2Department of Neurosurgery, Neurobiology, and Anatomy, Medical College of Wisconsin, Milwaukee, , USA, WI, United States
Synopsis
Keywords: Microstructure, Diffusion/other diffusion imaging techniques, Tensor-valued encoding, time-dependent diffusion
Accounting for time-dependent diffusion (TDD) in tensor-valued encoding is required for unbiased assessment of microscopic anisotropy (µA). We have previously introduced the spectral principle axis system (SPAS) to find linear tensor encoding (LTE) projections of spherical tensor encoding (STE) with maximum spread of sensitivity to TDD. This can be used to simultaneously achieve unbiased µA and TDD contrasts within a single protocol. Here we present results from in vivo experiments in a mouse brain. The two independent contrasts (µA- TDD) indicate consistent variations in different brain regions.Introduction
Tensor-valued diffusion encoding employs different b-tensor shapes to probe tissue microstructure unconfounded by macroscopic anisotropy1-10, but can be confounded by time-dependent diffusion (TDD)11,12. To account for TDD, spectral domain analysis13-16 can be applied to tensor-valued encoding17,18. While tuning of b-tensors affects mean diffusivity and is given by the spectral trace18-21, spectral anisotropy may affect apparent kurtosis and cause spherical tensor encoding (STE) to loose rotational invariance22-24. Linear tensor encoding (LTE) can be tuned to STE by finding STE projections with encoding spectra corresponding to the spectral trace25. Similar results can be achieved by geometrically averaging signals from any orthogonal set of projections25. The spectral principal axis system (SPAS) is a special set of encoding projections with maximum spread of sensitivity to TDD24, reflecting spectral anisotropy. It can simultaneously achieve tuning, necessary for unbiased microscopic anisotropy (µA), and TDD contrast, thus separating effects of cell shape and size25.Here we show experimental results from in vivo mouse brain, employing STE and SPAS-LTE, indicating consistent µA and TDD effects in different brain regions.
Theory
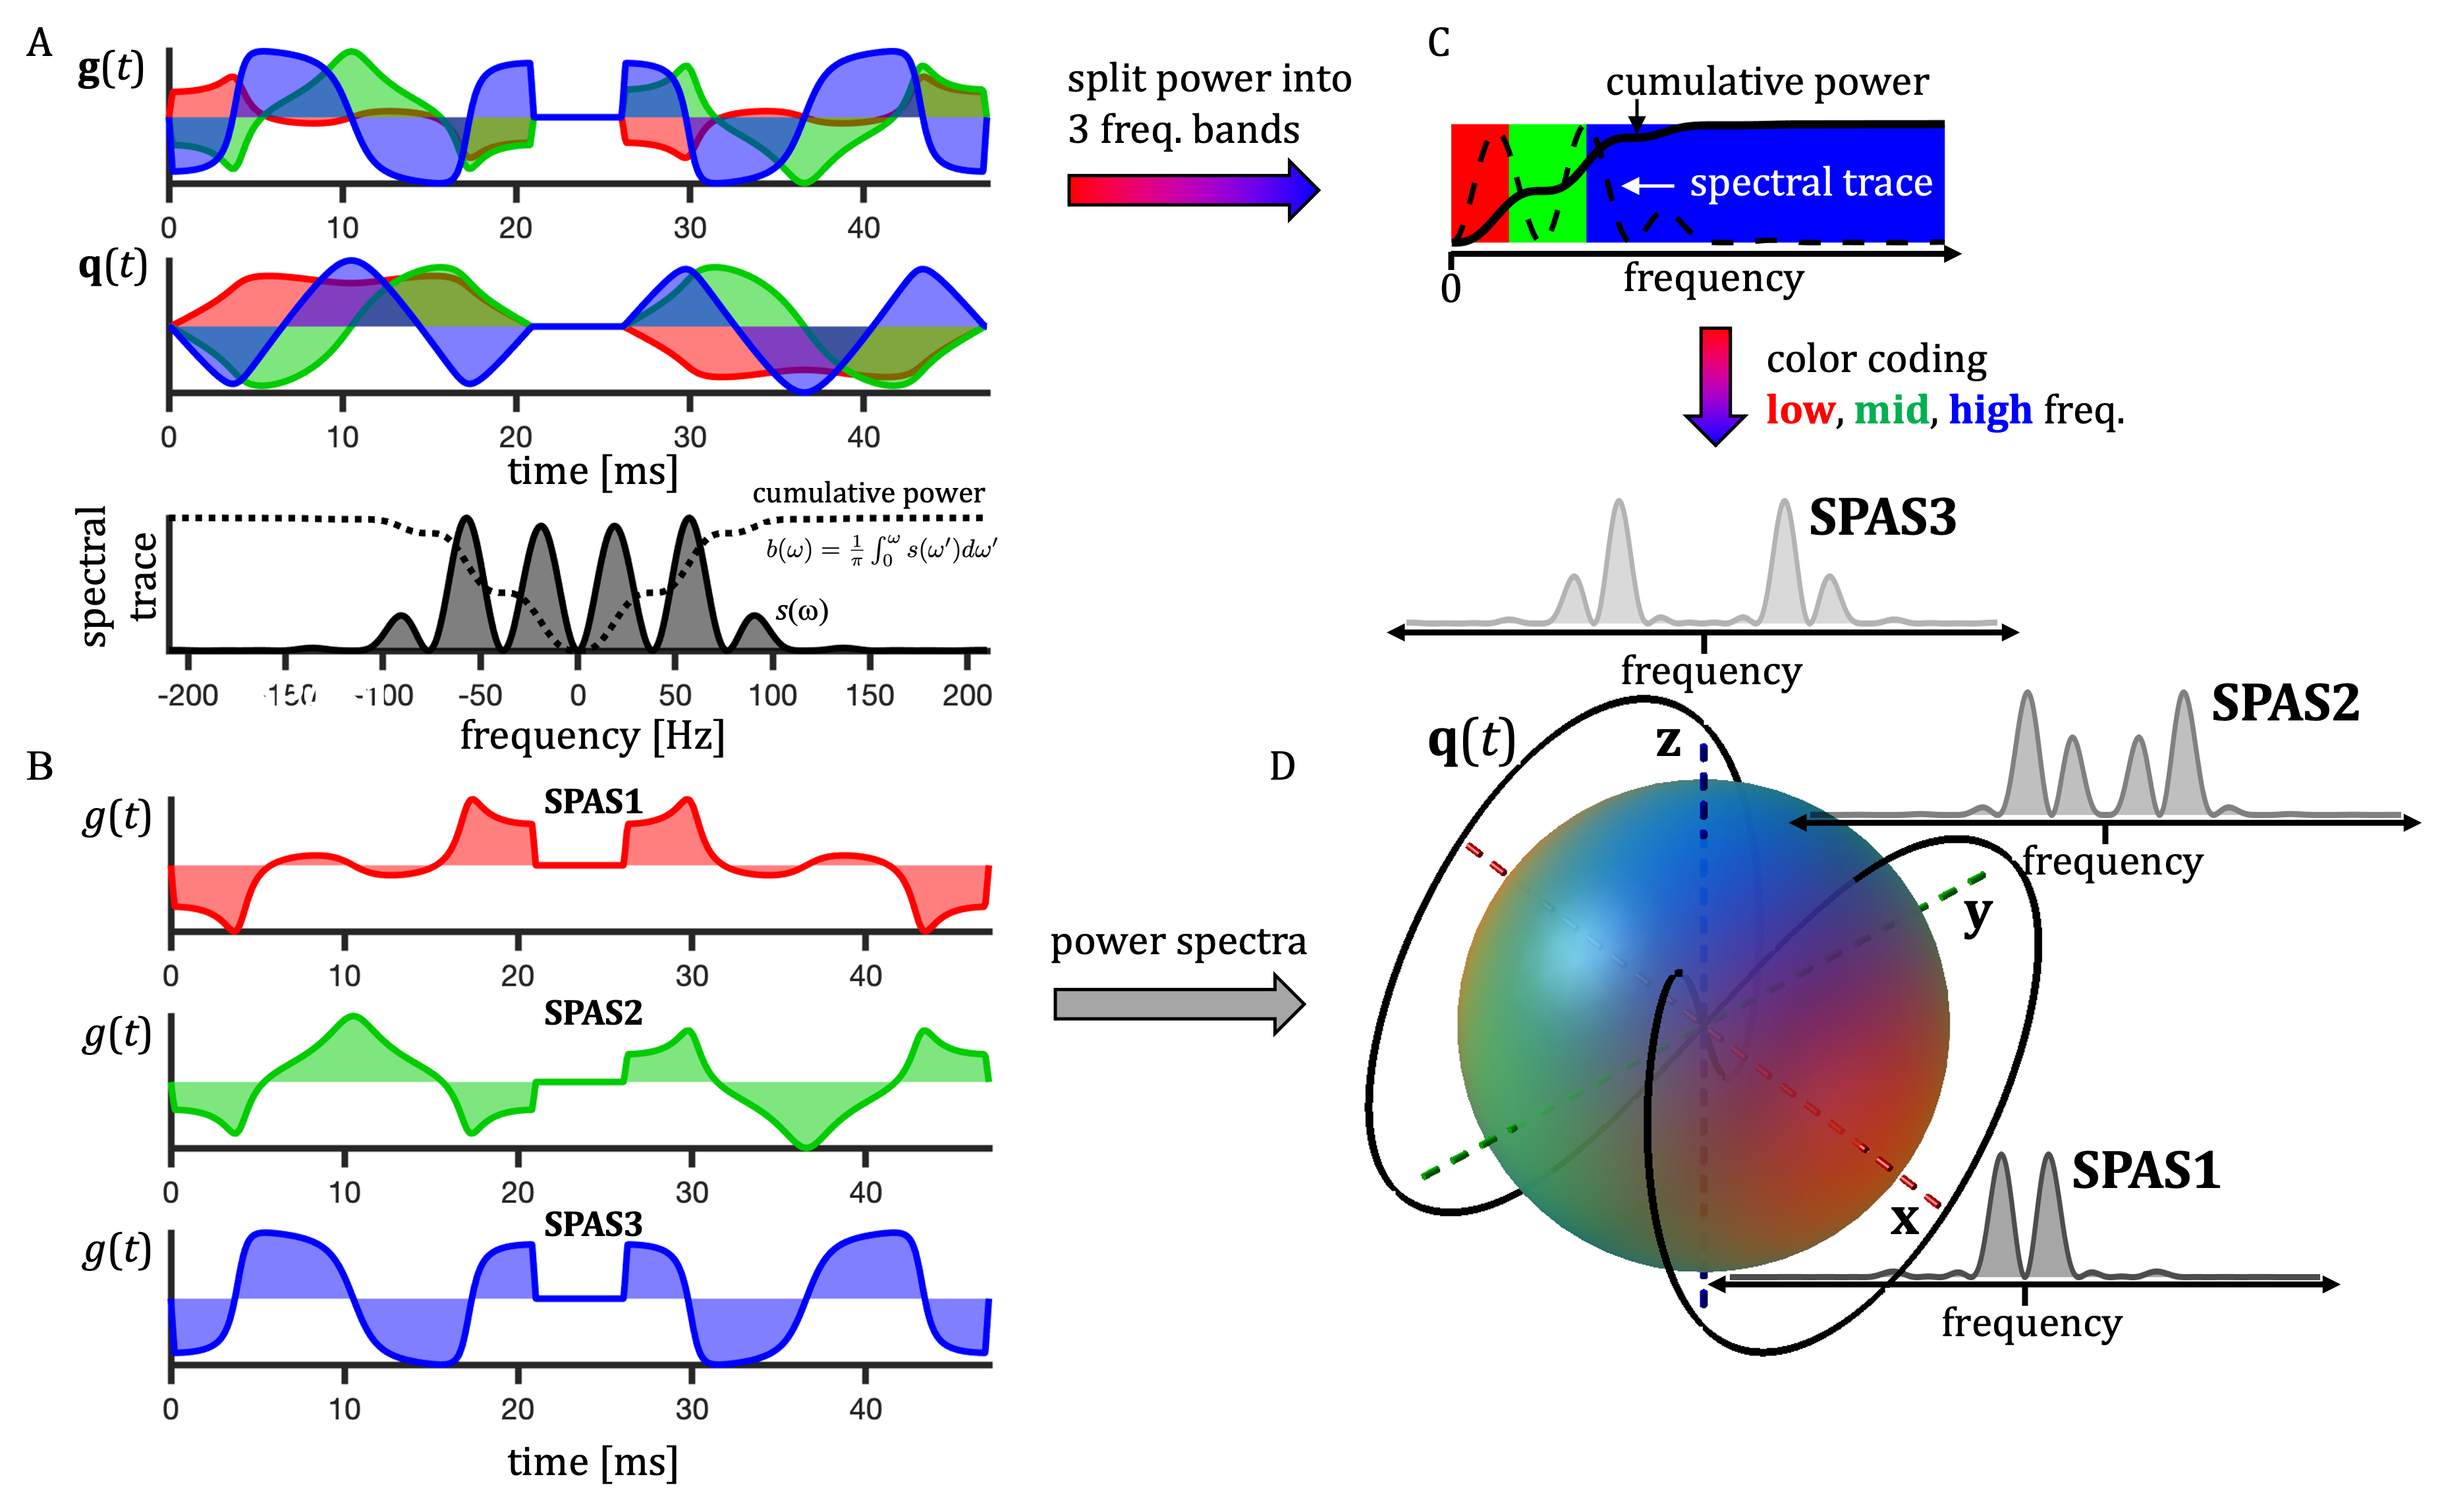
Apparent diffusivity is given by the cross-power spectral densities $$$s_{ij}(\omega)$$$ from spectra of dephasing waveforms $$$\mathbf{q}(t)$$$18 (Fig. 1), $$s_{ij}(\omega) \equiv q_i(\omega)\bar{q}_j(\omega).$$ The b-value is given by the spectral trace $$$s(\omega) \equiv \sum_{i=1}^{3} s_{ii}(\omega)$$$ and the cumulative encoding power is $$ b_{ij}(\omega) =\frac{1}{\pi}\int_{0}^{\omega}s_{ij}(\omega’)d\omega’.$$ Direction dependent sensitivity to TDD (spectral anisotropy) is given by projections along unit vectors $$$\bf{u}$$$, $$s_{\mathbf{u}}(\omega) = \sum_{i,j} s_{ij}(\omega)u_i u_j.$$Methods
A NMRI mouse was imaged on a Bruker Biospin 7T MR Scanner (0.66 T/m gradients, 1H quadrature T/R mouse cryoprobe). The mouse head was secured in the stereotactic frame. The mouse was kept under isoflurane (2-2.5%) and at 37.5°C using retro-controlled air flow. The breathing rate (> 65 bpm) was monitored through a pressure pillow.STE was generated with an open-source code26,27 with 21 ms duration and repeated after the 180 RF gap of 5 ms for a 47 ms velocity compensated encoding (Fig 1A) within a navigated multi-shot SE-EPI sequence. STE and SPAS-LTEs were performed in 6 directions (3 orthogonal x 2 antipodal) with 4 b-values: 194, 775, 1745, 3100 s/mm2. Readout: TR/TE = 3000/53 ms, FOV = 20 x 20 mm2, matrix = 64 x 64, 6 slices of 1 mm, 3 repetitions, scan time = 1h 13 min.
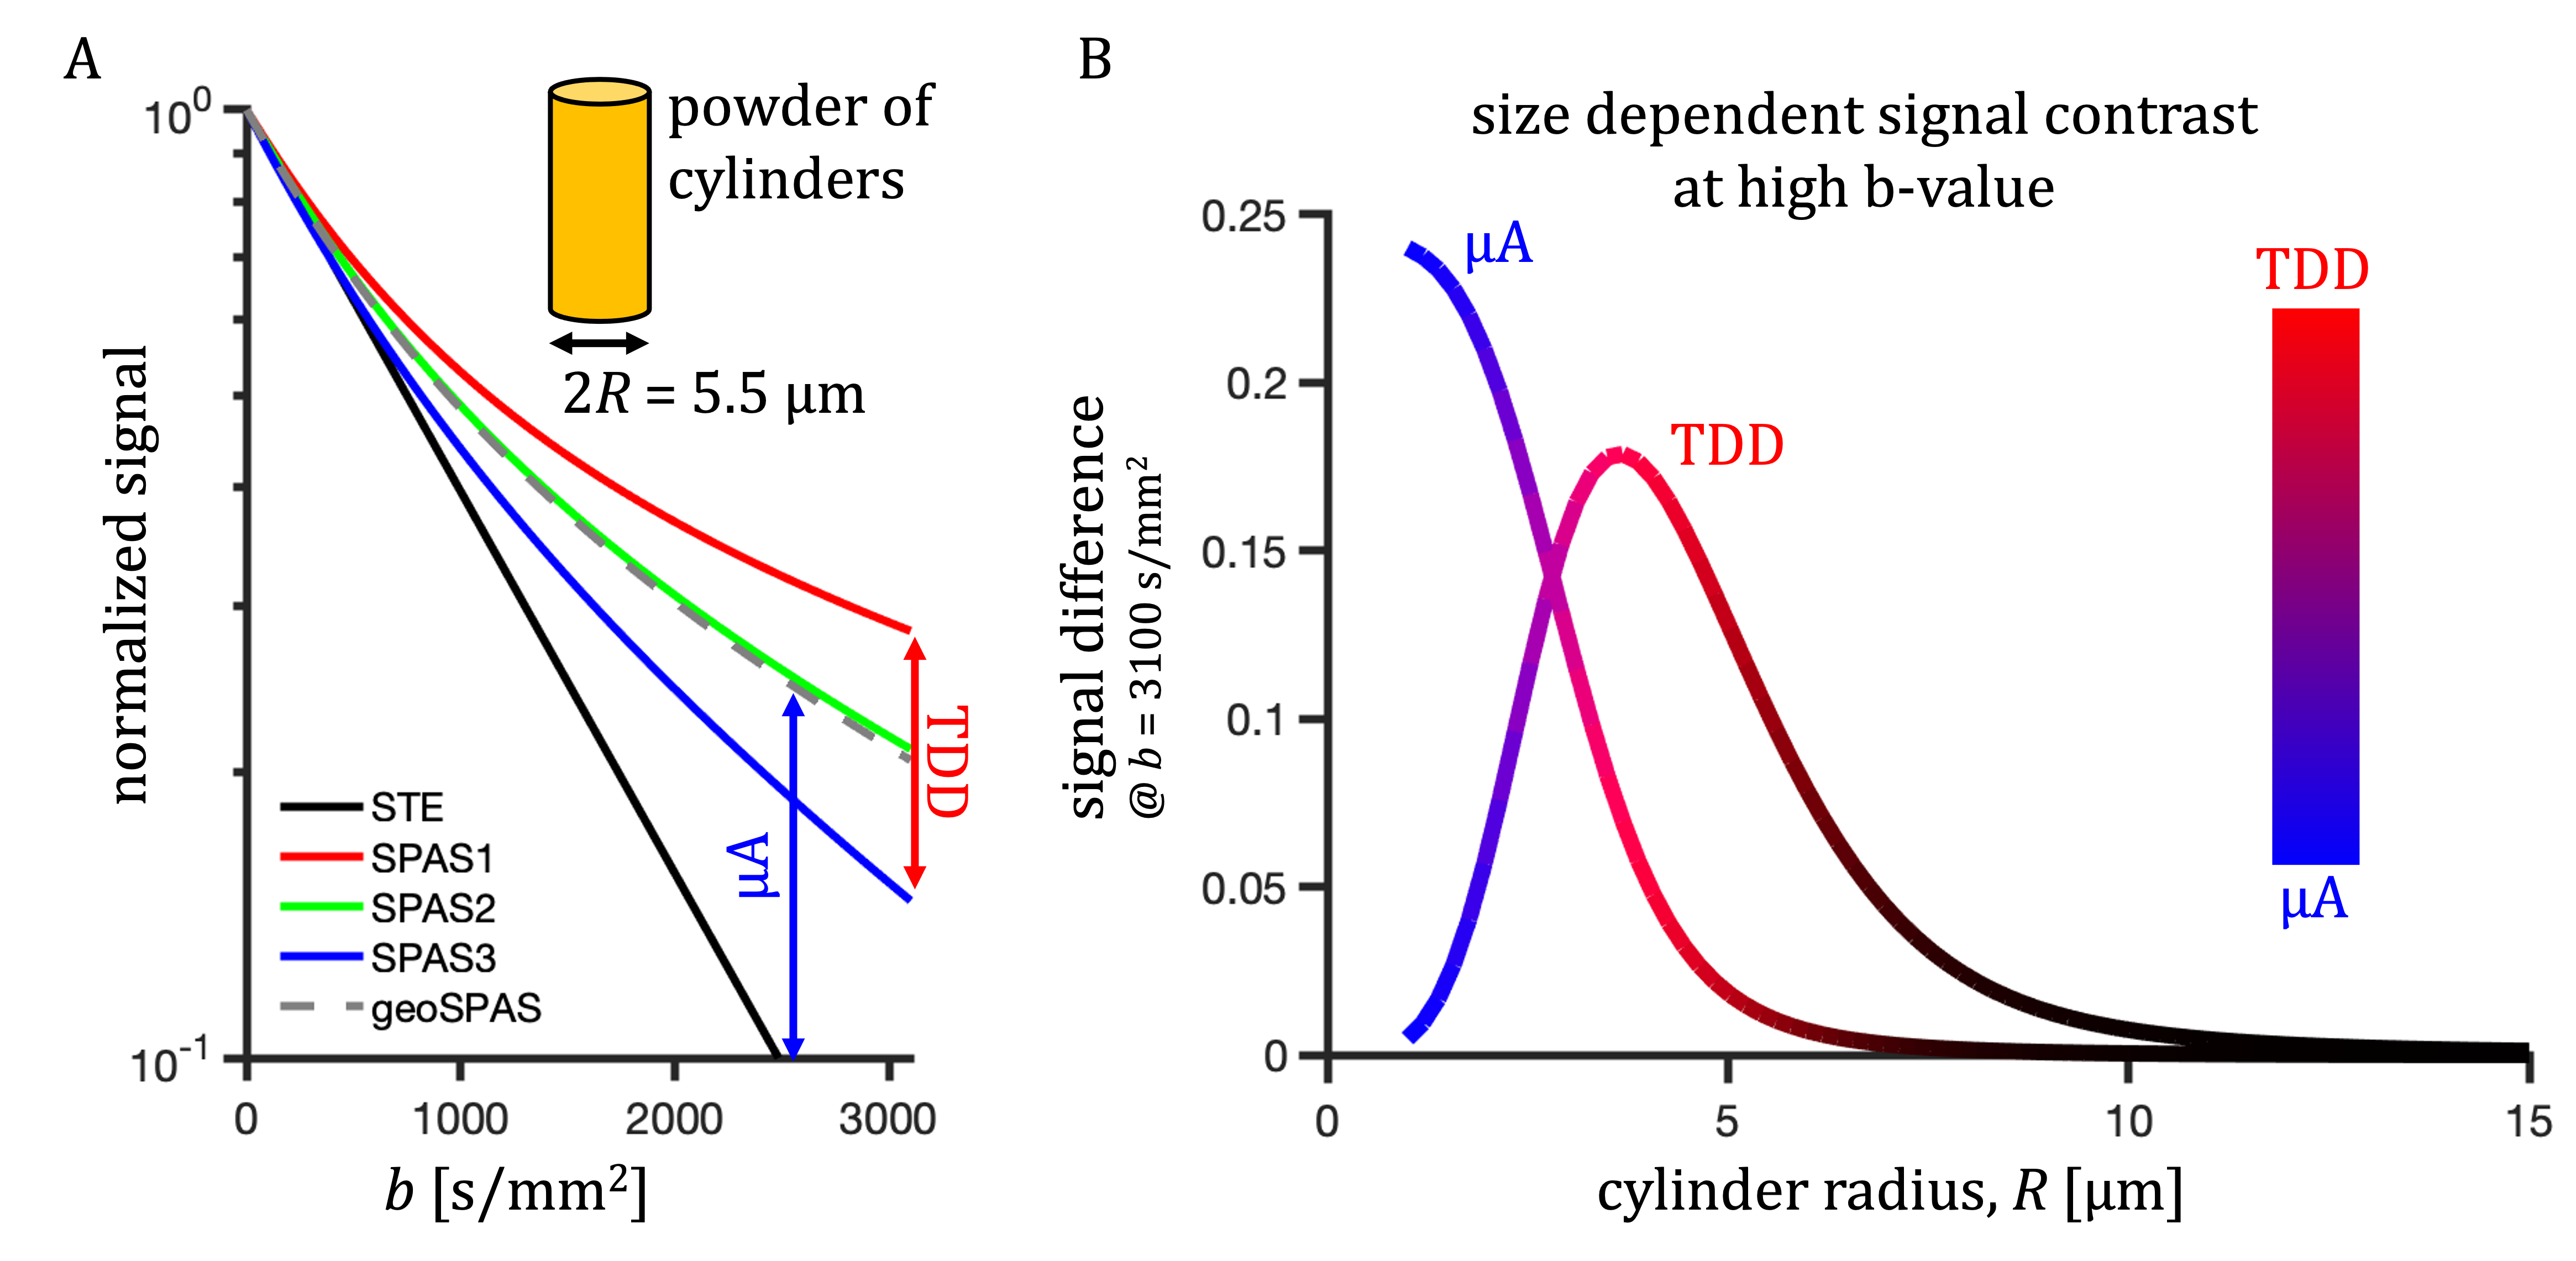
Similar analysis was used as previously25. Color coding in Fig. 1 has RGB-weights given by the total power within frequency bands determined by the $$$b(\omega)$$$ reaching b/3 and 2b/3. The SPAS is given by eigenvectors of the low-frequency filtered b-tensor24,25. Signals shown in Fig. 2 were calculated for 1000 uniformly oriented cylinders of varying radii. The geoSPAS results were obtained by geometrically averaging signals from SPAS-LTE and arithmetically averaging across directions. Average signal differences at maximum b-value, from geoSPAS - STE and SPAS1 - SPAS3 were mapped to the range 0-1 (min-max signal difference) for color-coding used in Figs. 2B and 3B (blue and red for µA and TDD contrasts respectively).
Results and discussion
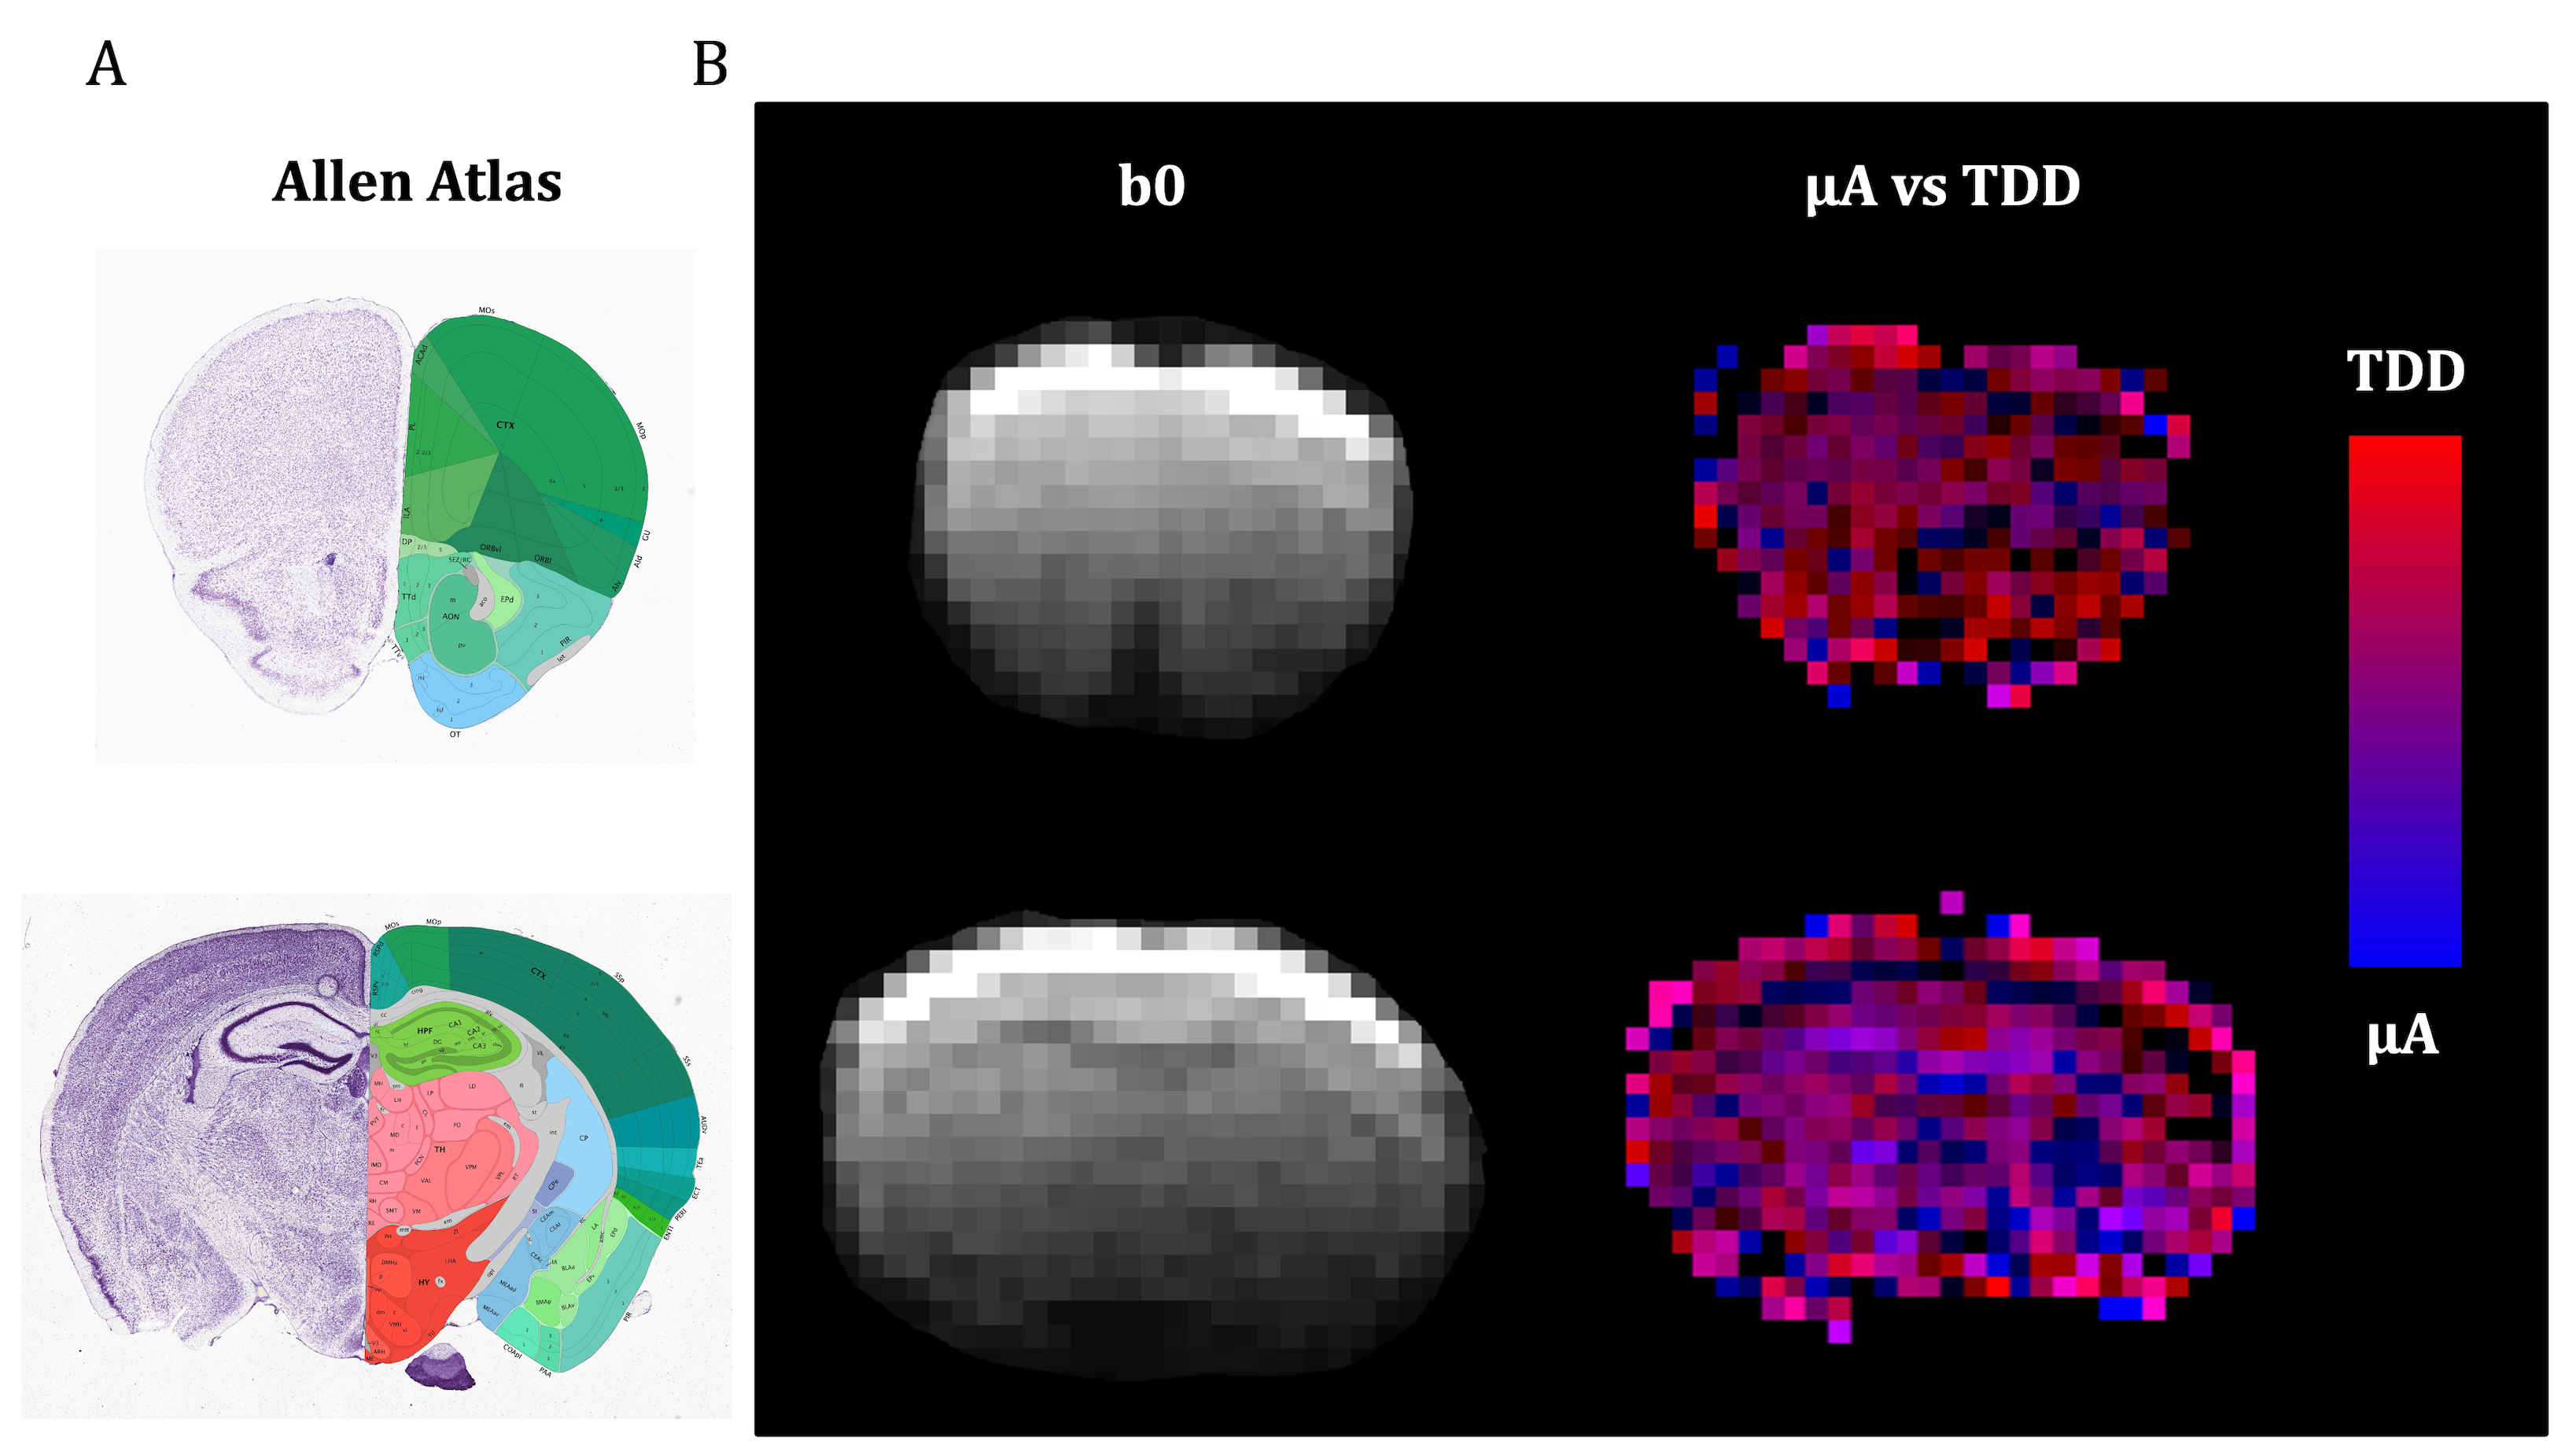
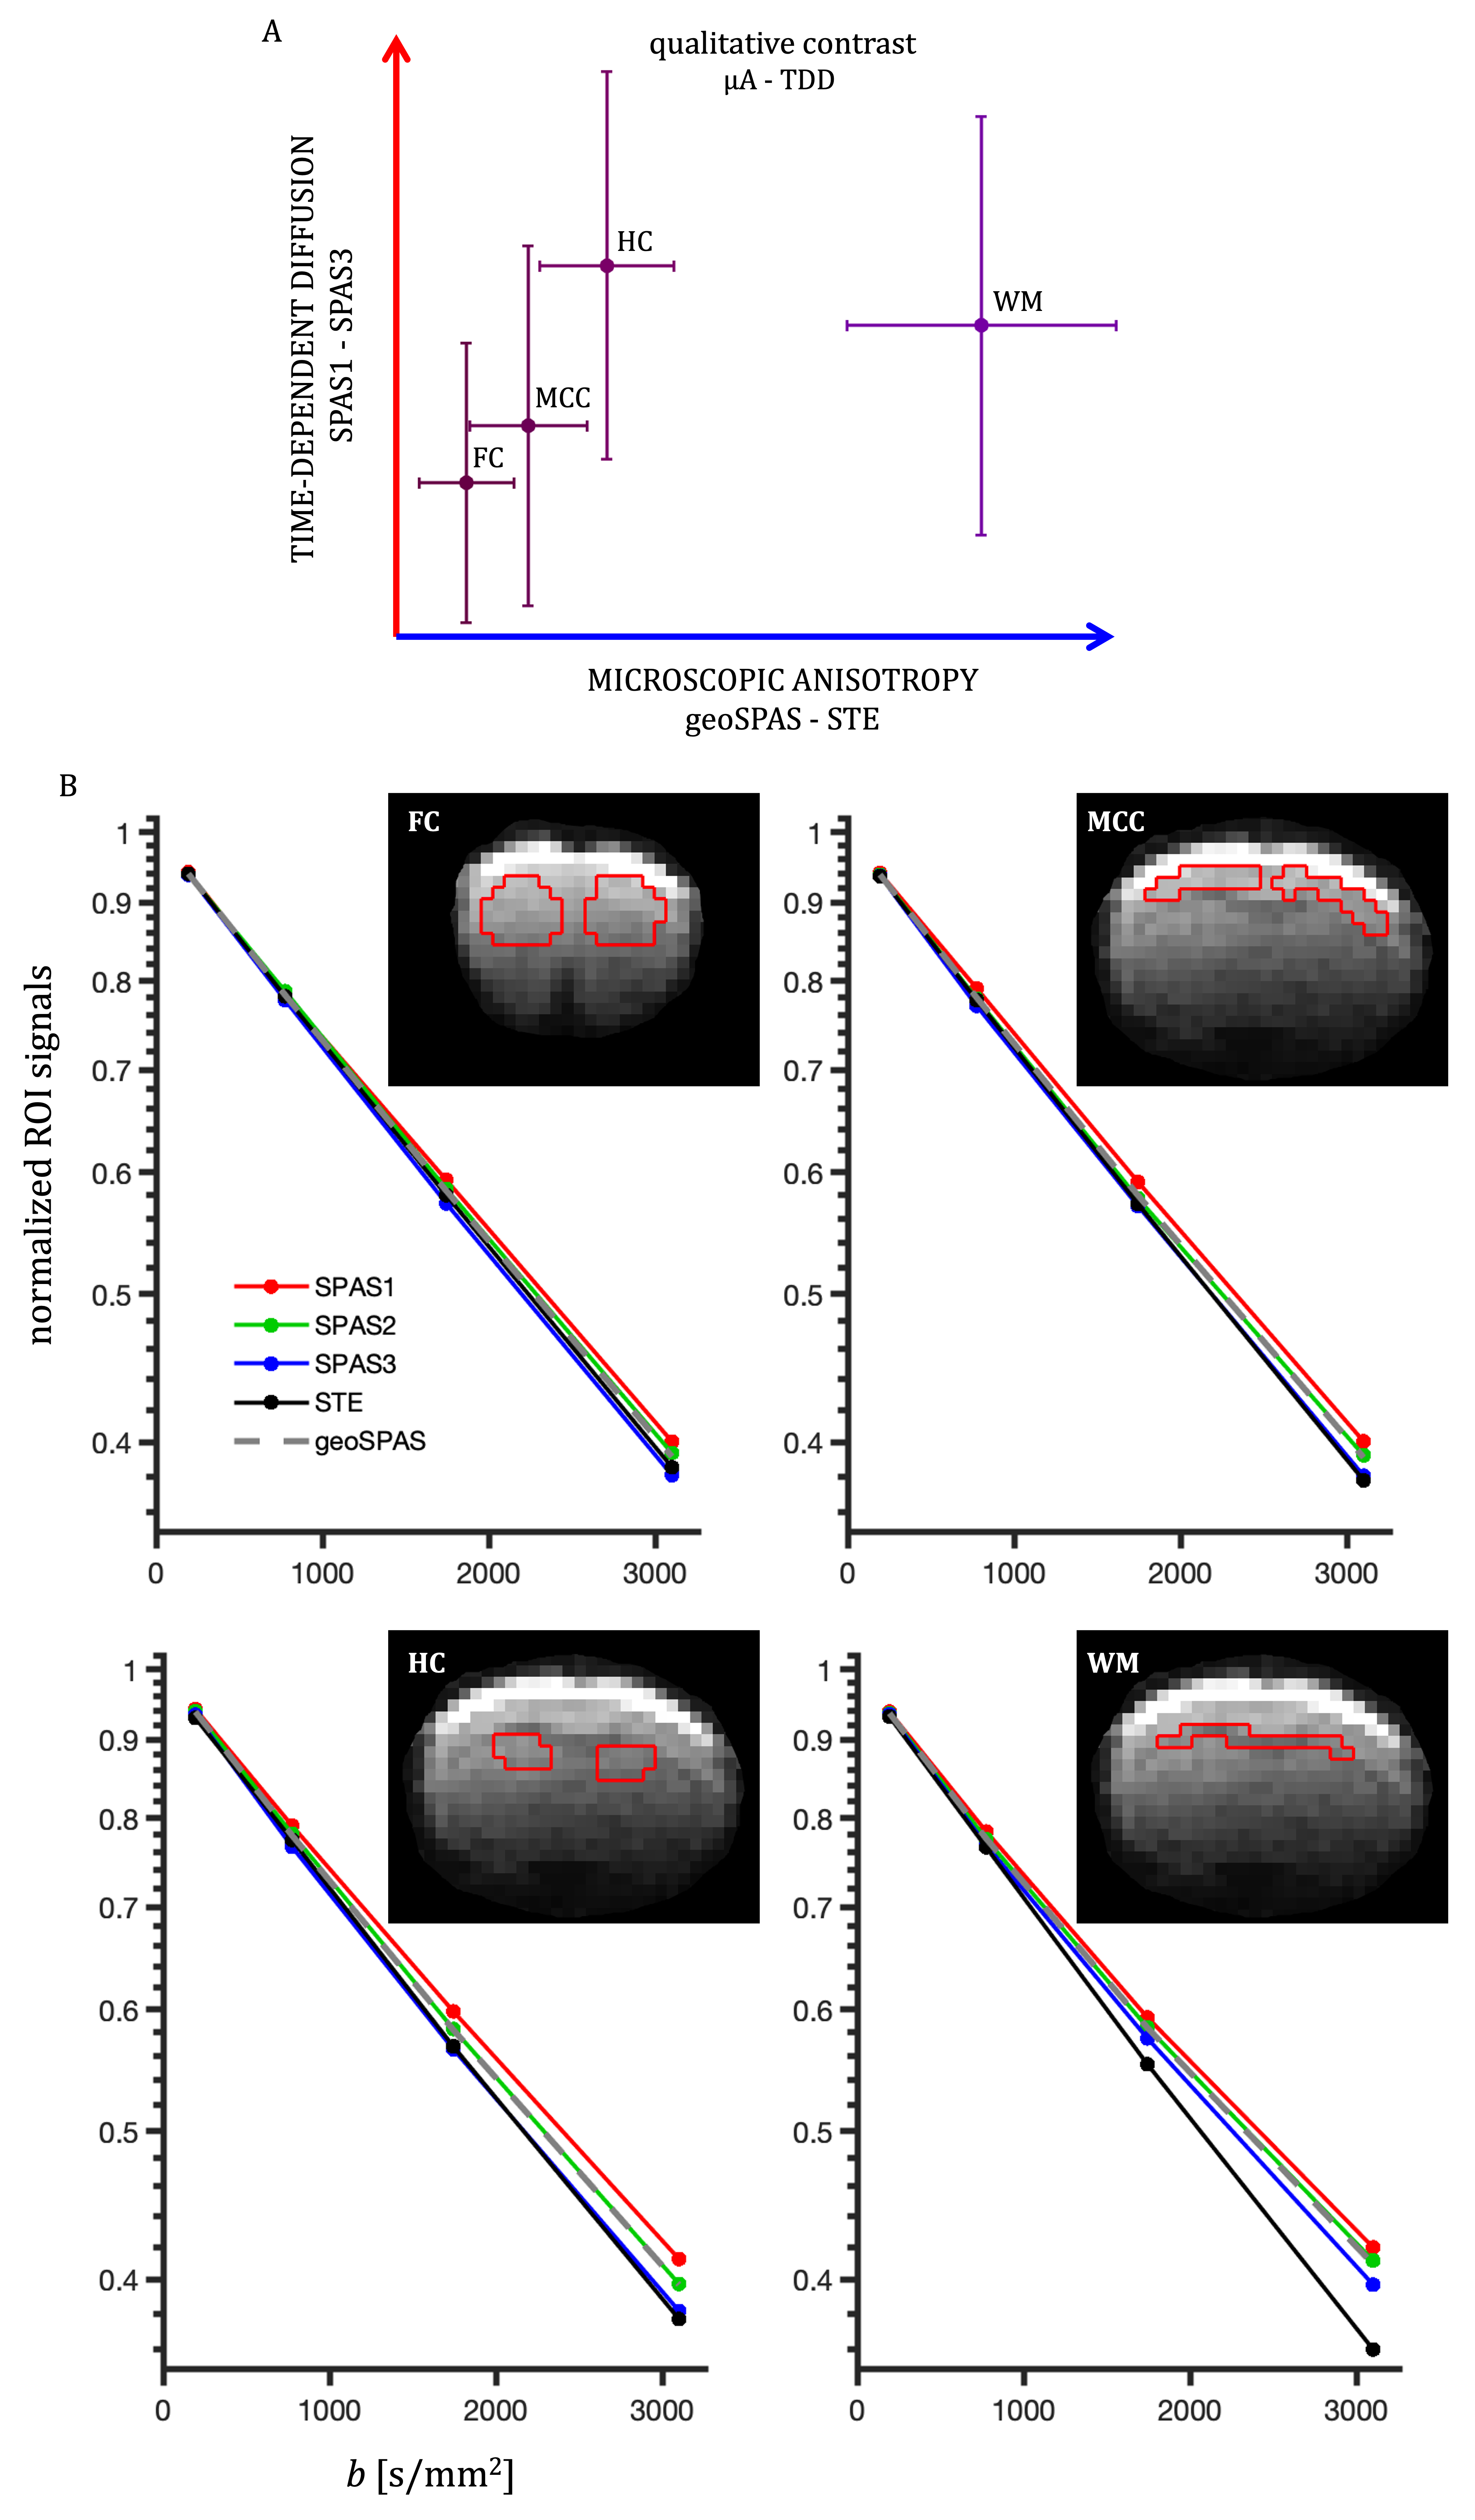
Two independent contrasts (signal differences), µA (geoSPAS - STE) and TDD (SPAS1 - SPAS3) were predicted by calculations for cylinder powders. Signal attenuations for 5.5 µm diameter are shown in Fig. 2A and the signal differences at b = 3100 s/mm2 are shown in Fig. 2B for a range of sizes. While the µA sensitivity monotonically decreases with size, TDD sensitivity peaks at 2R ≈ 7.4 µm, and the two sensitivities are similar at 2R ≈ 5.5 µm.Both contrasts were comparable and significant in the mouse brain. Color-coded maps (Fig 3) reflect relative amounts of µA (blue) and TDD (red) signal differences. The µA contrast is pronounced in the white matter while TDD contrast is particularly visible in the hippocampus. Cf. Allen Mouse Brain Atlas in Fig. 3A. The µA - TDD (blue-red) contrast with mean and standard deviations from different ROIs is shown in Fig. 4A and the normalized ROI-average signals are shown in Fig. 4B. All measured attenuations qualitatively agree with theoretical predictions, signals decreasing from SPAS1, 2, 3 to STE. Both TDD and µA are low in the frontal and mid-coronal cortex. µA is largest in the white matter and TDD in the hippocampus. Elevated TDD in the hippocampus was also observed with oscillating gradients28. Reduced TDD was previously observed in the corresponding regions of the monkey brain, likely due to lower soma density17. Unfortunately, the cerebellum, which is also known for strong TDD17,28, was outside our imaging range.
The present results will be further improved with a better positioning and fixation of the mouse head allowing more encoding directions and diffusion tensor imaging. These developments should benefit more specific assessment of microstructural changes occurring in inflammatory processes in rodent models of multiple sclerosis and Parkinson’s disease paving the way to an enhanced characterization of these diseases in humans.
Conclusion
We have demonstrated the feasibility of direct and independent contrasts due to µA and TDD in the mouse brain in vivo with STE and the associated SPAS-LTE. Both effects can be reliably detected and their correlation in different brain regions, associated with varying cell shape and size, could be useful for tissue microstructure characterization. Further experiments with optimized protocol will be applied in healthy and diseased animals.Acknowledgements
This project was funded by the European Research Council (ERC) under the European Union’s Horizon 2020 research and innovation programme (grant agreement No 804746).References
1. Lasič, S., Szczepankiewicz, F., Eriksson, S., Nilsson, M. & Topgaard, D. Microanisotropy imaging: quantification of microscopic diffusion anisotropy and orientational order parameter by diffusion MRI with magic-angle spinning of the q-vector. Front. Phys. 2, 1–14 (2014).2. Szczepankiewicz, F. et al. Quantification of microscopic diffusion anisotropy disentangles effects of orientation dispersion from microstructure: applications in healthy volunteers and in brain tumors. Neuroimage 104, 241–52 (2015).
3. Westin, C.-F. et al. Q-space trajectory imaging for multidimensional diffusion MRI of the human brain. Neuroimage 135, 345–362 (2016).
4. Szczepankiewicz, F. et al. The link between diffusion MRI and tumor heterogeneity: Mapping cell eccentricity and density by diffusional variance decomposition (DIVIDE). Neuroimage 142, 522–532 (2016).
5. Topgaard, D. Multidimensional diffusion MRI. J. Magn. Reson. 275, 98–113 (2017).
6. Topgaard, D. NMR methods for studying microscopic diffusion anisotropy. in Diffusion NMR of confined systems: fluid transport in porous solids and heterogeneous materials, New Developments in NMR no. 9 (ed. Valiullin, R.) (Royal Society of Chemistry, 2017).
7. Topgaard, D. Diffusion tensor distribution imaging. NMR Biomed. 32, 1–12 (2019).
8. Nilsson, M. et al. Tensor-valued diffusion MRI in under 3 minutes: an initial survey of microscopic anisotropy and tissue heterogeneity in intracranial tumors. Magn. Reson. Med. 83, 608–620 (2020).
9. de Almeida Martins, J. P. et al. Computing and visualising intra-voxel orientation-specific relaxation–diffusion features in the human brain. Hum. Brain Mapp. 1–19 (2020). doi:10.1002/hbm.25224
10. Jespersen, S. N., Lundell, H., Sønderby, C. K. & Dyrby, T. B. Orientationally invariant metrics of apparent compartment eccentricity from double pulsed field gradient diffusion experiments. NMR Biomed. 26, 1647–1662 (2013).
11. Woessner, D. E. N.M.R. spin-echo self-diffusion measurements on fluids undergoing restricted diffusion. J. Phys. Chem. 67, 1365–1367 (1963).
12. Stejskal, E. O. & Tanner, J. E. Spin Diffusion Measurements: Spin Echoes in the Presence of a Time-Dependent Field Gradient. J. Chem. Phys. 42, 288 (1965).
13. Latour, L. L., Svoboda, K., Mitra, P. P. & Sotak, C. H. Time-dependent diffusion of water in a biological model system. Proc. Natl. Acad. Sci. U. S. A. 91, 1229–1233 (1994).
14. Stepišnik, J. Time-dependent self-diffusion by NMR spin-echo. Phys. B 183, 343–350 (1993).
15. Parsons, E. C., Does, M. D. & Gore, J. C. Modified oscillating gradient pulses for direct sampling of the diffusion spectrum suitable for imaging sequences. Magn. Reson. Imaging 21, 279–285 (2003).
16. Lundell, H., Sønderby, C. K. & Dyrby, T. B. Diffusion weighted imaging with circularly polarized oscillating gradients. Magn. Reson. Med. 73, 1171–1176 (2015).
17. Lundell, H. et al. Multidimensional diffusion MRI with spectrally modulated gradients reveals unprecedented microstructural detail. Sci. Rep. 9, 1–12 (2019).
18. Lundell, H. & Lasič, S. Diffusion Encoding with General Gradient Waveforms. in Advanced Diffusion Encoding Methods in MRI: New Developments in NMR Volume 24 (ed. Topgaard, D.) 12–67 (Royal Society of Chemistry, 2020). doi:10.1039/9781788019910-00012
19. Lasič, S., Lundell, H. & Topgaard, D. The tuned trinity of b-tensors. in Proc. Intl. Soc. Mag. Reson. Med. 27 3490 (2019).
20. Lasic, S. et al. Time-dependent and anisotropic diffusion in the heart: linear and spherical tensor encoding with varying degree of motion compensation. in Proc. 28th Intl. Soc. Magn. Reson. Med. 4300 (2020).
21. Lasic, S. et al. Time-dependent anisotropic diffusion in the mouse heart: feasibility of motion compensated tensor-valued encoding on a 7T preclinical scanner. in Proc. 29th Intl. Soc. Magn. Reson. Med. 3651 (2021).
22. De Swiet, T. M. & Mitra, P. P. Possible Systematic Errors in Single-Shot Measurements of the Trace of the Diffusion Tensor. J. Magn. Reson. Ser. B 111, 15–22 (1996).
23. Jespersen, S. N., Olesen, J. L., Ianuş, A. & Shemesh, N. Effects of nongaussian diffusion on “isotropic diffusion” measurements: An ex-vivo microimaging and simulation study. J. Magn. Reson. 300, 84–94 (2019).
24. Lasic, S., Szczepankiewicz, F., Nilsson, M., Dyrby, T. B. & Lundell, H. The spectral tilt plot (STP) – new microstructure signatures from spectrally anisotropic b-tensor encoding. in Proc. Intl. Soc. Magn. Reson. Med. 29 0297 (2021). doi:10.1002/mrm.27959
25. Lasic, S., Just, N. & Lundell, H. Spectral principal axes system (SPAS) and tuning of tensor-valued encoding for time-dependent anisotropic diffusion. in Proc. Intl. Soc. Magn. Reson. Med. 30 2509 (2022).
26. Sjölund, J. et al. Constrained optimization of gradient waveforms for generalized diffusion encoding. J. Magn. Reson. 261, 157–168 (2015).
27. Szczepankiewicz, F. & Sjölund, J. Cross-term-compensated gradient waveform design for tensor-valued diffusion MRI. J. Magn. Reson. 328, 106991 (2021).
28. Aggarwal, M., Jones, M. V, Calabresi, P. a, Mori, S. & Zhang, J. Probing mouse brain microstructure using oscillating gradient diffusion MRI. Magn. Reson. Med. 67, 98–109 (2012).
Figures