5018
Improving in vivo MR g-ratio mapping via calibration of linearly transformed MR markers from in situ to ex vivo1Department of Systems Neurosciences, University Medical Center Hamburg-Eppendorf, Hamburg, Germany, 2Department of Systems Neurosciences,, University Medical Center Hamburg-Eppendorf, Hamburg, Germany, 3Department of Neurophysics,, Max Planck Institute for Human Cognitive and Brain Sciences, Leipzig, Germany, 4Paul Flechsig Institute of Brain Research, University of Leipzig, Leipzig, Germany, 5Department of Neurophysics, Max Planck Institute for Human Cognitive and Brain Sciences, Leipzig, Germany, 6Faculty of Physics and Earth Sciences, Felix Bloch Institute for Solid State Physics, Leipzig, Germany
Synopsis
Keywords: Diffusion/other diffusion imaging techniques, Diffusion/other diffusion imaging techniques, G-ratio
In vivo MR g-ratio mapping relies on a calibrated method that relates myelin and axon MR markers to volume fractions. To estimate the calibration parameter, fixed ex vivo tissue measured with MRI and histology is used. The so-determined calibration parameter is then applied in vivo, neglecting the difference in the MR markers due to fixation. Here, we proposed a new calibration method accounting for this difference. The new calibration reduced the variability across MR g-ratios based on different myelin and axon markers, indicating that it can improve the accuracy of MR g-ratios.Introduction
The g-ratio, which is the ratio between the inner and outer radius of a myelinated axon, is sensitive to the neuronal conduction velocity in the white matter. A few years ago, a model was proposed to map the g-ratio with MRI, denoted here as MR g-ratio2. This method relates the MR g-ratio to axonal and myelin volume fractions, AVF and MVF, which can be estimated from MR markers via a calibration step. This calibration is typically a single-point calibration3 (α) that linearly transforms the measured myelin MR markers (M) into MVF, e.g. MVF: αM. The standard approach (“standard”) to estimate the calibration parameter compares MRI and histology (e.g. electron microscopy) measurements of a fixed ex vivo brain specimen. Then, the estimated calibration parameter is applied to in vivo MR markers to estimate the in vivo MR g-ratio2,4.However, this neglects the changes of MR parameters from in vivo to fixed ex vivo tissue. One prominent change would be the effect of fixation5,6. We hypothesize that fixation induced change of MR parameters introduce a bias to the in vivo MR g-ratio. This has to be accounted for when calibrating the in vivo myelin and axon markers for in vivo MR g-ratio. We propose a method (“new”) that allows to correct for this potential bias by introducing a linear transformation between fixed and unfixed MR parameters. We test the new calibration method on in-situ MR g-ratios and compare it to the standard calibration approach.Methods
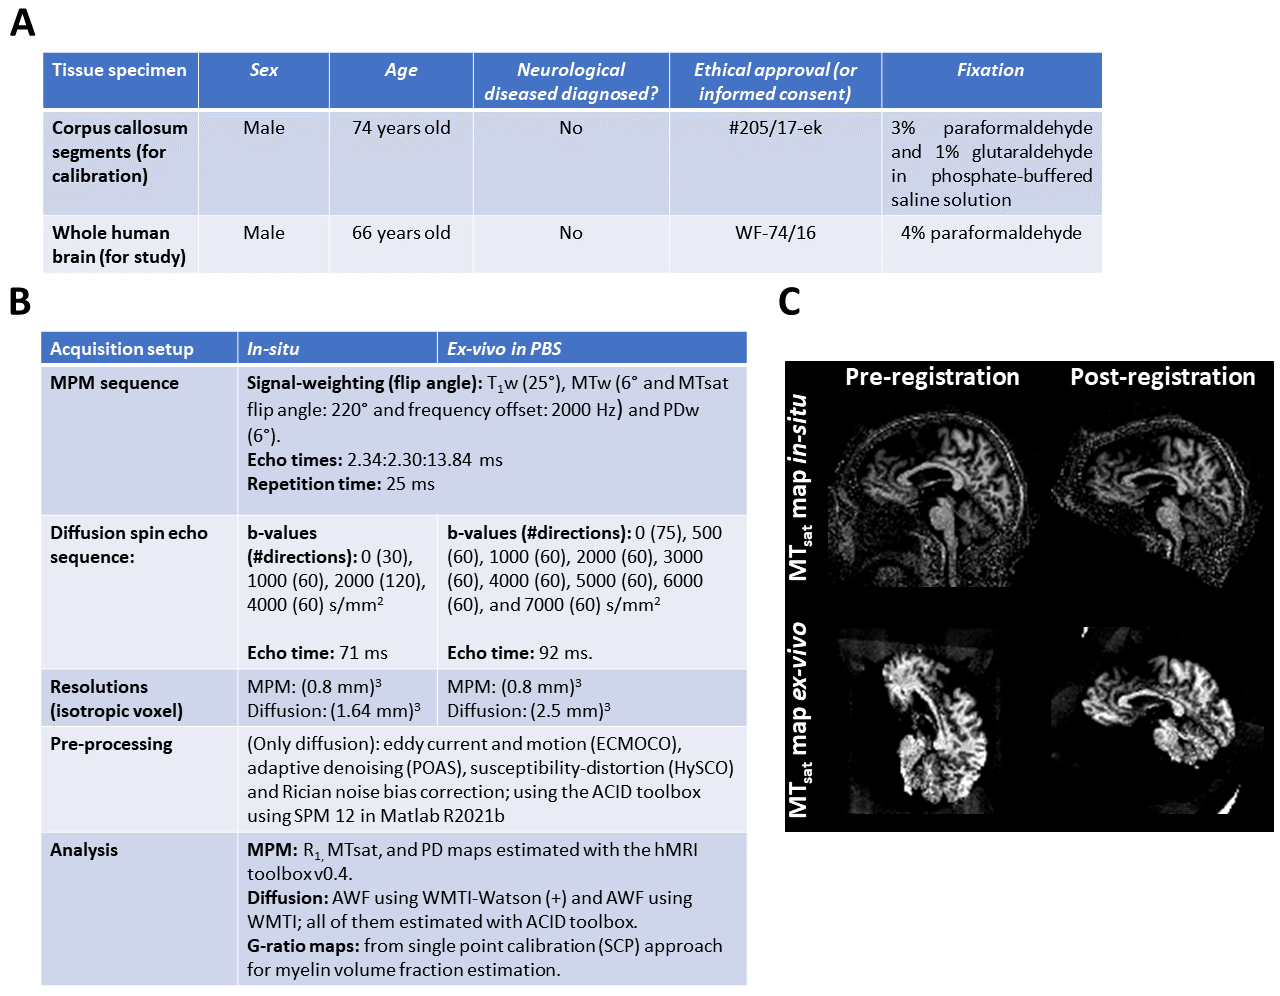
Ex vivo tissue specimen: Three human corpus callosum segments (Figure 1A) were measured with MRI and subsequently with electron microscopy. Four regions of interest within the segments were used for calibration between MRI and histology, based on previous work7.Post mortem brain: One post mortem human brain (Figure 1A) was measured with MRI scan before autopsy (in situ) and a subsequent measurement was performed after fixation for 156 days and hydration in phosphate-buffered saline (PBS).
MR acquisition: Multi-parametric mapping (MPM8) and diffusion-weighted MRI acquisitions were performed on the ex vivo brain specimen on a 3T PRISMA fit MRI (Siemens Healthcare, Erlangen, Germany) with a Siemens 32-channel receiver head-coil. To achieve higher b-values for the ex vivo (PBS) measurement in a clinical scanner, the echo time had to be increased in comparison to the in-situ measurement. Detailed information about sequence parameters can be found in Figure 1A.
Pre-processing and analysis: All MRI data acquired were analyzed as specified in Figure 1A. After analysis, both in-situ and ex vivo diffusion and relaxometry maps were longitudinally-coregistered (Figure 1B) using a previous reported pipeline9. Segmentations for gray (GM) and white (WM) were estimated.
Calibration methods: (1) In the standard method, we applied the calibration parameters directly onto the in-situ myelin markers (MTsat and PD); and (2) in the newly proposed method, we determined a linear transformation for MTsat and PD from in-situ to PBS and only then apply the calibration parameters.
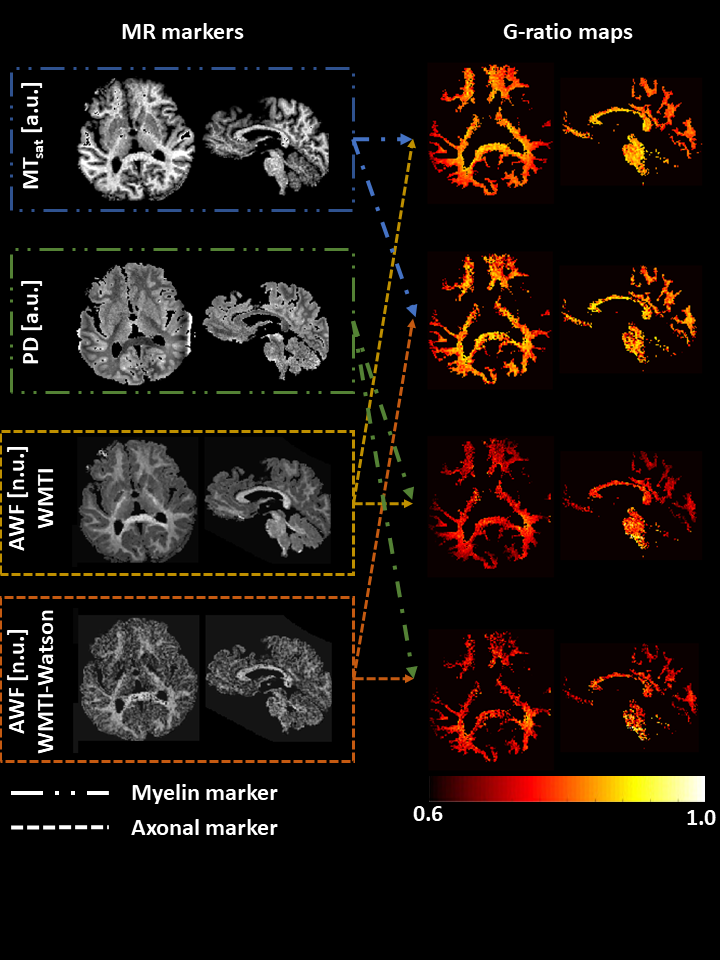
G-ratios: Four g-ratio maps were obtained based on the combination of the myelin and axon MR markers (Figure 2) using the standard and new calibration methods.
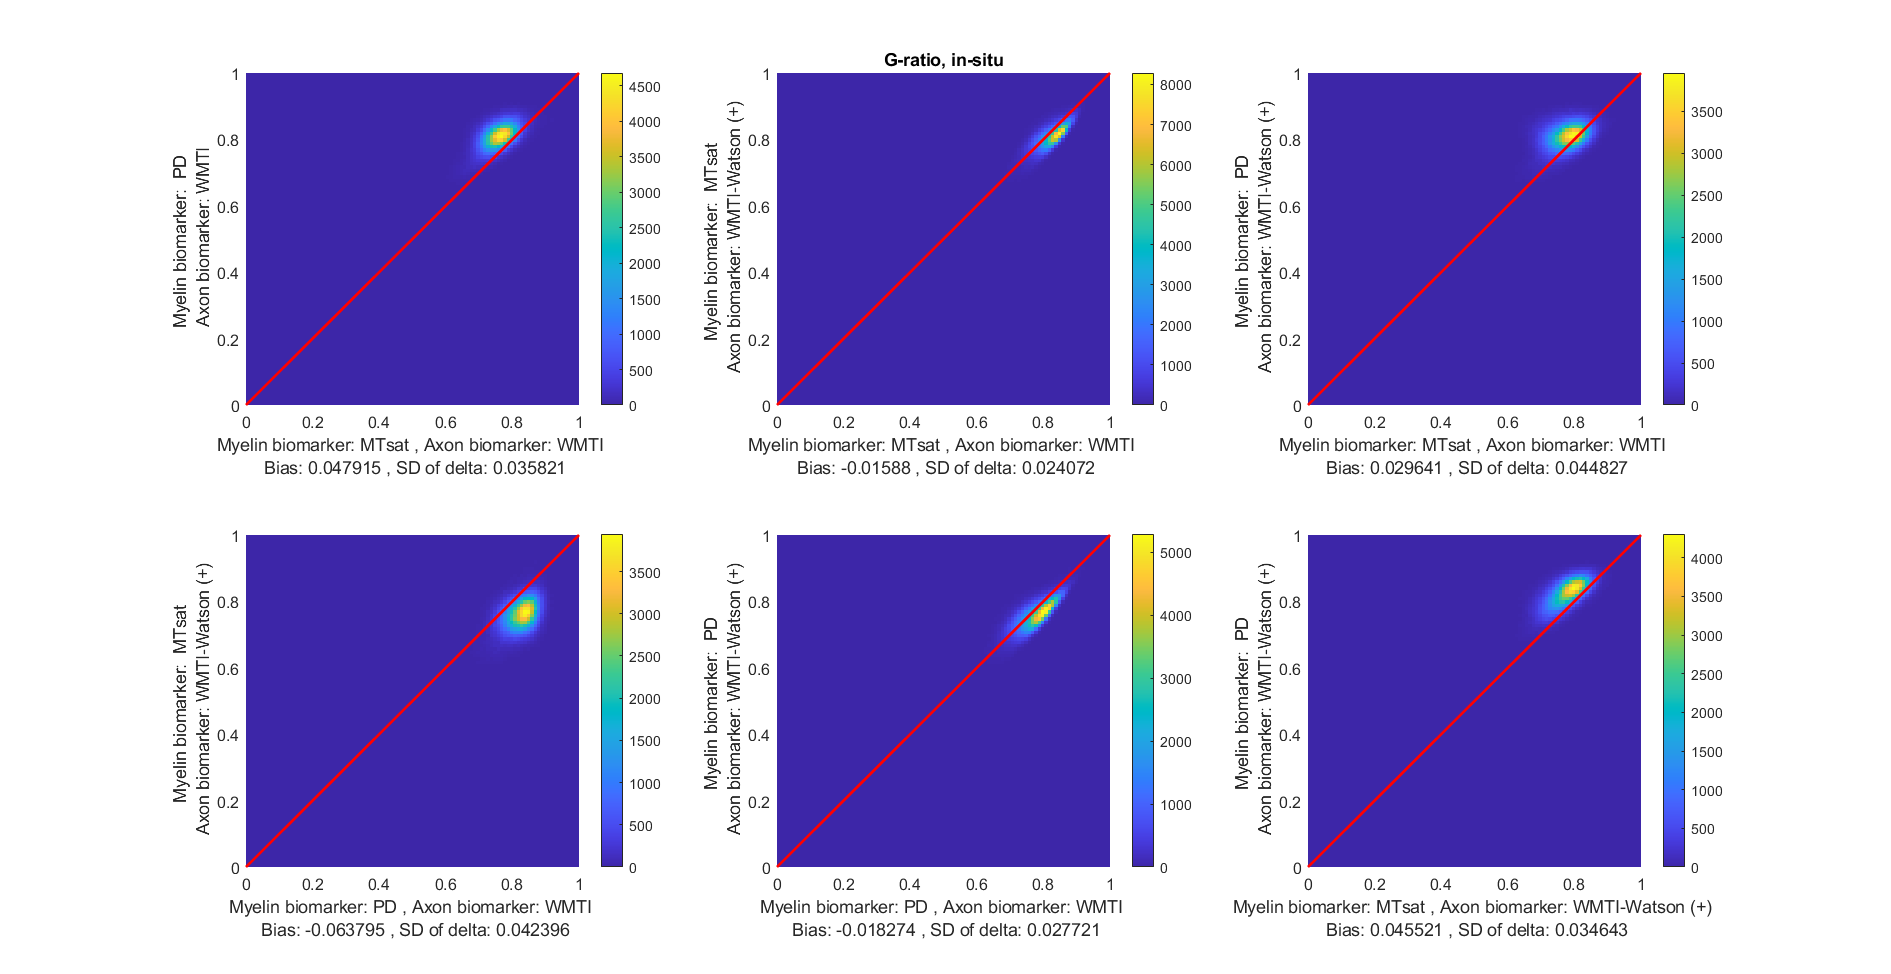
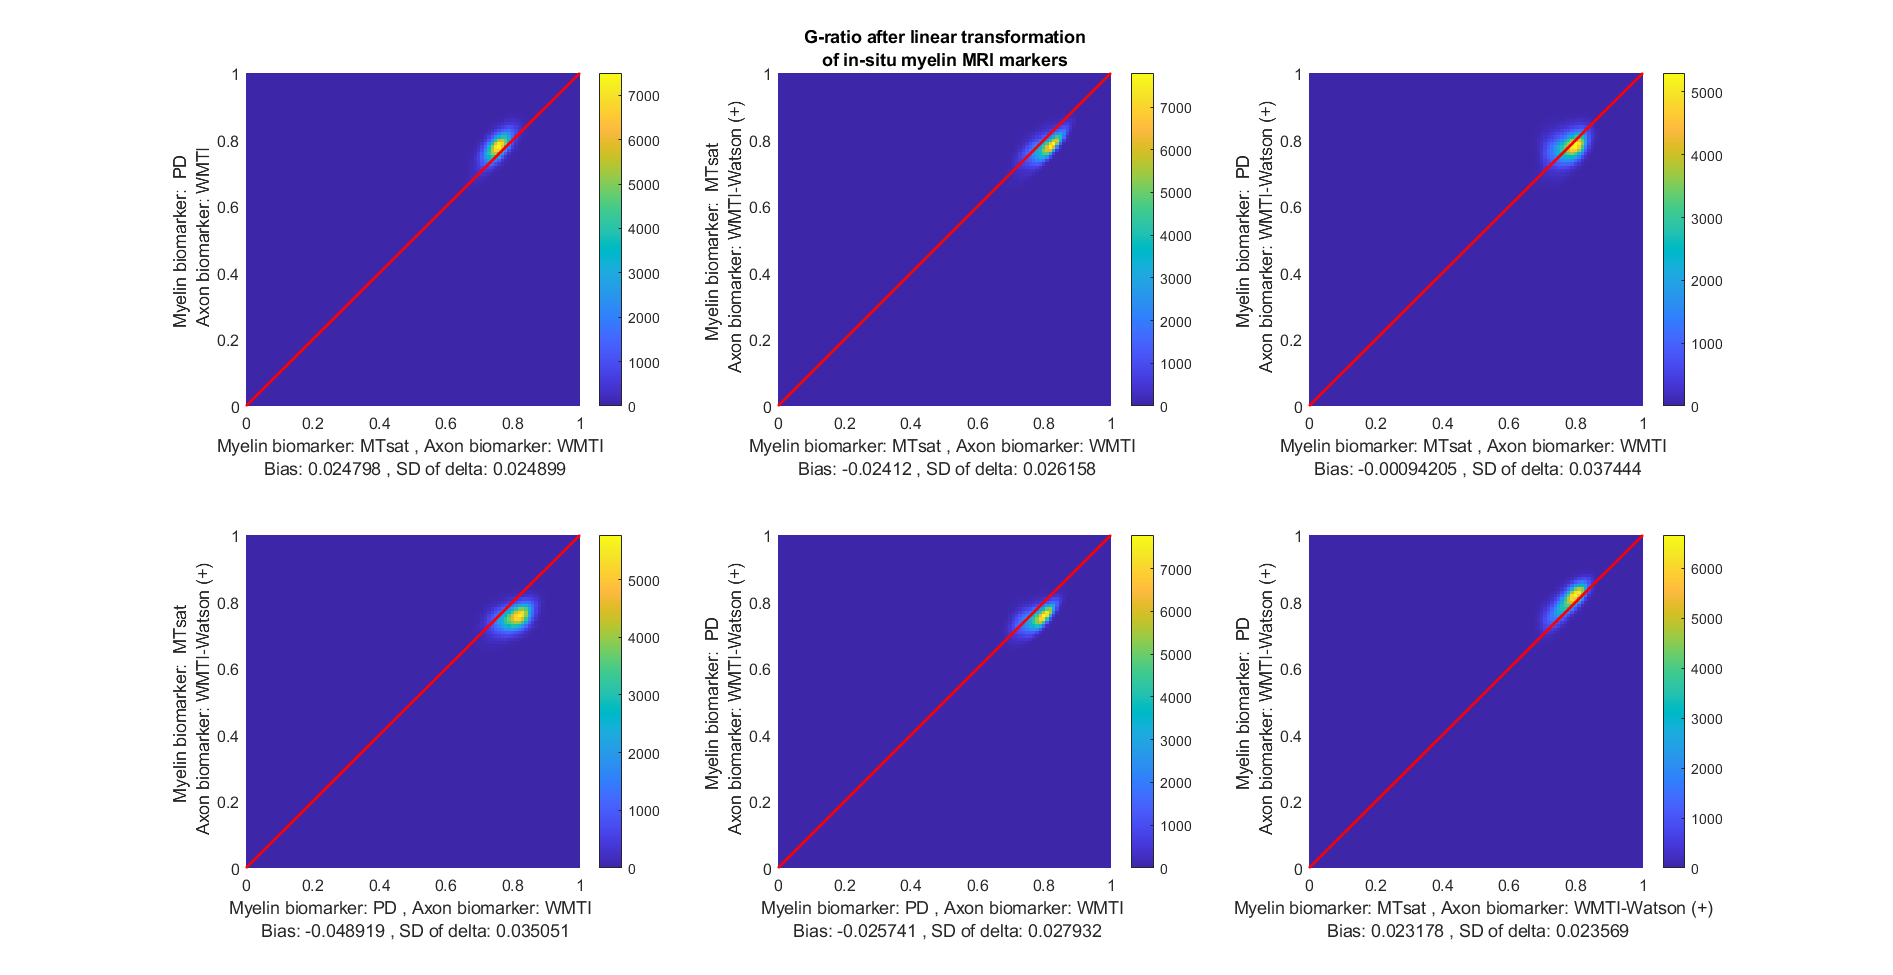
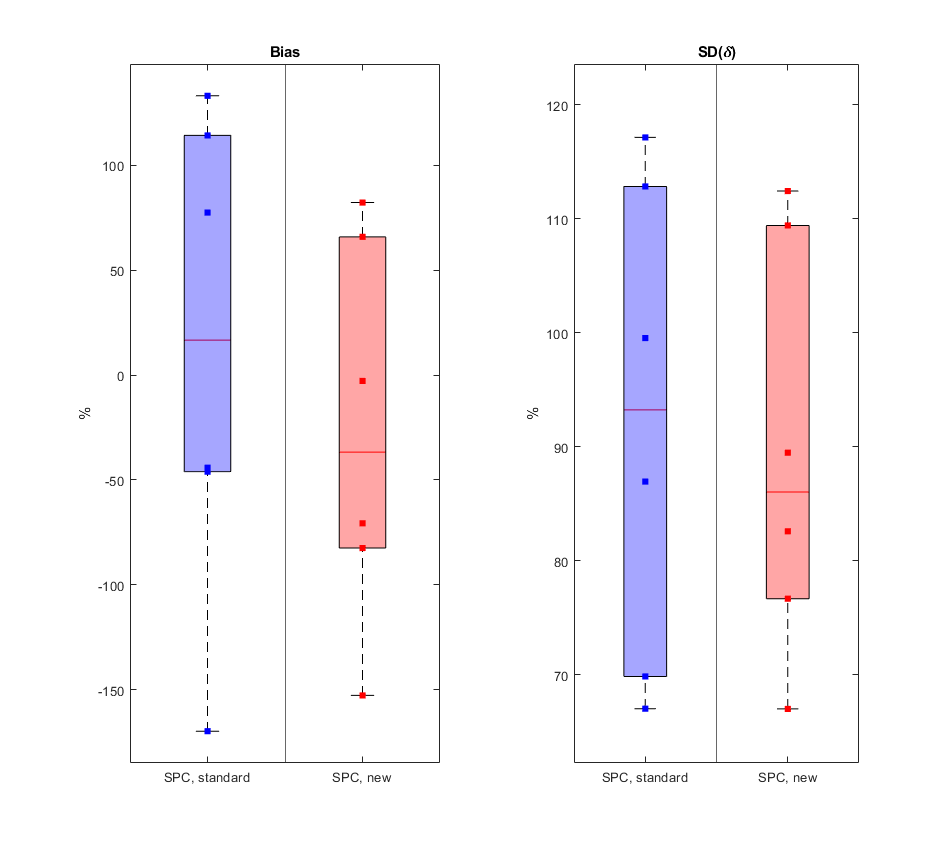
Bland-Altman analysis: Since we had no gold standard g-ratio for the in-situ data for direct comparison, the similarity between different MR g-ratio methods was used as a criterion of performance. We used the Bland-Altman metrics11 between all pairs of g-ratios: 𝛿 = gMRI,A1,M1- gMRI,A2,M2, where A1,2 and M1,2 are the MRI based myelin and axonal markers depicted in Figure 2. The summary in Figure 5 shows the measured Bias = mean(𝛿), and standard deviation (SD) of 𝛿, = sd(𝛿), relative to the standard deviation of both methods (“dynamic range” DR), i.e., plotted is the quantity (Bias/DR)* 100 with DR = 1/2 * (std(gMRI,A1,M1) + std(gMRI,A2,M2)) also denoted as relative Bias and relative SD. In total, six relative measures of Bias and SD based on Bland-Atman comparisons of non-repeating pairs of the four aforementioned MR g-ratios were determined. This analysis intends to show that the better calibration method should produce more accurate MR g-ratios and thus be independent of the myelin-axon markers combination used for MR g-ratio calculation.
Results
Figures 3 and 4 show the scatter-plots comparing all six non-repeating combinations of the MR g-ratios (Figure 2) using the standard calibration (Figure 3) and the new calibration (Figure 4). The shape and center of the data cloud moves closer to the line of unity (red line) when using the new calibration. Figure 5 summarizes the similarity between MR g-ratios using the standard and new calibrations.The new calibration increased the relative bias (mean(𝛿)) from 16.5% to -36.5% but reduced the across-MR-g-ratio variability, and decreased the relative SD(𝛿) from 93.2% to 86%.Discussion
Our findings showed that the new calibration method reduced the variability across MR g-ratios that were estimated with different myelin and axon markers, indicating that it can improve the accuracy of MR g-ratios. However, it came at the cost of an increased bias. Moreover, we observed that the measure of similarity varied strongly between pairs of MR g-ratios. To better assess the performance of the calibration methods, future studies could compare a larger number of MR g-ratios to reduce this variability.Acknowledgements
This work was supported by the German Research Foundation (DFG Priority Program 2041 "Computational Connectomics”, [MO 2397/5-1; MO 2397/5-2], by the Emmy Noether Stipend: MO 2397/4-1; MO 2397/4-2) and by the BMBF (01EW1711A and B) in the framework of ERA-NET NEURON and the Forschungszentrums Medizintechnik Hamburg (fmthh; grant 01fmthh2017).References
1: West K. et al. Myelin volume fraction imaging with MRI. NeuroImage, 2018;182:511-521. doi: 10.1016/j.neuroimage.2016.12.067
2: Stikov, N. et al. In vivo histology of the myelin g-ratio with magnetic resonance imaging. NeuroImage, 2015; 118: 397–405. doi:10.1016/j.neuroimage.2015.05.023
3: Mohammadi, S., & Callaghan, M. F. Towards in vivo g-ratio mapping using MRI: Unifying myelin and diffusion imaging. Journal of Neuroscience Methods, 2021; 348: 108990. doi:10.1016/j.jneumeth.2020.108990.
4: Emmenegger, T.M. et al. The Influence of Radio-Frequency Transmit Field Inhomogeneities on the Accuracy of G-ratio Weighted Imaging. Frontiers in Neuroscience 2021; 15:770. doi:10.3389/fnins.2021.674719
5: Shatil, A.S. et al. Quantitative Ex Vivo MRI Changes due to Progressive Formalin Fixation in Whole Human Brain Specimens: Longitudinal Characterization of Diffusion, Relaxometry, and Myelin Water Fraction Measurements at 3T. Front. Med. 2018; 5:31. doi: 10.3389/fmed.2018.00031
6: Birkl, C., et al. Effects of formalin fixation and temperature on MR relaxation times in the human brain. NMR in Biomedicine 2016; 29:458–465. doi:10.1002/nbm.3477
7: Ashtarayeh, B. et al. Improving g-ratio mapping by a principled 3-point calibration, in: Proc. Org. Hum. Bra. Map. 27. 2021.
8: Weiskopf, N. et al. Quantitative multi-parameter mapping of R1, PD(*), MT, and R2(*) at 3T: a multi-center validation. Front Neurosci 2013; 7:95.
9: Streubel, T. et al. Quantification of tissue shrinkage due to formalin fixation of entire post-mortem human brain, in: Proc. Intl. Soc. Mag. Reson. Med. 28. 2019.
10: Fricke, B. et al. ACID - an open-source, bids compatible software for brain and spinal cord dMRI: preprocessing, DTI/DKI, biophysical modelling, in: Proc. Intl. Soc. Mag. Reson. Med. 30. 2022.
11: Bland, J. M., and Altman, D. G. (1986). Statistical methods for assessing agreement between two methods of clinical measurement. Lancet 1, 307–310. doi: 10.1128/AAC.00483-18
Figures