5015
Assessing the variability of brain diffusion MRI preprocessing pipelines using a Region-of-Interest analysis1Center for Biomedical Imaging, Dept. Radiology, NYU Grossman School of Medicine, New York, NY, United States, 2BioMedIA Group, Department of Computing, Imperial College London, London, United Kingdom, 3Division of Anaesthesia, Department of Medicine, University of Cambridge, Cambridge, United Kingdom, 4CUBRIC, Cardiff University, Cardiff, United Kingdom, 5ETSI Telecomunicación, Universidad de Valladolid, Valladolid, Spain, 6Department of Systems Neuroscience, University Medical Center Hamburg-Eppendorf, Hamburg, Germany, 7CRMBM, Aix-Marseille University, Marseille, France, 8Diagnostic Radiology, Lund University, Lund, Sweden, 9Department of Radiology, University of Turku, Turku, Finland, 10TBMC, University of Turku, Turku, Finland, 11Medical Physics Department, University Hospital Southampton NHS Foundation Trust, Southampton, United Kingdom, 12Clinical Neurosciences, Clinical and Experimental Sciences, University of Southampton, Southampton, United Kingdom, 13Sherbrooke Connectivity Imaging Lab (SCIL), Computer Science department, Université de Sherbrooke,, Sherbrooke, QC, Canada
Synopsis
Keywords: Diffusion/other diffusion imaging techniques, Data Processing
The lack of a standardized preprocessing pipeline is a significant source of variability that might lower the reproducibility of studies, especially across sites and with incomplete description of the preprocessing workflows. We evaluate the downstream impact of variability in preprocessing workflow by quantifying the reproducibility and variability of region-of-interest (ROI) analyses. While many pipelines achieve excellent reproducibility in most ROI, we observed a large variability in performance of preprocessing workflows to the extent that some pipelines are detrimental to the data quality and reproducibility.Introduction
The visual and quantitative interpretation of diffusion MR images and derived biomarkers is challenged by various imaging artifacts and thermal noise [1]. Research looking to maximize the sensitivity, specificity, and robustness of their diffusion MR analysis are bound to a multi-step workflow that include image preprocessing. The implementation and integration of methodological advances in publicly available software packages and pipelines keeps improving the accessibility and scalability of complex dMRI preprocessing workflows. However, in the absence of field-accepted standards, the preprocessing pipelines vary substantially across gresearchers [2].The lack of a standardized preprocessing pipeline is a significant source of variability that might lower the reproducibility of studies, especially across sites and with incomplete description of the preprocessing workflows [2,3]. We further hypothesize that the downstream impact of variability in preprocessing workflow depends on the actual post-processing analysis. In this work, we will evaluate the inter-pipeline variability on region-of-interest (ROI) analyses.
A ROI analysis is a widely-adopted strategy for the quantitative and statistical analysis of diffusion metrics. Typically, in an automated workflow, anatomically defined regions have been delineated in a brain atlas or template and image registration is used to align subject-specific dMRI data with such template. Any lack of anatomical fidelity of the dMR images due to unresolved imaging artifacts is likely to lower the accuracy and precision of such ROI analysis.
Methods:
Data acquisition:Multi-shell SE-EPI dMRI data (b=0, 1000, and 2000 s/mm2) was acquired on multiple sites using hardware systems from different vendors (3T GE SIGNA Premier, 3T Connectome Siemens, and 3T Achieva Philips). The data include unprocessed magnitude MRI data sets of 13 subjects. Defacing was applied to a subset of data to comply with institutional regulations. For each subject, three scan sessions (“A”, “B”, and “C”) with distinct settings and instructions related to the motion were acquired to introduce artifacts of varying shapes and sizes while preserving the encoded diffusion information. In addition, the dataset included non-diffusion-weighted images with reversed phase encoding, a T1-weighted MPRAGE, and a field map.
Image preprocessing:
54 research teams processed the individual datasets with their routinely-used preprocessing pipeline. All further processing was performed with identical software and algorithms.
Region-of-interest (ROI) analysis:
The widely-used ICBM DTI-81 JHU atlas was chosen as it provides 48 anatomical regions within the cerebral white matter. Each subject’s FA map was rigidly coregistered to its corresponding MPRAGE scan using mutual information. All subject-specific MPRAGE scans were spatially normalized to the T2-weighted template of the JHU atlas using an affine and deformable transformation, with mutual information as an optimization metric and elastic regularization [5]. The deformable and rigid transformations were combined prior to applying them inversely to the JHU region atlas with nearest neighbor interpolation to project the template ROIs to the native diffusion space to avoid interpolation or manipulation of the diffusion maps; see Figure 1. Finally, for all 48 ROIs, the mean FA was calculated, but results from both hemispheres were averaged, resulting in effectively 27 ROI values per subject and per image preprocessing pipeline.
Statistical analysis:
We evaluated the inter-subject, intra-subject, and inter-pipeline variability and inter-session agreement using the coefficient of variation (CoV) and the intraclass correlation coefficients (ICC), respectively. The ICC(2,1) was calculated for two-way mixed effects, single measurement, with an absolute agreement [6].
Results:
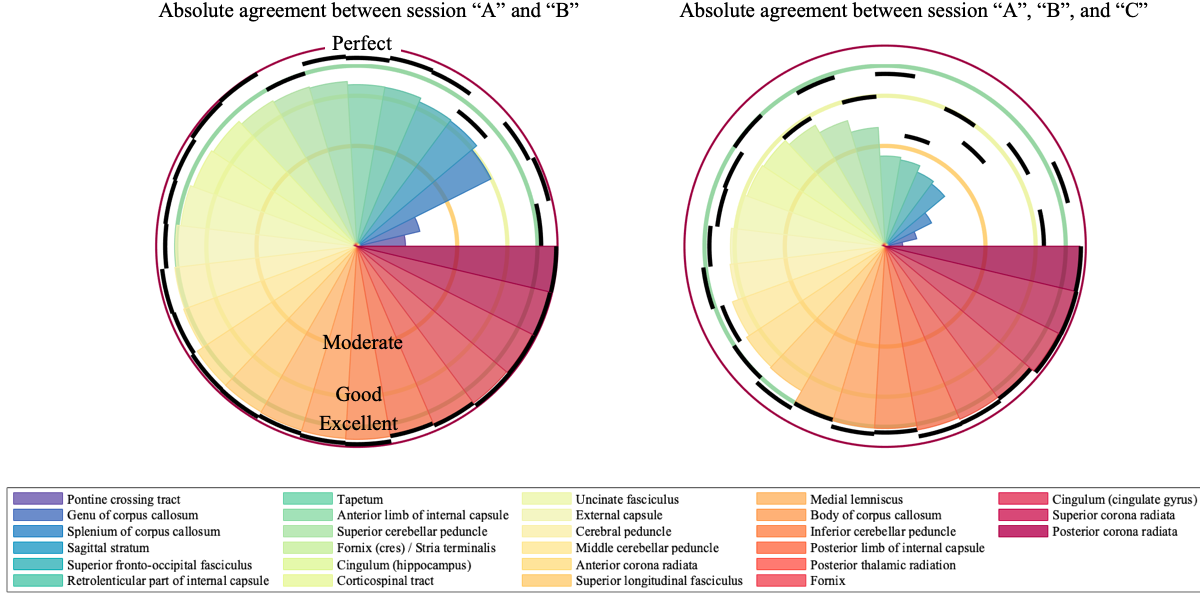
In Figure 2, we show the absolute agreement of ROI-averaged FA across scan sessions per preprocessing pipeline for the Posterior limb of the internal capsule and the genu of corpus callosum. For comparison, the absolute agreement of the unprocessed data is shown as well.In Figure 3, we show the agreement for each ROI with and without preprocessing. The preprocessed value is represented by the 95th percentile of all pipelines. In addition, we show the spatial distribution by color-encoding the atlas label by absolute agreement.
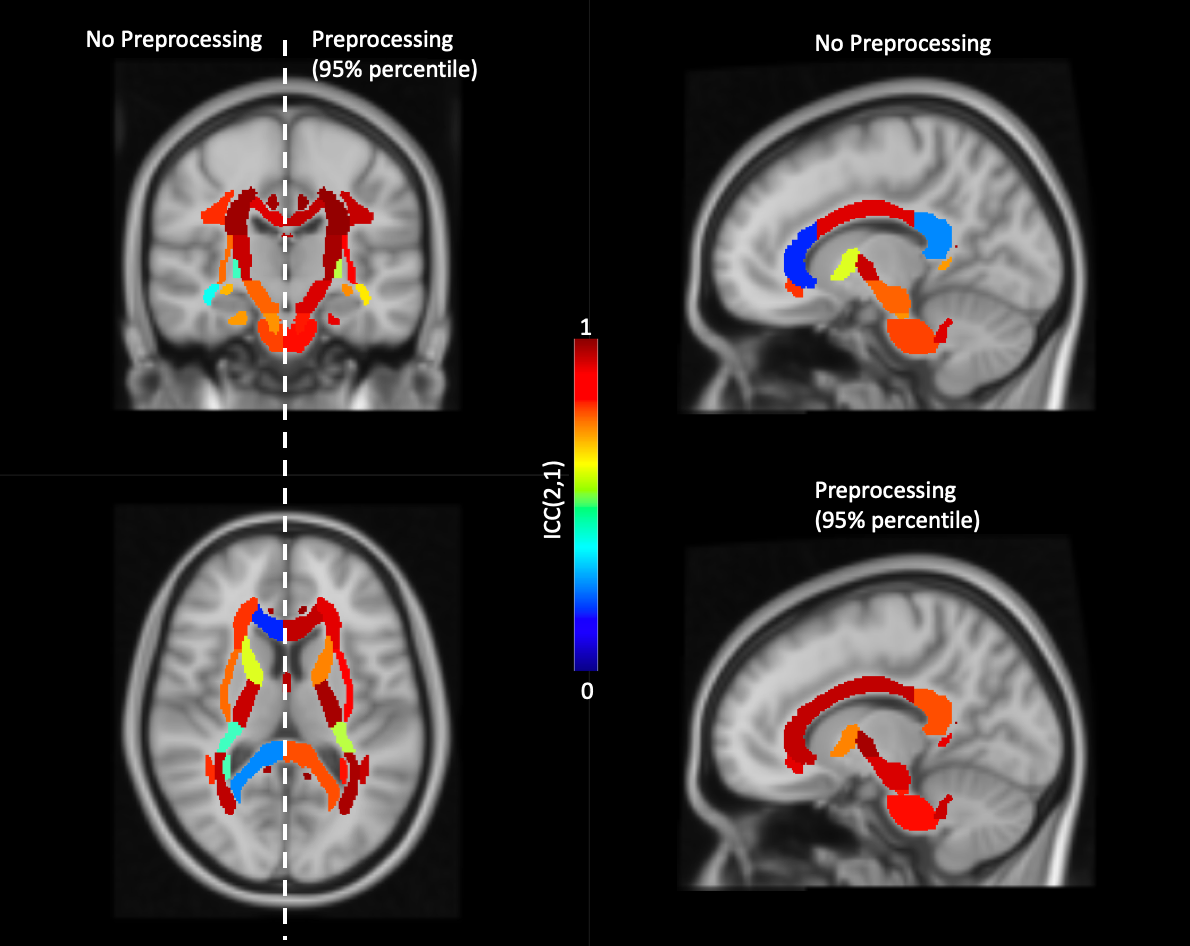
In Figure 4, we visualize the absolute agreement spatially over the ROIs in the standard MNI space.
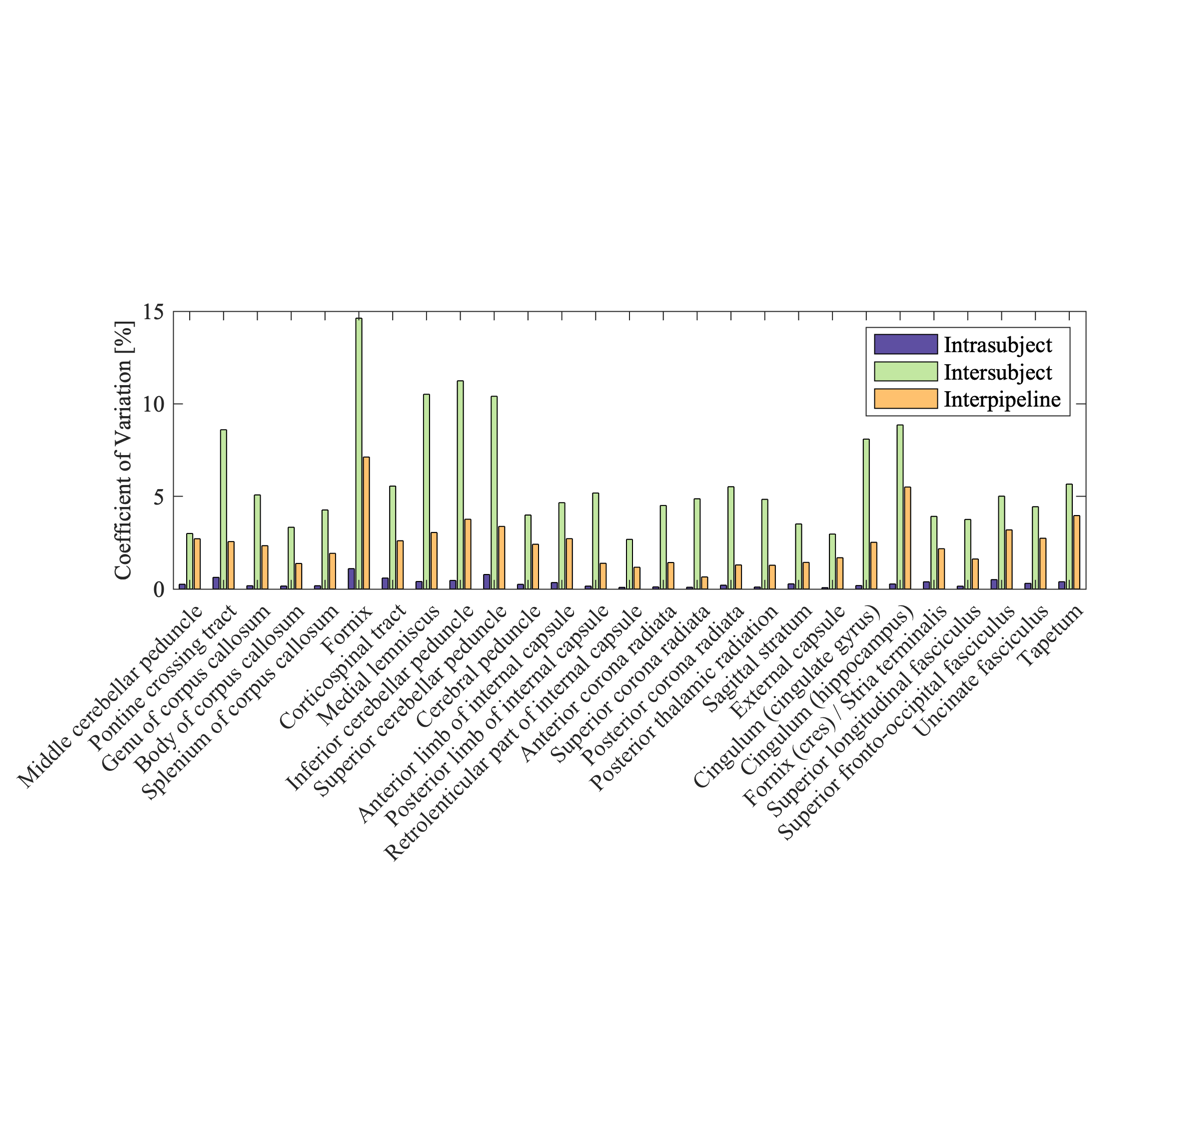
In Figure 5, we show the intra-subject, inter-subject, and inter-pipeline variability for each ROI. The intra-subject and inter-subject variability were derived from preprocessed data. We report the median of the three pipelines that were most often ranked in the top 5% pipelines when comparing absolute agreement per ROI. For the inter-pipeline variability, we used robust proxies of the mean and standard deviation to compute the CoV to avoid biasing the results by outliers that could easily have been detected using quality assessment of the data.
Discussion
Our results demonstrate that image preprocessing is a critical step in the diffusion MRI workflow that typically improves data reliability and reproducibility of ROI analyses. The impact of the image preprocessing pipeline strongly depends on the spatial location of the ROI, but we observe a significant improvement in all white matter ROIs, including the genu and splenium of the Corpus Callosum, for most preprocessing pipelines.While many pipelines achieve excellent performance in terms of absolute agreement, despite the introduced artifacts, we observed a large variability in performance of preprocessing workflows to the extent that some pipelines are detrimental to the data quality and reproducibility. We believe that automated quality control (QC) can detect such cases and that the use of such QC tools is warranted.
Acknowledgements
We would like to thank Erpeng Dai, Maxime Descoteaux, Luke J. Edwards, Bennett Landman, Jennifer McNab, Kurt Schilling, and Nikolaus Weiskopf for Data collection, and Daan Christiaens, Maxime Descoteaux, Vladimir Golkov, Siawoosh Mohammadi for design of acquisition protocol.
Data acquisition has been made possible with support from Canada Institutional Research Chair in NeuroInformatics; National Science Foundation CAREER award number 1452485; the National Institutes of Health award number R01EB017230; the European Research Council under the European Union’s Seventh Framework Programme (FP7/2007-2013; ERC #616905); the German Federal Ministry of Education and Research (BMBF) (01EW1711A & B) in the framework of ERA-NET NEURON; and the Max Planck Society; Polish National Agency for Academic Exchange for grant PPN/BEK/2019/1/00421 under the Bekker programme; European Union (NextGenerationEU).
We further thank everyone who participated in the image preprocessing of the study data.
References
[1] Tax et al. (2022) NeuroImage 249: 118830.
[2] Botvinik-Nezer, R. et al (2020). Nature 582(7810): 84–88.
[3] Carp, J. (2012) Front. Neurosci. 6, 149.
[4] Mori et al. (2008) Neuroimage 40, 570–582
[5] Avants et al. (2008) Medical Image Analysis 12(1):26-41
[6] Koo and Li (2016) J Chiropr Med. 15(2): 155–163.
Figures
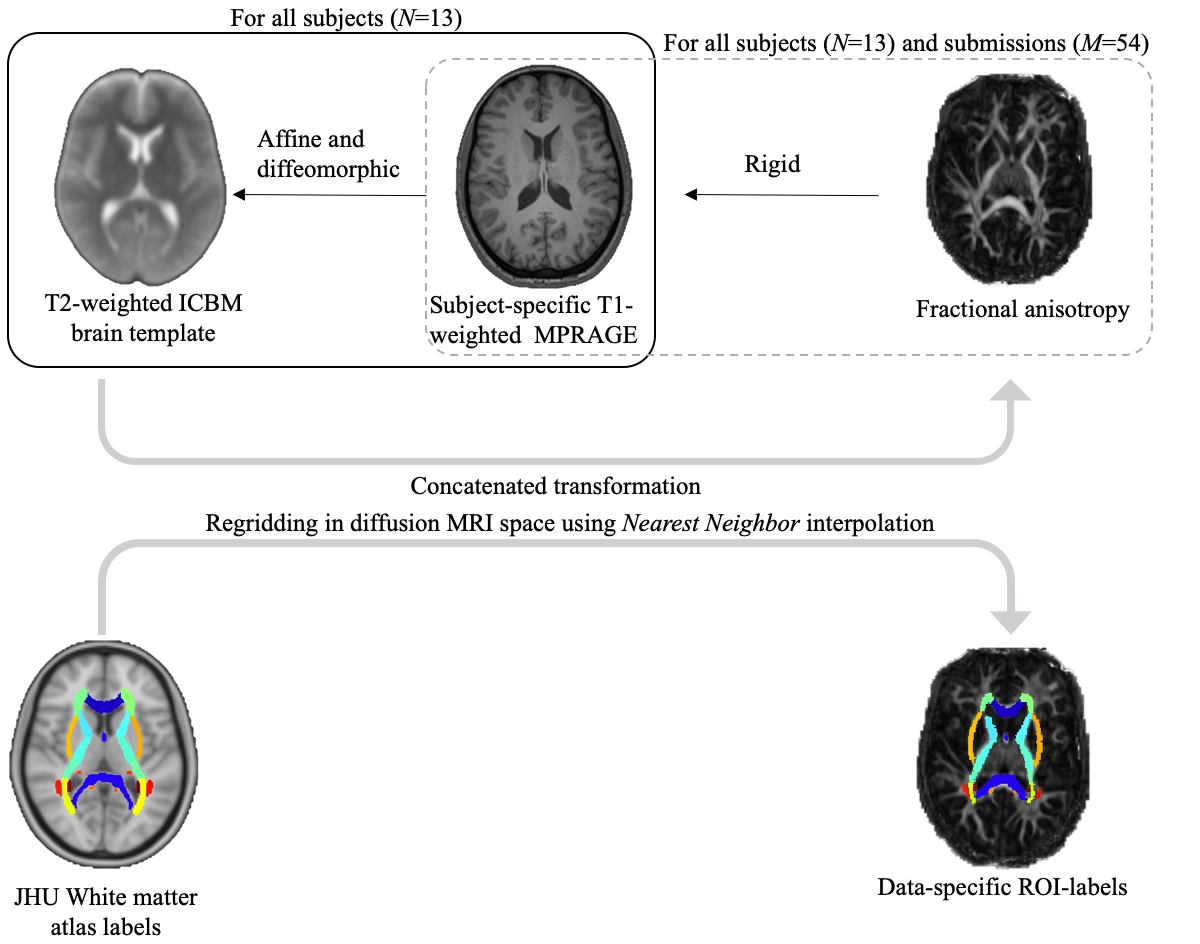
Figure 1: Schematic representation of the image registration workflow. The proposed two-stage registration is favored over a single-stage spatial normalization step for computational efficiency, reproducibility, and minimization of any interference with the preprocessing pipelines. However, consequently, the ROI analysis simultaneously penalizes differences in nominal differences in diffusion metrics and image geometry. Note that any residual misalignment between the atlas and the subject-specific MPRAGES are identical for all 54 submitted pipelines.
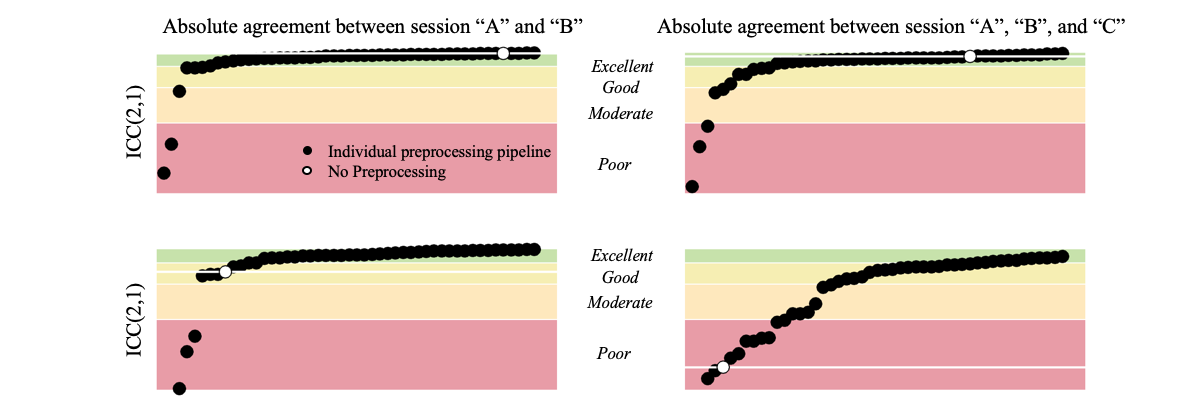
Figure 2: Absolute agreement of ROI-averaged FA across scan sessions for each of evaluated 54 preprocessing pipeline (black dots) and no preprocessing (white dot) for the Posterior limb of the internal capsule (top row) and the genu of corpus callosum (bottom row). The absolute agreement was quantified using the ICC(2,1). We show the agreement between sessions “A” and “B” (left) and “A”, “B”, and “C” (right). Of note, the susceptibility-induced geometric distortions of “C” are significantly different from “A” and “B”.