5014
Hierarchical modelling of crossing fibres in the white matter1Wellcome Centre for Integrative Neuroimaging, FMRIB, Nuffield Department of Clinical Neurosciences, University of Oxford, Oxford, United Kingdom
Synopsis
Keywords: Tractography & Fibre Modelling, White Matter, Fixel based analysis
Fibre orientation distribution function (fODF) estimation is usually applied independently for each subject. This can lead to inconsistent fODF estimation across subjects complicating tract-level (i.e., fixel-based) analysis. Here we propose a hierarchical model to extract consistent tract-specific metrics across subjects that permit group comparisons and the development of more reliable biomarkers for disease and biological processes.Introduction
While diffusion MRI is typically used to measure the integrity of tissue in volumetric elements (voxels), Fixel-Based Analyses (FBA) attempt to model crossing fibre-specific parameters within each voxel. Comparing fibre-specific parameters across subjects requires identifying equivalent fibre populations in those subjects. This is challenging due to individual differences in fibre orientations and even number of fibres. In fixel-based analyses, this is usually done post-hoc, after fitting crossing fibre models to individual subjects independently.In this work, we fit crossing fibre models to diffusion MRI data using a hierarchical framework. This guarantees that the crossing fibres are consistent and, therefore, comparable across subjects. We propose an expectation-maximisation approach to fit the model, which ensures scalability to large numbers of subjects. This approach produces a crossing-fibre white matter fibre template, which can be used to estimate fibre-specific parameters that are consistent across subjects and, hence, can be used in a fixel-based statistical analysis.Methods
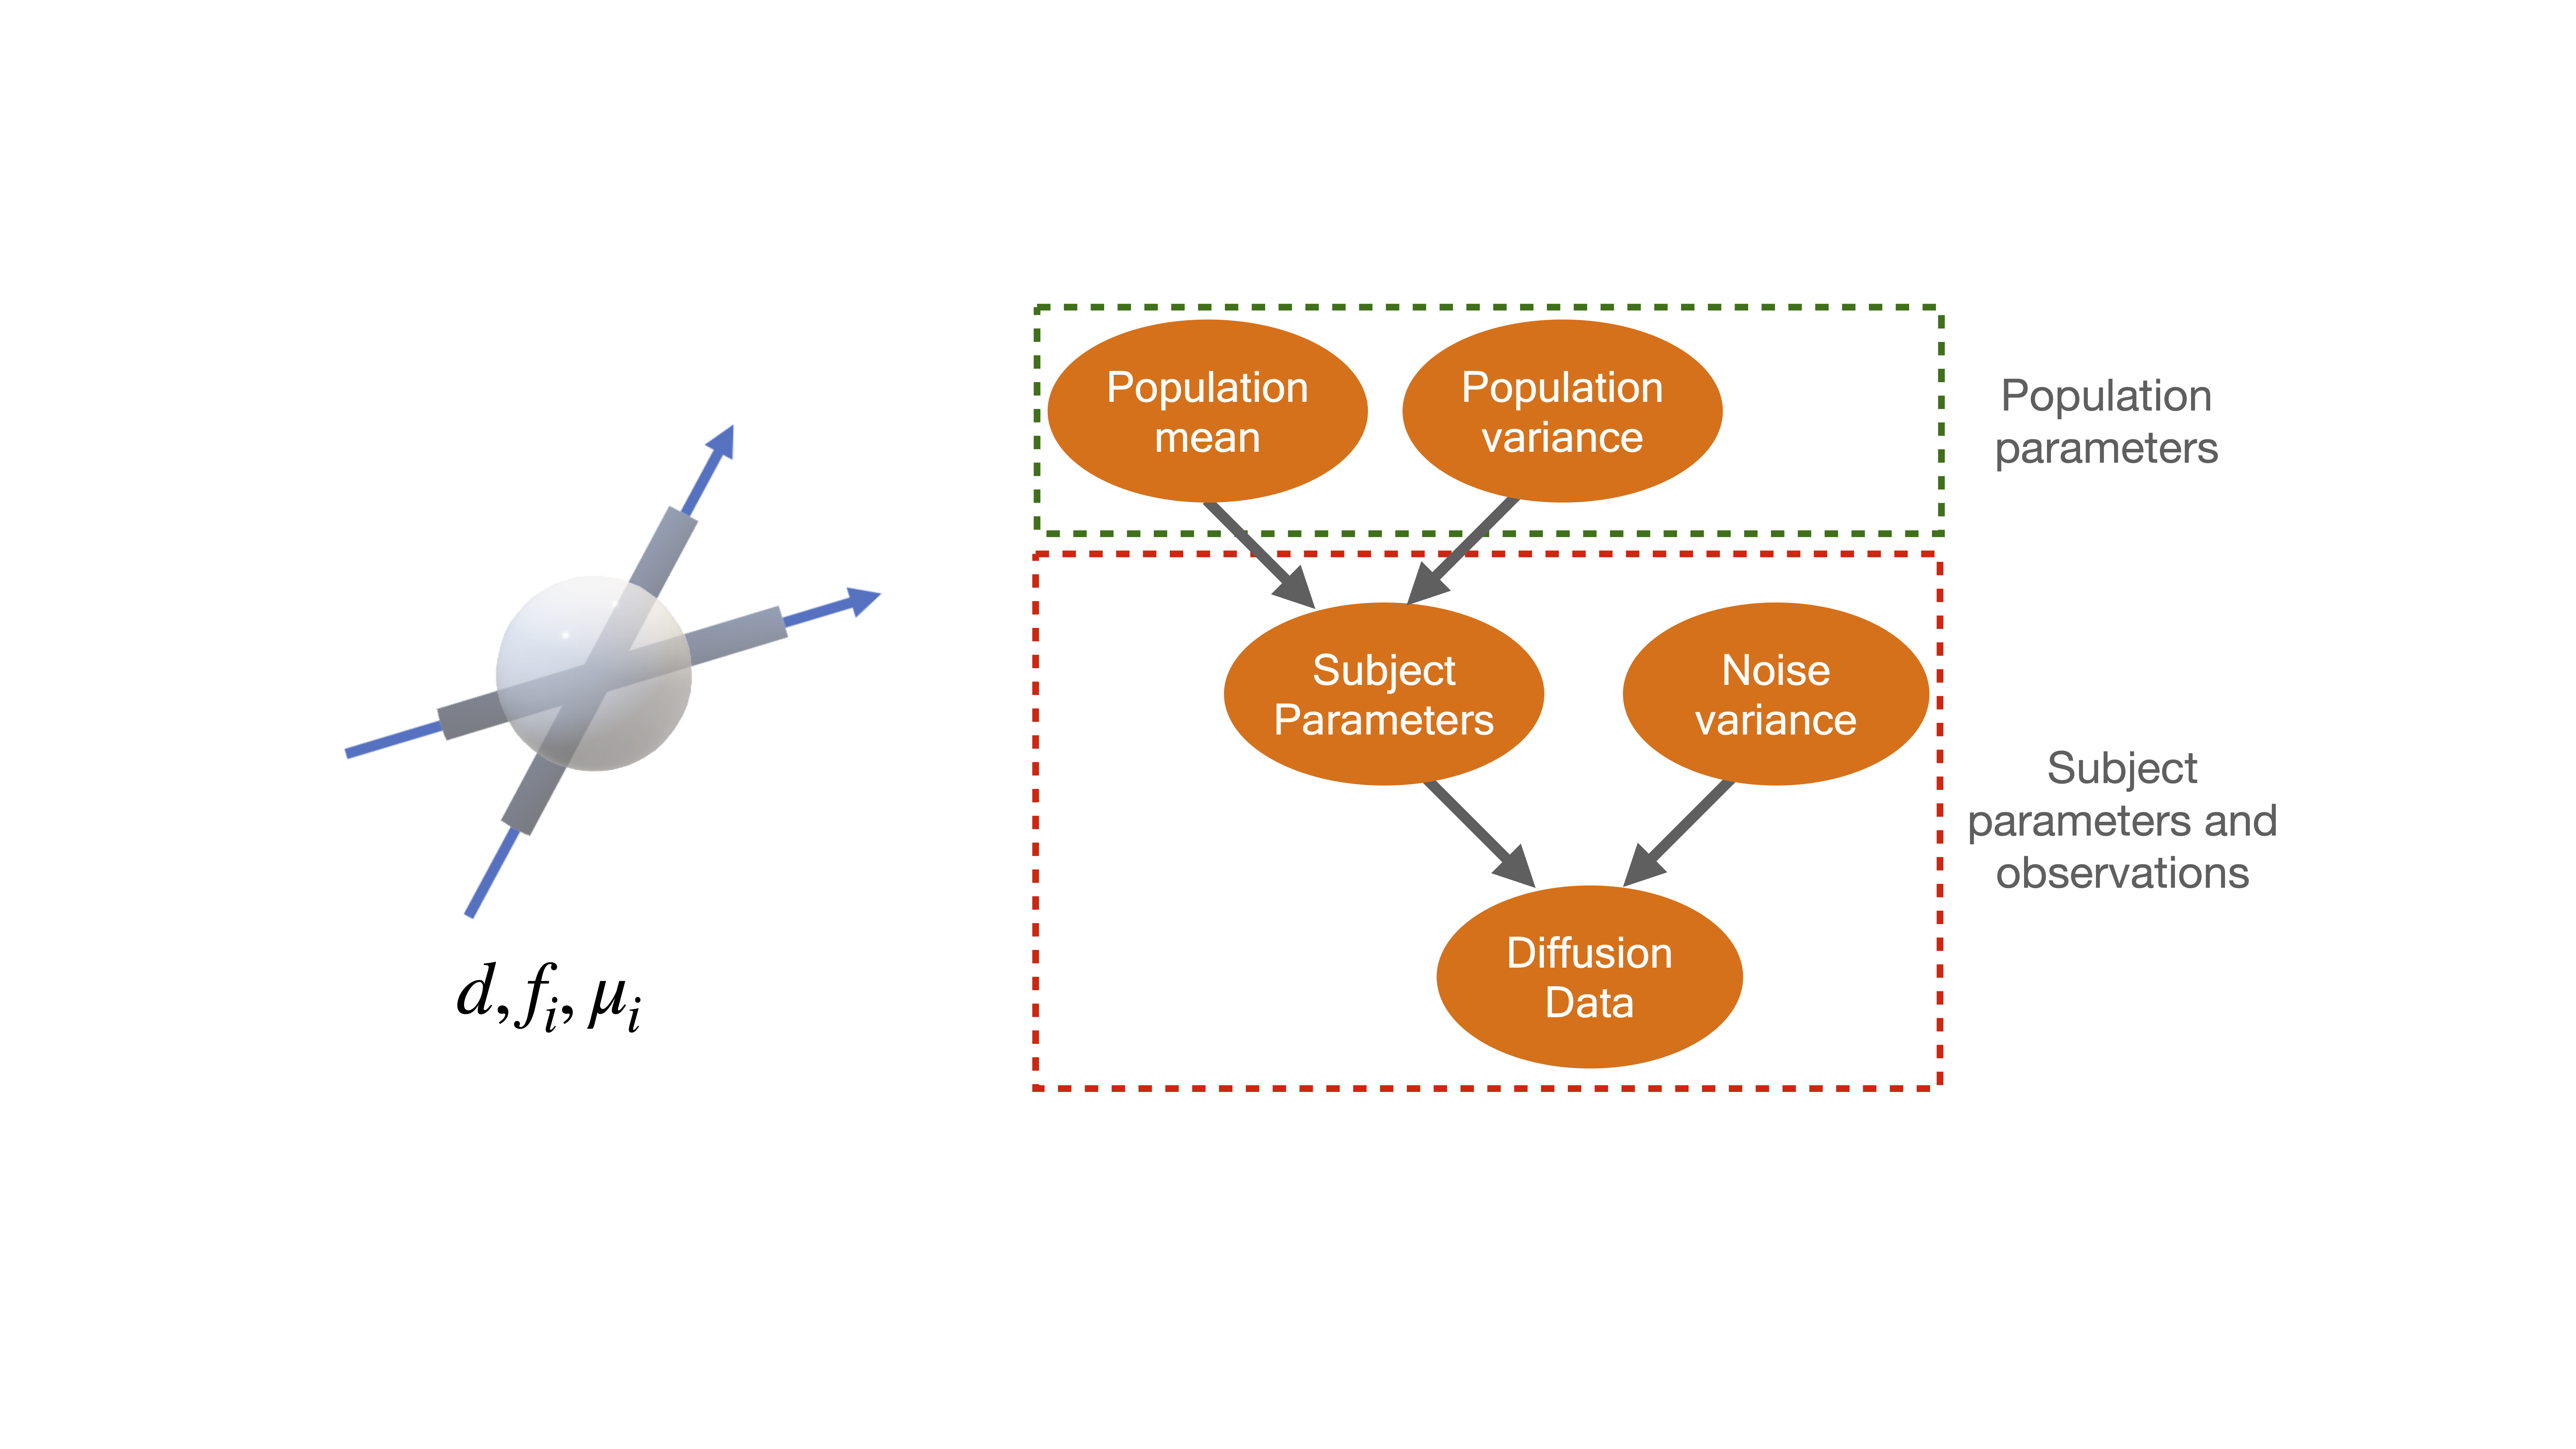
In the ball and sticks model [1] the diffusion MRI signal originates from two sources: intra-axonal water that diffuses only along the fibres (stick) and extra-cellular water that diffuses isotropically (ball):$$S(b,g) = S_0 [(1-\sum_i {f_i}) e^{-bd} + \sum_i {f_i e^{-bd (\mu_i^T g)^2}}]$$
Where $$$s_0$$$ is the signal with no diffusion encoding, $$$d$$$ is the diffusion coefficient, $$$f_i,\mu_i$$$ are the signal fraction and orientation for the $$$i^{th}$$$ fibre population, and $$$b, g$$$ are the b-value and gradient orientation. In a hierarchical framework, we assume that each subject's parameter is a sample drawn from the population distribution. This guarantees that all parameters, including the labelling of the fibres, are consistent across subjects. Scalar parameters are assumed to be drawn from a Gaussians, while orientation parameters are assumed to be drawn from a Watson distribution. We use uniform priors for all the group mean parameters. For the group variance we use a power-law distribution to penalise the group variance converging to zero. The diffusion MRI data of each subject is then generated from the subject parameters following the forward model (Eq1) with additive Gaussian noise.
The free parameters of the complete hierarchical model are the group means and variances, as well as subject parameters. Fitting this entire model requires optimisation in a very high dimensional space; linearly increasing with the number of subjects. To make optimisation feasible for large datasets, we adopt an expectation maximisation approach. In the maximisation step, the group parameters are held constant while the subject parameters are estimated; this step can be run for each subject independently (i.e., parallelised). In the expectation step, the subject parameters are fixed, and the group parameters are estimated. These stages are repeated until all parameters have converged.
To determine the number of fibres in each voxel, we first fit the model with one, two, or three fibres. The number of fibres is then determined by thresholding how much adding an extra fibre improves the total likelihood function summed across all subjects.
The Oxford Multimodal (OMM-1) template [2] is used as the reference space. For each voxel in this space, we locate its corresponding voxel in each subject’s native diffusion space as the nearest neighbour after nonlinear transformation. We employ transformations from MMORF [3], which combines diffusion and structural MRI information during registration.
Results
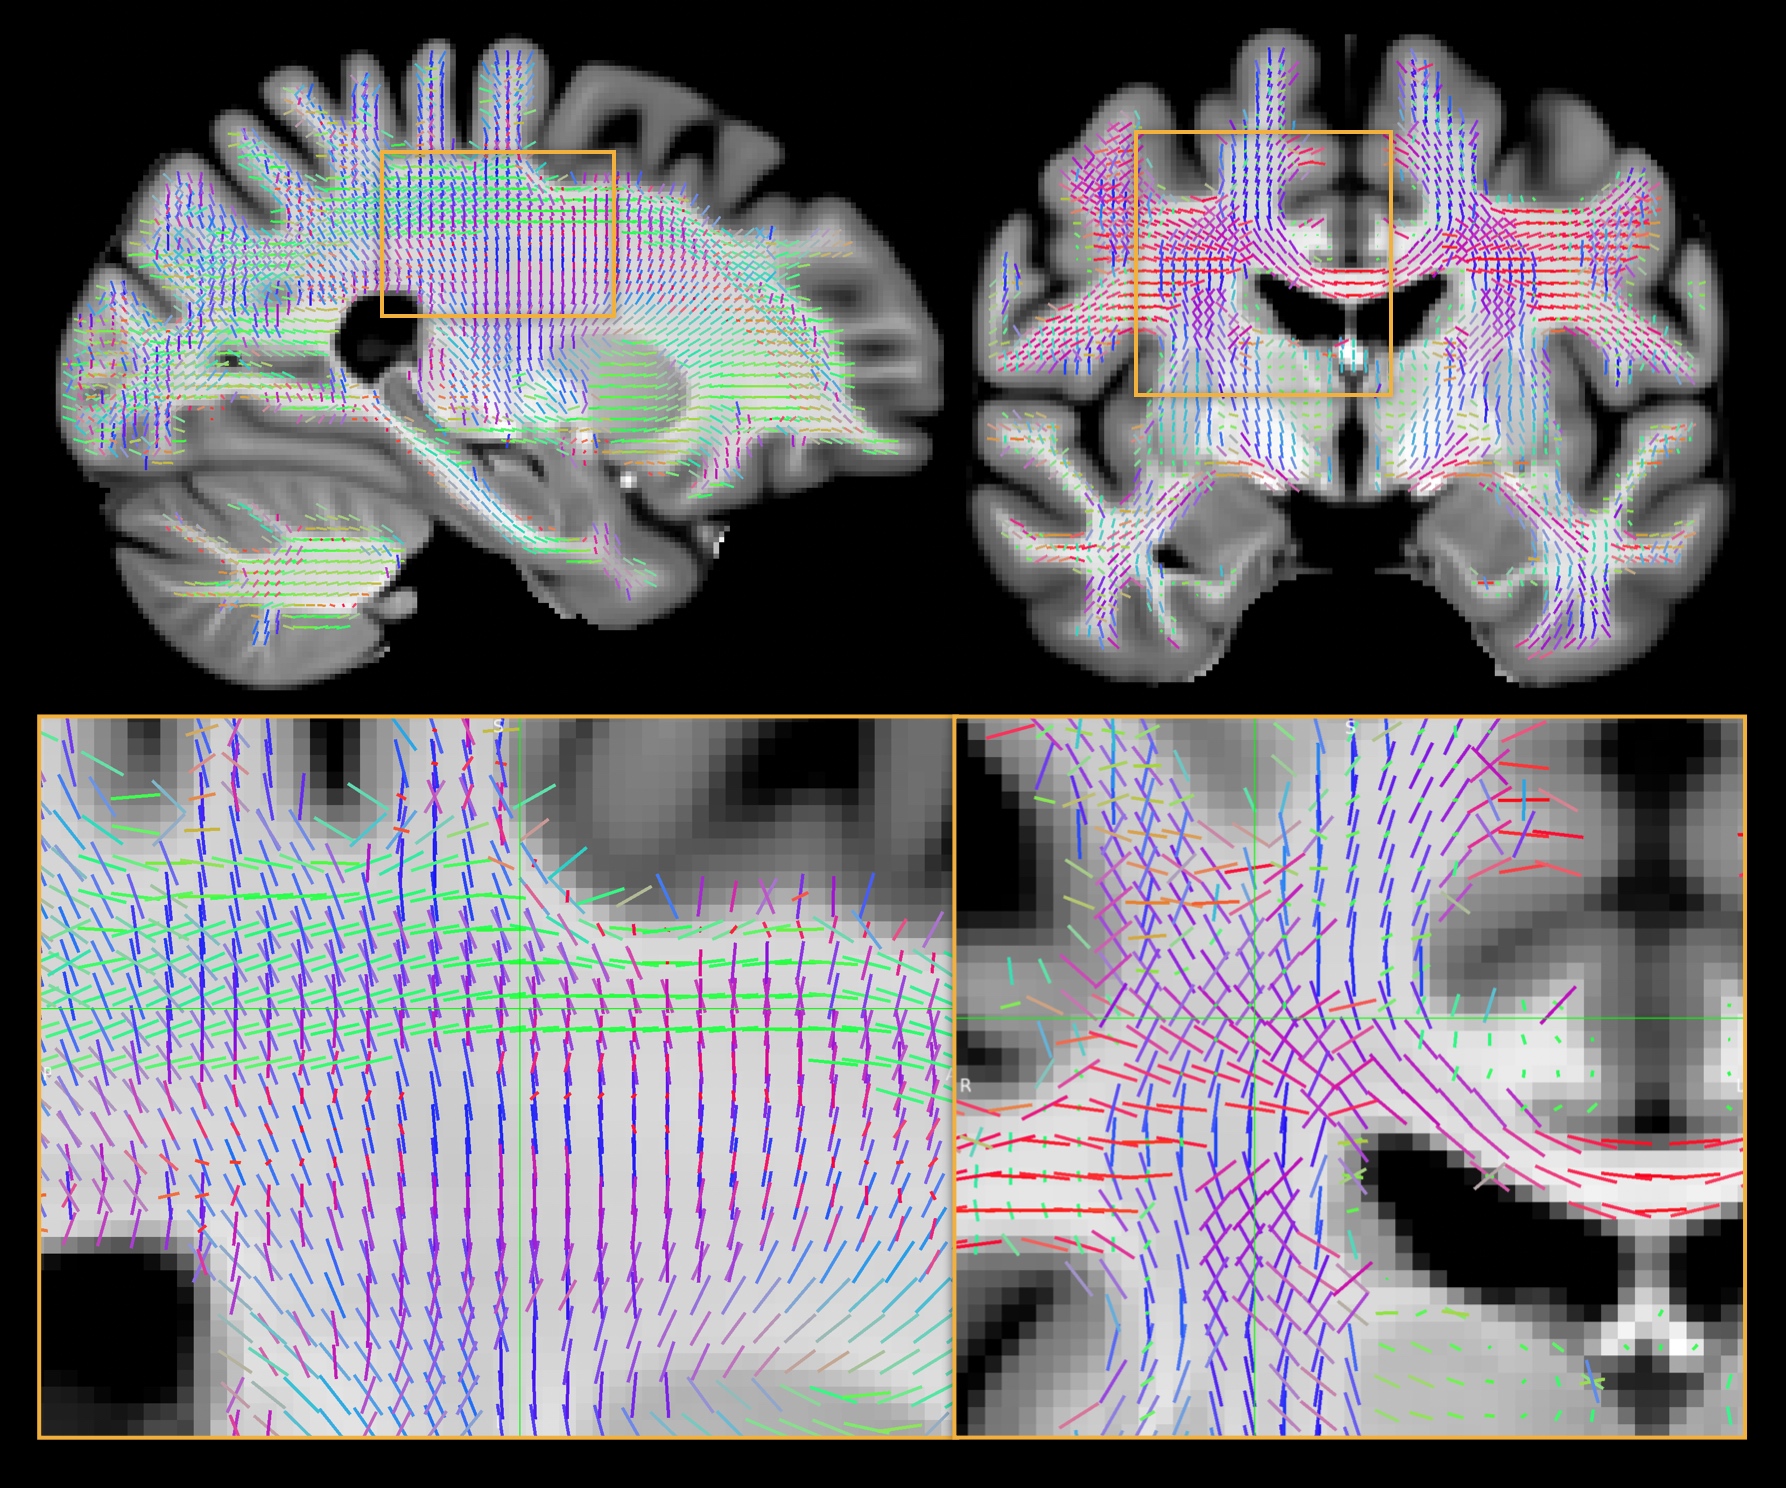
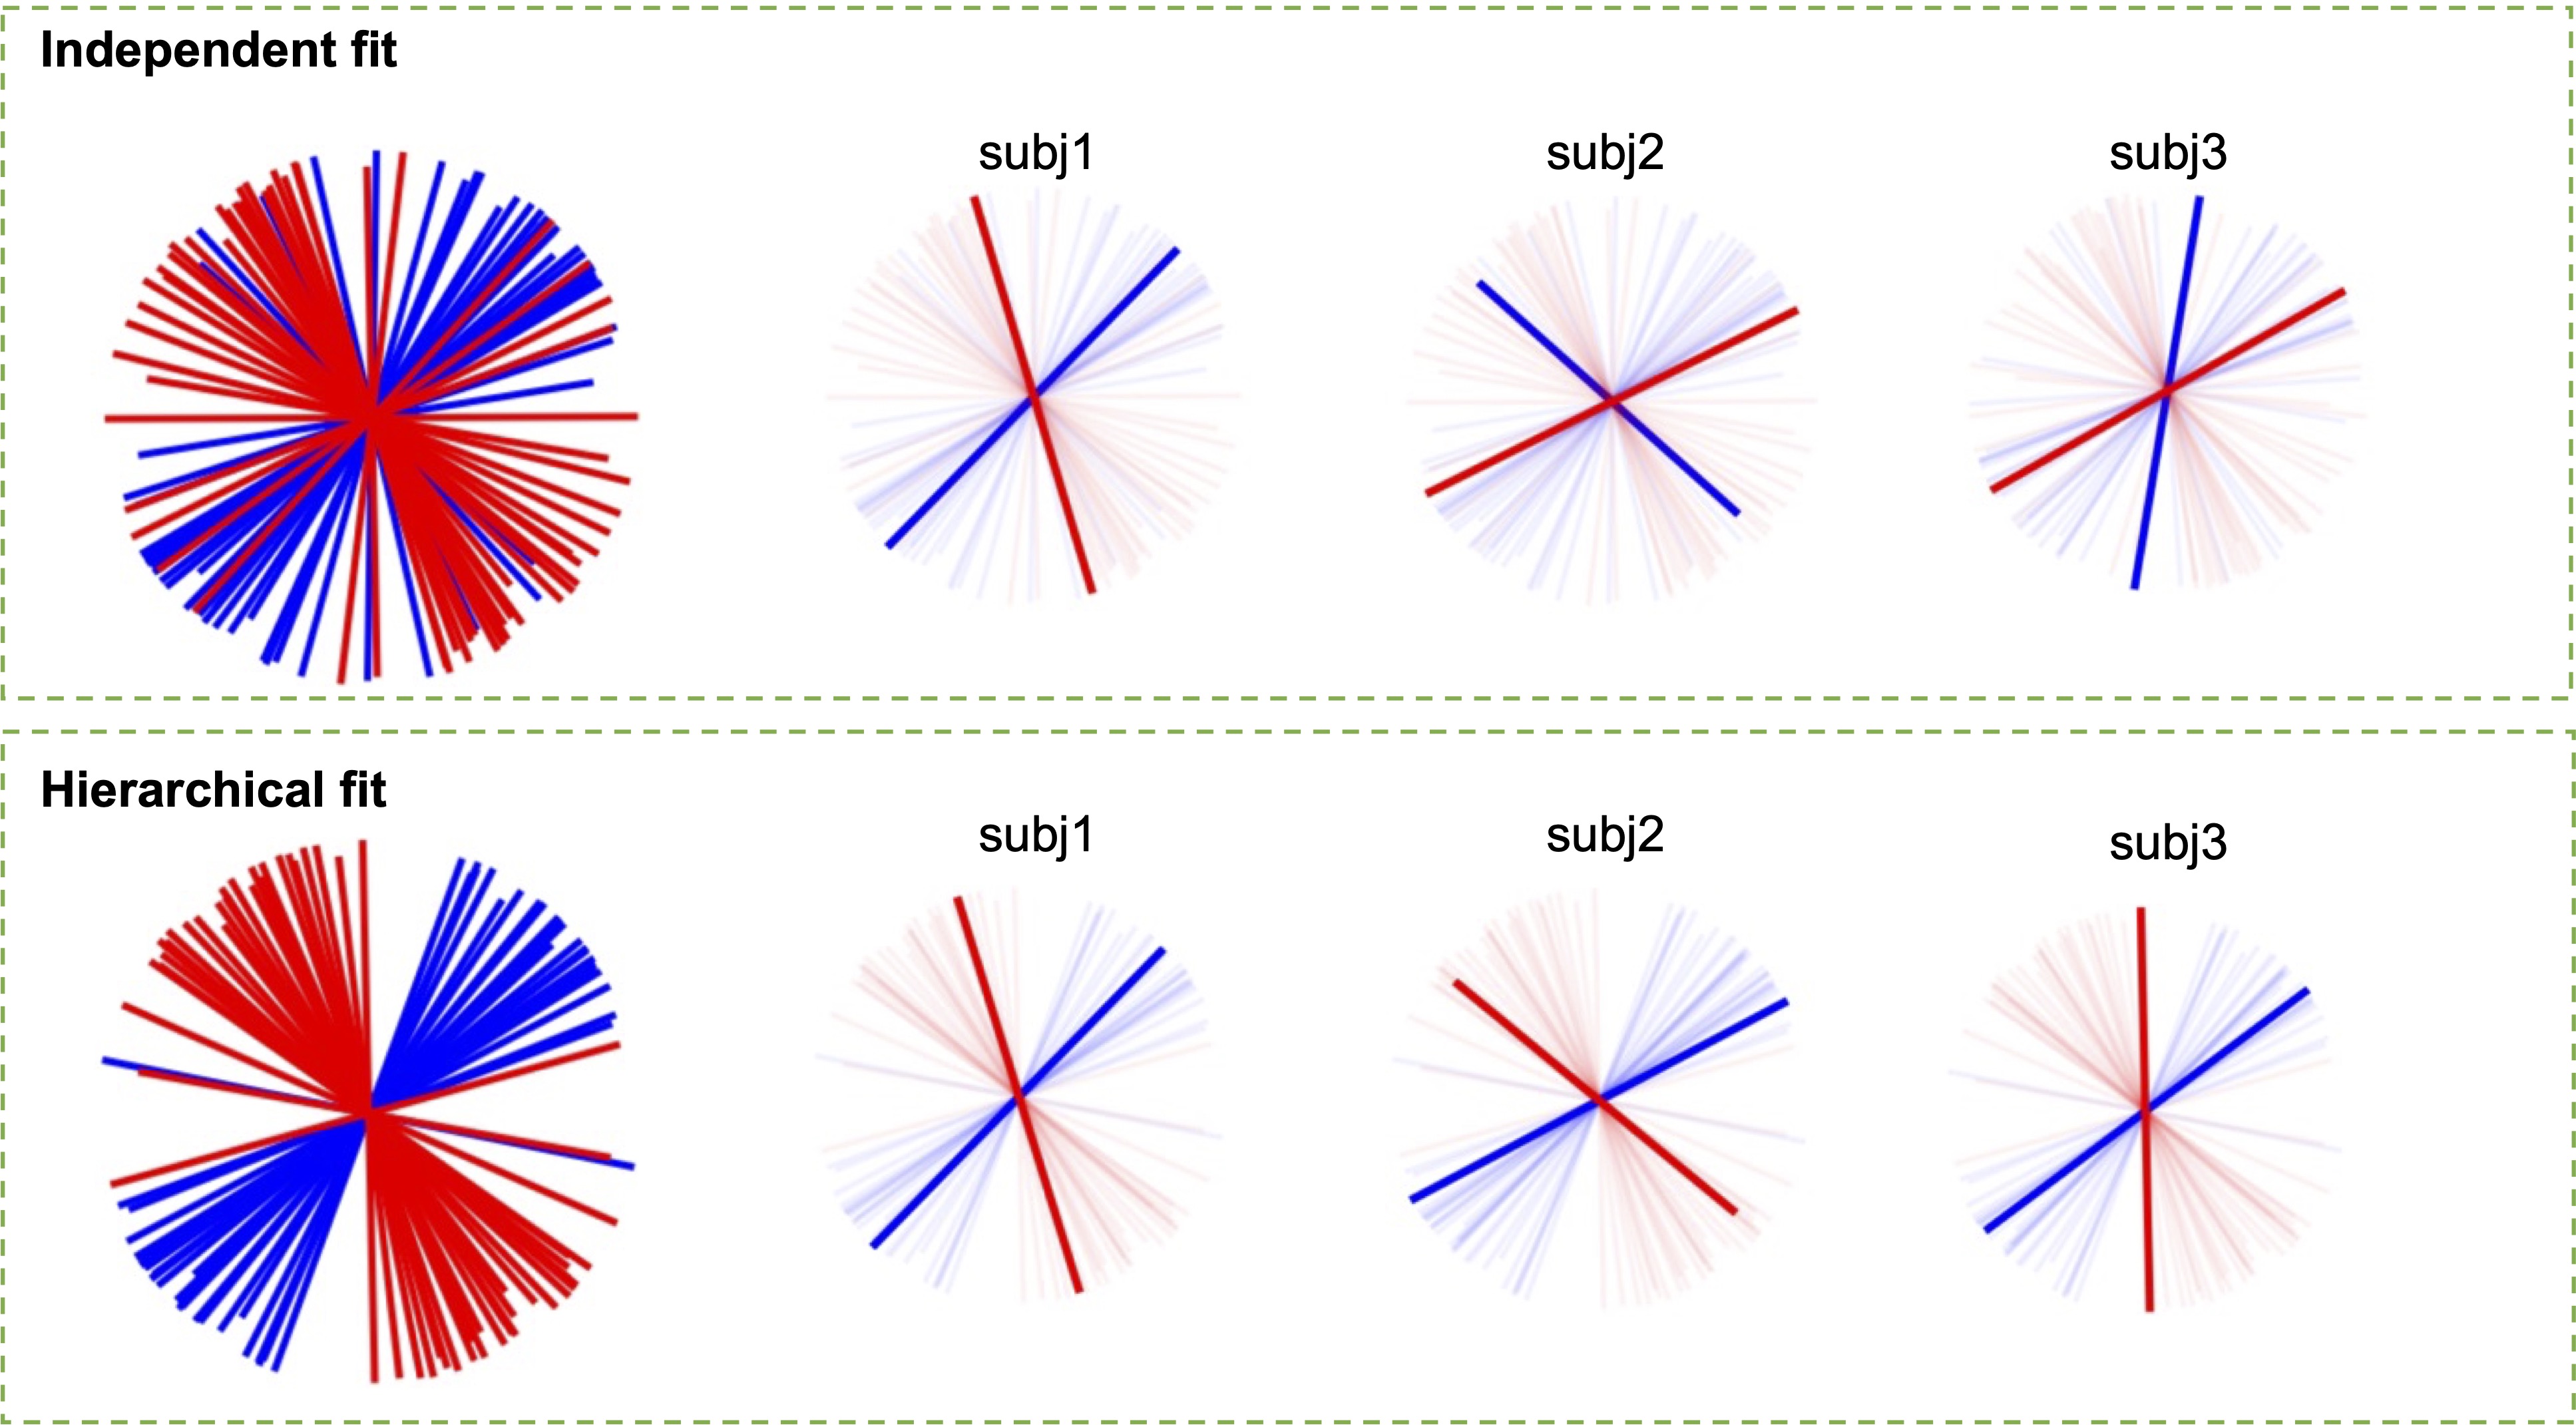
We produced a white matter fibre template using T1 and diffusion images of 30 random participants from the HCP young adults dataset [4] (Figure 2). This template contains the group mean and variance of the parameters from the ball and stick model for each white matter voxel, including the diffusivity, orientation, and signal fraction of the fibres represented in that voxel. Using this template, we can fit the hierarchical ball and stick model on a larger number of subjects and compare fibre-specific signal fractions statistically.In Figure 3, hierarchical fitting is compared to independent fitting in an example crossing fibre voxel. The dominant fibre (with largest signal fraction) is generally consistent between subjects, but there are many subjects which are not (e.g. subj2 and subj3). The hierarchical fitting solves the consistency problem without biasing the individual fibre orientations.
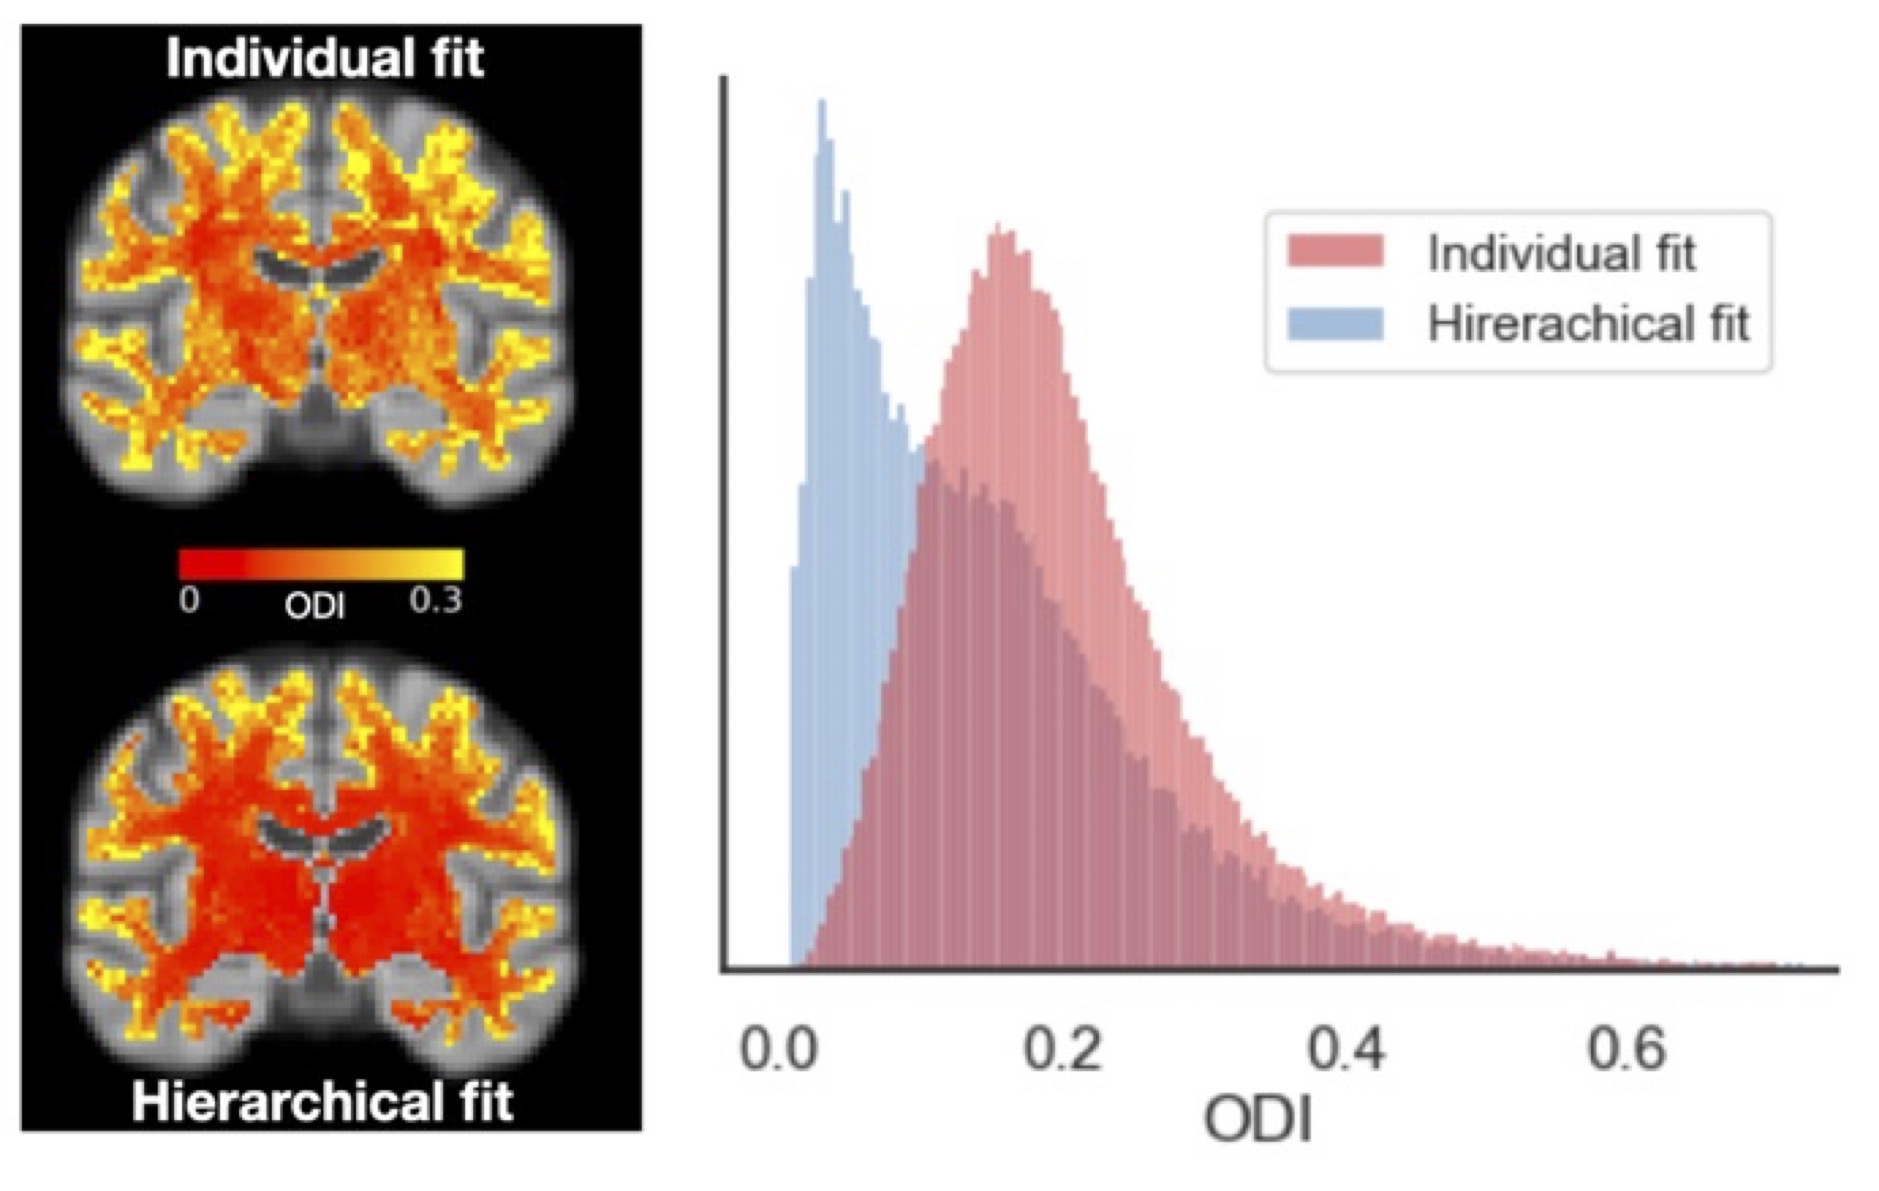
Cross-subject orientation dispersion maps of the first fibre for the individual and hierarchical fits are shown in Figure 4. In many voxels, particularly in deep white matter, the hierarchical fit reduced fibre dispersion. This increased fibre alignment is largely attributable to fibre relabelling (increased consistency across subjects) and partly attributable to a better fit for noisy subjects/voxels.
Discussion
In this study, we have used a hierarchical framework to extract fibre-specific parameters from diffusion MRI data that are consistent across subjects. This approach makes it possible to use so-called fixel-based analysis techniques [5] for models with a discrete fODF, like the ball and stick model. This may be integrated with models that estimate biophysical parameters per discrete fibre population to enable tract-level comparisons that are biophysically meaningful. In the future, we plan to enhance the pipeline's speed and accuracy so that we can use it to analyse group differences and generate tract-specific biomarkers from large datasets such as the UK-Biobank [6].Acknowledgements
SJ is supported by a Wellcome Senior Fellowship (221933/Z/20/Z), MC and SJ by a Wellcome Collaborative Award (215573/Z/19/Z). The Wellcome Centre for Integrative Neuroimaging is supported by core funding from the Wellcome Trust (203139/Z/16/Z). Data were provided in part by the Human Connectome Project, WU-Minn Consortium (Principal Investigators: David Van Essen and Kamil Ugurbil; 1U54MH091657) funded by the 16 NIH Institutes and Centers that support the NIH Blueprint for Neuroscience Research; and by the McDonnell Center for Systems Neuroscience at Washington University. We are also grateful to all the participants, who made this resource possible by donating their time. The computations were carried out using the Oxford Biomedical Research Computing (BMRC) facilities; a joint development between the Wellcome Centre for Human Genetics and the Big Data Institute that is supported by Health Data Research UK and the NIHR Oxford Biomedical Research Centre. We appreciate the insightful comments from Jesper Andersson, Amy Howard, and Christoph Arthofer.References
1- Behrens TE, Woolrich MW, Jenkinson M, Johansen-Berg H, Nunes RG, Clare S, Matthews PM, Brady JM, Smith SM. Characterization and propagation of uncertainty in diffusion-weighted MR imaging. Magnetic Resonance in Medicine. 2003;50(5):1077–88.
2- Arthofer, C., Smith, S.M., Jenkinson, M., Andersson, J., Lange, F. Multimodal MRI template construction from UK Biobank: Oxford-MM-0. (2021). Organisation for Human Brain Mapping (OHBM)
3- F.J. Lange, J. Ashburner, S.M. Smith, J.L.R. AnderssonA symmetric prior for the regularisation of elastic deformations: improved anatomical plausibility in nonlinear image registrationNeuroimage, 219 (2020), Article 116962,
4- Matthew F. Glasser, Stamatios N. Sotiropoulos, J. Anthony Wilson, Timothy S. Coalson, Bruce Fischl, Jesper L. Andersson, Junqian Xu, Saad Jbabdi, Matthew Webster, Jonathan R. Polimeni, David C. Van Essen, and Mark Jenkinson (2013).The minimal preprocessing pipelines for the Human Connectome Project. Neuroimage 80: 105-124.
5- Raffelt DA, Tournier JD, Smith RE, Vaughan DN, Jackson G, Ridgway GR, Connelly A. Investigating white matter fibre density and morphology using fixel-based analysis. Neuroimage. 2017 Jan 1;144(Pt A):58-73. doi: 10.1016/j.neuroimage.2016.09.029. Epub 2016 Sep 14. PMID: 27639350; PMCID: PMC5182031.
6- Alfaro-Almagro F, Jenkinson M, Bangerter NK, Andersson JLR, Griffanti L, Douaud G, Sotiropoulos SN, Jbabdi S, Hernandez-Fernandez M, Vallee E, Vidaurre D, Webster M, McCarthy P, Rorden C, Daducci A, Alexander DC, Zhang H, Dragonu I, Matthews PM, Miller KL, Smith SM. Image processing and Quality Control for the first 10,000 brain imaging datasets from UK Biobank. Neuroimage. 2018 Feb 1;166:400-424. doi: 10.1016/j.neuroimage.2017.10.034. Epub 2017 Oct 24. PMID: 29079522; PMCID: PMC5770339.
Figures