5011
M1-optimized Liver DWI using Tetrahedral Diffusion Gradients on Conventional Gradient Systems1Medical Physics, University of Wisconsin-Madison, Madison, WI, United States, 2Radiology, University of Wisconsin-Madison, Madison, WI, United States
Synopsis
Keywords: Diffusion/other diffusion imaging techniques, Motion Correction
M1-optimized diffusion gradient waveforms allow for motion-robust liver DWI and ADC estimation. However, existing implementations have been limited to 3.0T scanners with high-performance gradient systems. This work introduces M1-optimized waveforms using a tetrahedral diffusion encoding to allow for high quality, motion-robust DWI on a 1.5T system with conventional gradient performance. Additionally, it addresses complications of this approach, namely increased concomitant gradients and eddy currents. Phantom experiments demonstrate a reduction in geometric distortion and bias of ADC maps generated with this approach compared to Stejskal–Tanner (monopolar) and non-tetrahedral gradient designs. Human subject imaging demonstrates increased motion-robustness.Introduction
Diffusion weighted imaging (DWI) of the liver is a clinically useful tool for lesion detection. Using quantitative apparent diffusion coefficients (ADCs), it also shows promise for lesion classification or prediction of therapy response1,2. A challenge of liver DWI and ADC estimation is its sensitivity to respiratory and cardiac motion. Motion-robust liver DWI may be achieved using first moment (M1) optimized diffusion waveforms (MODI)3. However, MODI has only been implemented on a 3.0T system with high-performance gradients (maximum strength, Gmax=70 mT/m, maximum slew rate, Smax=150 mT/m/ms). MODI waveforms with a b-value of 500 s/mm2 on this system require a TE of just 65 ms. A more conventional gradient system (Gmax=33 mT/m, Smax=120 mT/m/ms) requires a TE of 91 ms. Assuming liver T2 of 46 and 35 ms at 1.5T and 3T, respectively, this leads to drops in the MR Signal of 43% and 52%, respectively4. Previously, MODI was implemented using a single gradient coil per diffusion direction (orthogonal encoding). Shorter TEs can be achieved using multiple gradient coils simultaneously (e.g., tetrahedral encoding)5,6. But this can also increase eddy currents (ECs) and concomitant gradients (CGs). The purpose of this work was to incorporate tetrahedral encoding (tMODI) into MODI and investigate potential corrections for both ECs and CGs.Methods
Imaging for this work was done on a 1.5T MR Scanner (Signa Artist, GE Healthcare, WI, USA) with gradient performance typical of many clinical MR scanners: Smax=120 mT/m/msec, Gmax=33 mT/m. The 1.5T field strength allows for better characterization of CG effects since CGs are inversely proportional to the field strength. tMODI was achieved by generating a single waveform which, when propagated to all three gradient coils, produced a resultant waveform with the desired b-value and M1-value. The achieved TEs for each waveform design described below are presented.EC-nulling
The residual magnetic fields due to ECs with decay constant $$$\tau$$$ were nulled by adding the following constraint to the existing MODI waveform optimization7:
$$\begin{equation}\epsilon(\tau,t)~=~\frac{dG}{dt}~*~e^{-t/\tau},~\phantom{ThisIsA}\epsilon(\tau, T_{Diff})~=~0.\phantom{taggingspace}\tag{1}\end{equation}$$
TDiff is the time at the end of diffusion encoding and * represents convolution. To determine an optimal $$$\tau$$$, a cylindrical phantom (15 cm diameter, 20 cm length) was imaged using tMODI waveforms with $$$\tau$$$ ranging from 20-100 ms in 20 ms steps. The determined optimal $$$\tau$$$ value was that which minimized image distortions as measured using the mean normalized correlation coefficient (NCC) calculated between all diffusion directions8. The phantom was also imaged with monopolar diffusion waveforms (MONO), non-tetrahedral MODI waveforms, and bipolar gradient waveforms which serves as an eddy-current free reference. A large, circular ROI was drawn to calculate bias from the reference for each slice.
CG-nulling
Excess phase accumulation caused by CGs can be described using self-squared terms (e.g., Gx(t)2) and cross-terms (e.g., Gx(t)Gy(t))9. The existing MODI optimization algorithm includes CG-nulling for orthogonal encodings by ensuring that
$$\int_{A_1}~G(t)^2~dt~-~\int_{A_2}~G(t)^2~dt~=~0.~\phantom{taggingspace}\tag{2}$$
where Ai is the diffusion encoding time before (i=1) or after (i=2) the refocusing RF pulse. In the tetrahedral design, all cross-terms collapse to self-squared terms since each coil uses a copy of the same waveform. Since self-squared terms are nulled by (2), the total CG-induced phase is also nulled. The above phantom was imaged using tMODI with and without CG-nulling, and ADC bias in comparison to MONO-derived ADC was determined.
In-Vivo Imaging
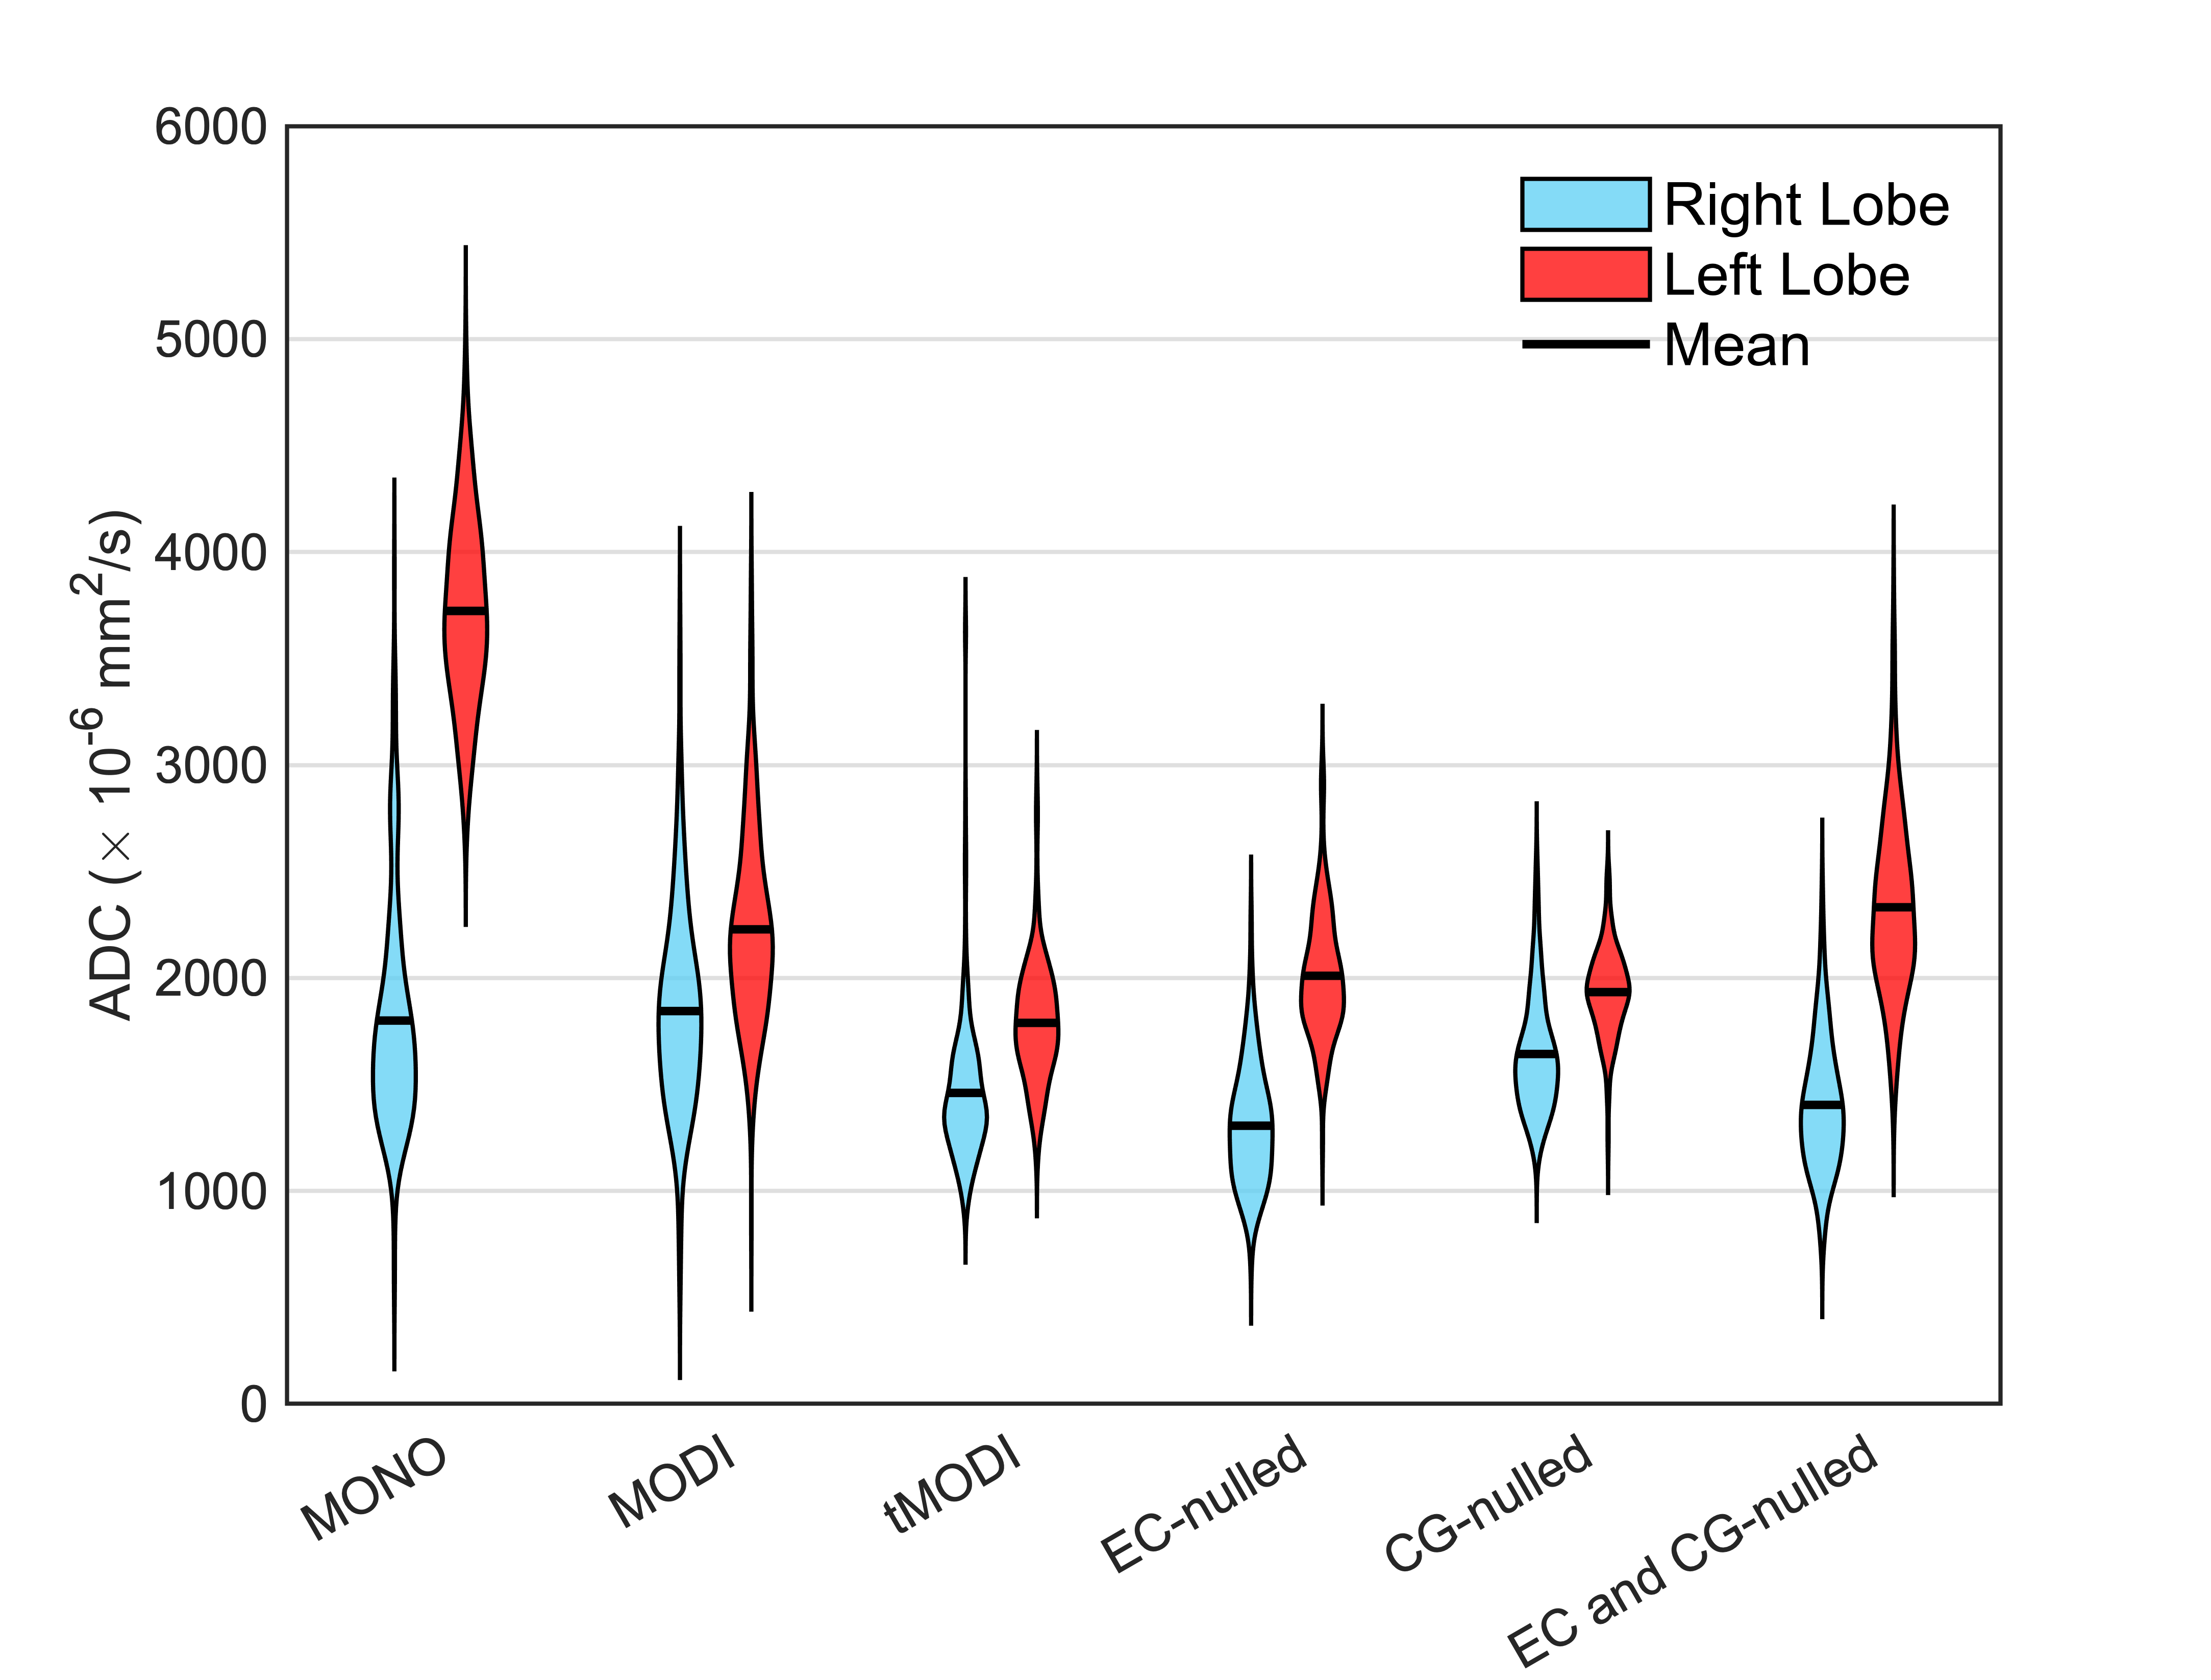
A single volunteer was imaged after informed consent and IRB approval. Imaging consisted of 4 different tMODI waveforms with various level of correction: no-correction, EC-nulling (using $$$\tau$$$ as determined above), CG-nulling, and both EC- and CG-nulling. MONO and non-tetrahedral MODI waveforms were also acquired. Respiratory triggered gating was used. ADC values from a small circular ROIs in the left and right lobes of the liver were calculated and compared.
Results
tMODI allowed for a 21 ms TE reduction compared to MODI (Table 1). For EC-nulling, the TE was inversely proportional to $$$\tau$$$ and increased by 4-10 ms. CG-nulling increased the TE by only 0.5 ms.EC-nulling
EC-nulling with $$$\tau$$$=20 ms minimized NCC and ADC bias (0.94 and $$$29\times~10^{-6}$$$ mm2/s, respectively, Figure 2). Figure 3 shows example ADC maps generated from MONO, MODI, and tMODI with EC-corrections.
GC-nulling
CG-correction reduced intra-ROI bias from $$$61\times~10^{-6}$$$ mm2/s to $$$36\times~10^{-6}$$$ mm2/s as measured in the agar phantom.
In-vivo Imaging
Representative healthy volunteer liver images are shown in Figure 4. The ADC difference between left and right liver lobes was minimized using tMODI with CG-nulling, but not EC-nulling (Figure 5).
Discussion
This work demonstrated generating M1-optimized diffusion waveforms using tetrahedral diffusion encoding allowing for a substantial TE reduction of 21 ms. With typical liver T2 values, a signal increase of 58% and 82% at 1.5T and 3.0T, respectively could be expected. Distortions and bias of the tetrahedral design were reduced through EC-nulling and CG-nulling. The TE increase for CG-nulling is only 0.5 ms providing benefits with minimal reduction in SNR. However, EC-nulling led to a an increase of 10 ms, and its benefit remains unclear since it increased interlobar ADC differences.Conclusion
M1-optimized diffusion gradient design with a tetrahedral encoding is feasible to achieve motion-robust liver DWI, with improved ADC mapping performance compared to previous methods. The proposed tetrahedral encoding approach may enable the widespread dissemination of motion-robust liver DWI across systems with varying gradient performance.Acknowledgements
The authors acknowledge support from the NIH (R01 EB030497) as well as from the UW Departments of Radiology and Medical Physics. Also, GE Healthcare provides research support to the University of Wisconsin-Madison.References
1. Cui Y, Zhang XP, Sun YS, Tang L, Shen L. Apparent Diffusion Coefficient: Potential Imaging Biomarker for Prediction and Early Detection of Response to Chemotherapy in Hepatic Metastases. Radiology. 2008;248(3):894-900. doi:10.1148/radiol.2483071407
2. Bruegel M, Holzapfel K, Gaa J, et al. Characterization of focal liver lesions by ADC measurements using a respiratory triggered diffusion-weighted single-shot echo-planar MR imaging technique. Eur Radiol. 2008;18(3):477-485. doi:10.1007/s00330-007-0785-9
3. Zhang Y, Peña-Nogales Ó, Holmes JH, Hernando D. Motion-robust and blood-suppressed M1-optimized diffusion MR imaging of the liver. Magn Reson Med. 2019;82(1):302-311. doi:10.1002/mrm.27735
4. de Bazelaire CMJ, Duhamel GD, Rofsky NM, Alsop DC. MR Imaging Relaxation Times of Abdominal and Pelvic Tissues Measured in Vivo at 3.0 T: Preliminary Results. Radiology. 2004;230(3):652-659. doi:10.1148/radiol.2303021331
5. Rauh SS, Riexinger AJ, Ohlmeyer S, et al. A mixed waveform protocol for reduction of the cardiac motion artifact in black-blood diffusion-weighted imaging of the liver. Magn Reson Imaging. 2020;67:59-68. doi:10.1016/j.mri.2019.12.011
6. Ozaki M, Inoue Y, Miyati T, et al. Motion artifact reduction of diffusion-weighted MRI of the liver: Use of velocity-compensated diffusion gradients combined with tetrahedral gradients. Journal of Magnetic Resonance Imaging. 2013;37(1):172-178. doi:10.1002/jmri.23796
7. Aliotta E, Moulin K, Ennis DB. Eddy current–nulled convex optimized diffusion encoding (EN-CODE) for distortion-free diffusion tensor imaging with short echo times. Magn Reson Med. 2018;79(2):663-672. doi:10.1002/mrm.26709
8. Hao L, Huang Y, Gao Y, Chen X, Wang P. Nonrigid Registration of Prostate Diffusion-Weighted MRI. J Healthc Eng. 2017;2017. doi:10.1155/2017/9296354
9. Szczepankiewicz F, Westin CF, Nilsson M. Maxwell-compensated design of asymmetric gradient waveforms for tensor-valued diffusion encoding. Magn Reson Med. 2019;82(4):1424-1437. doi:10.1002/mrm.27828
Figures
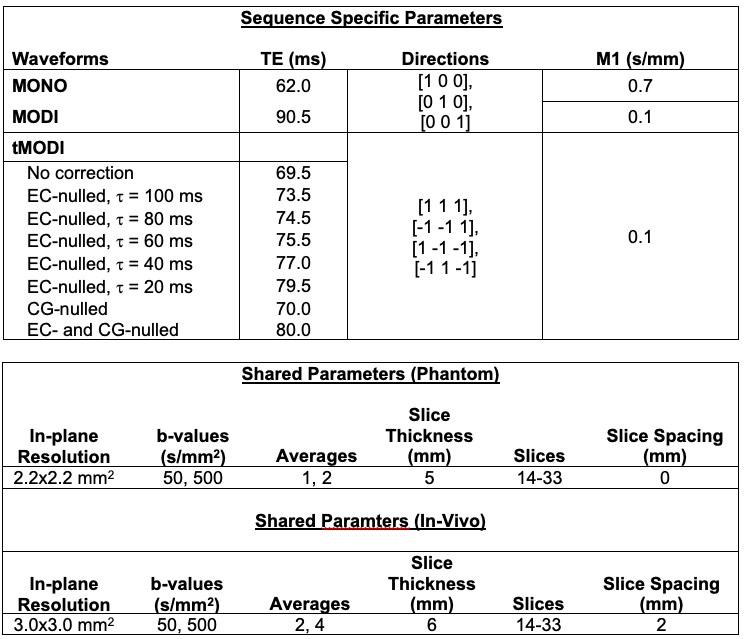
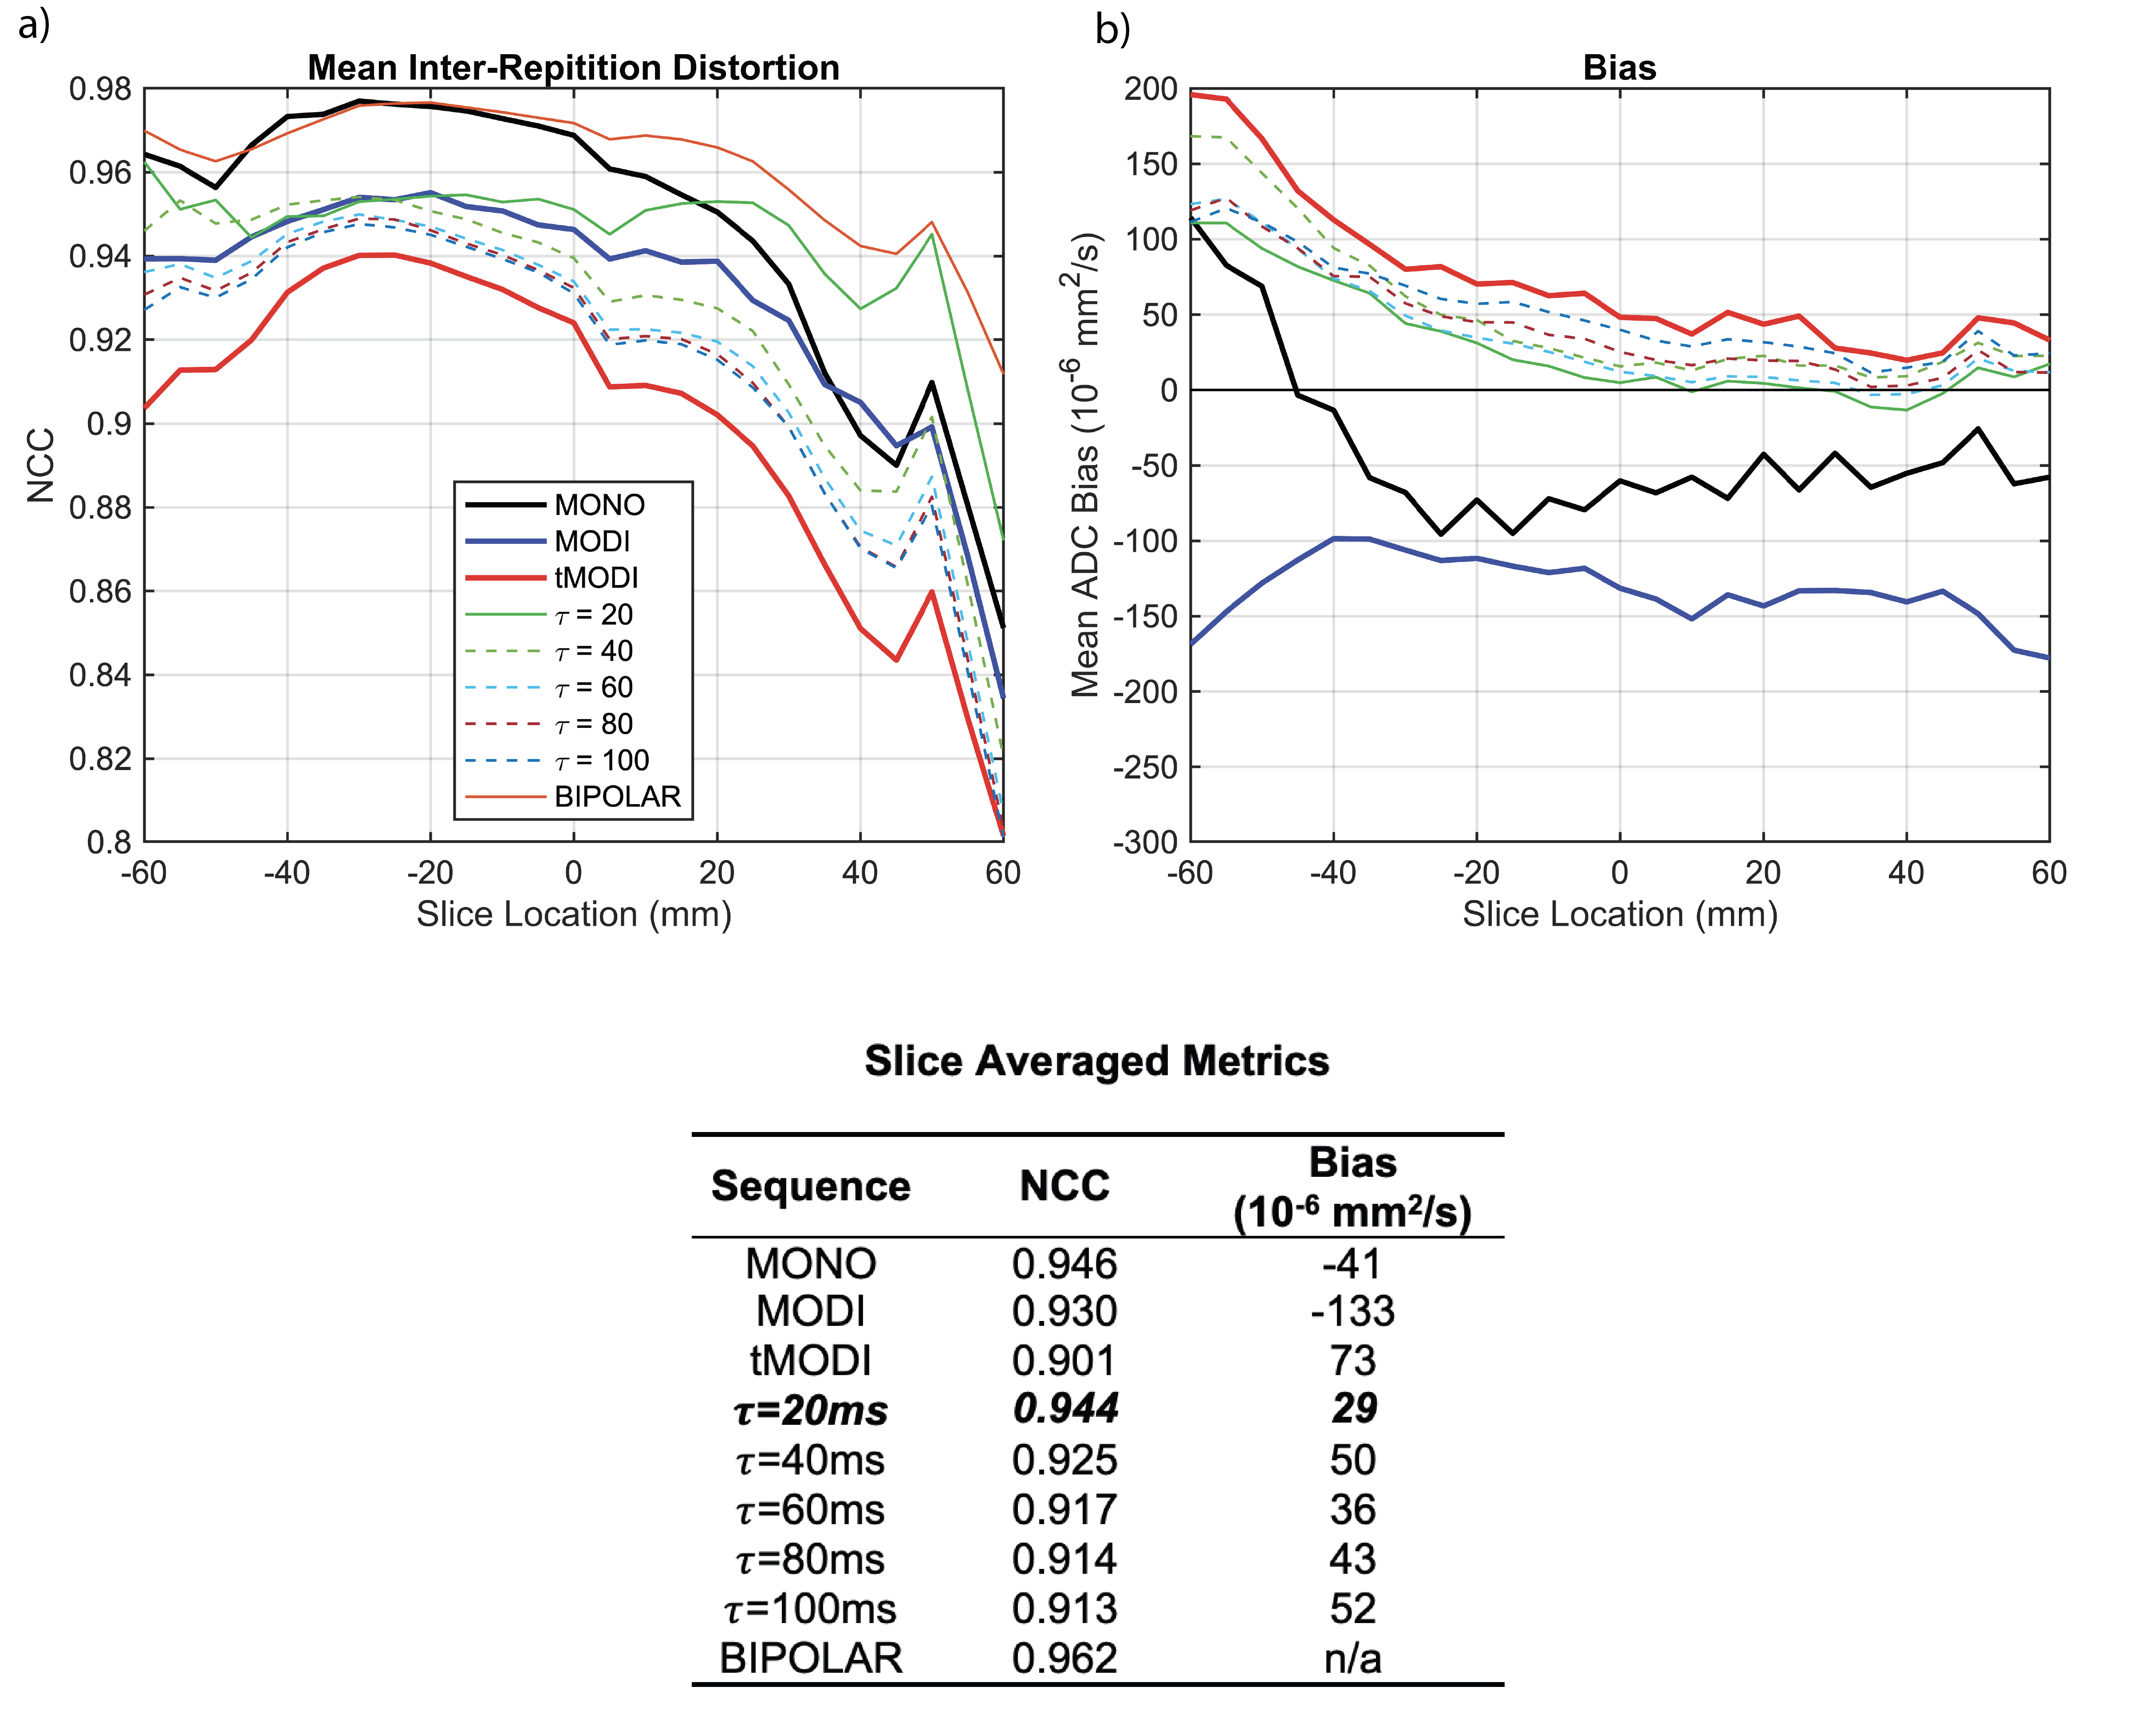
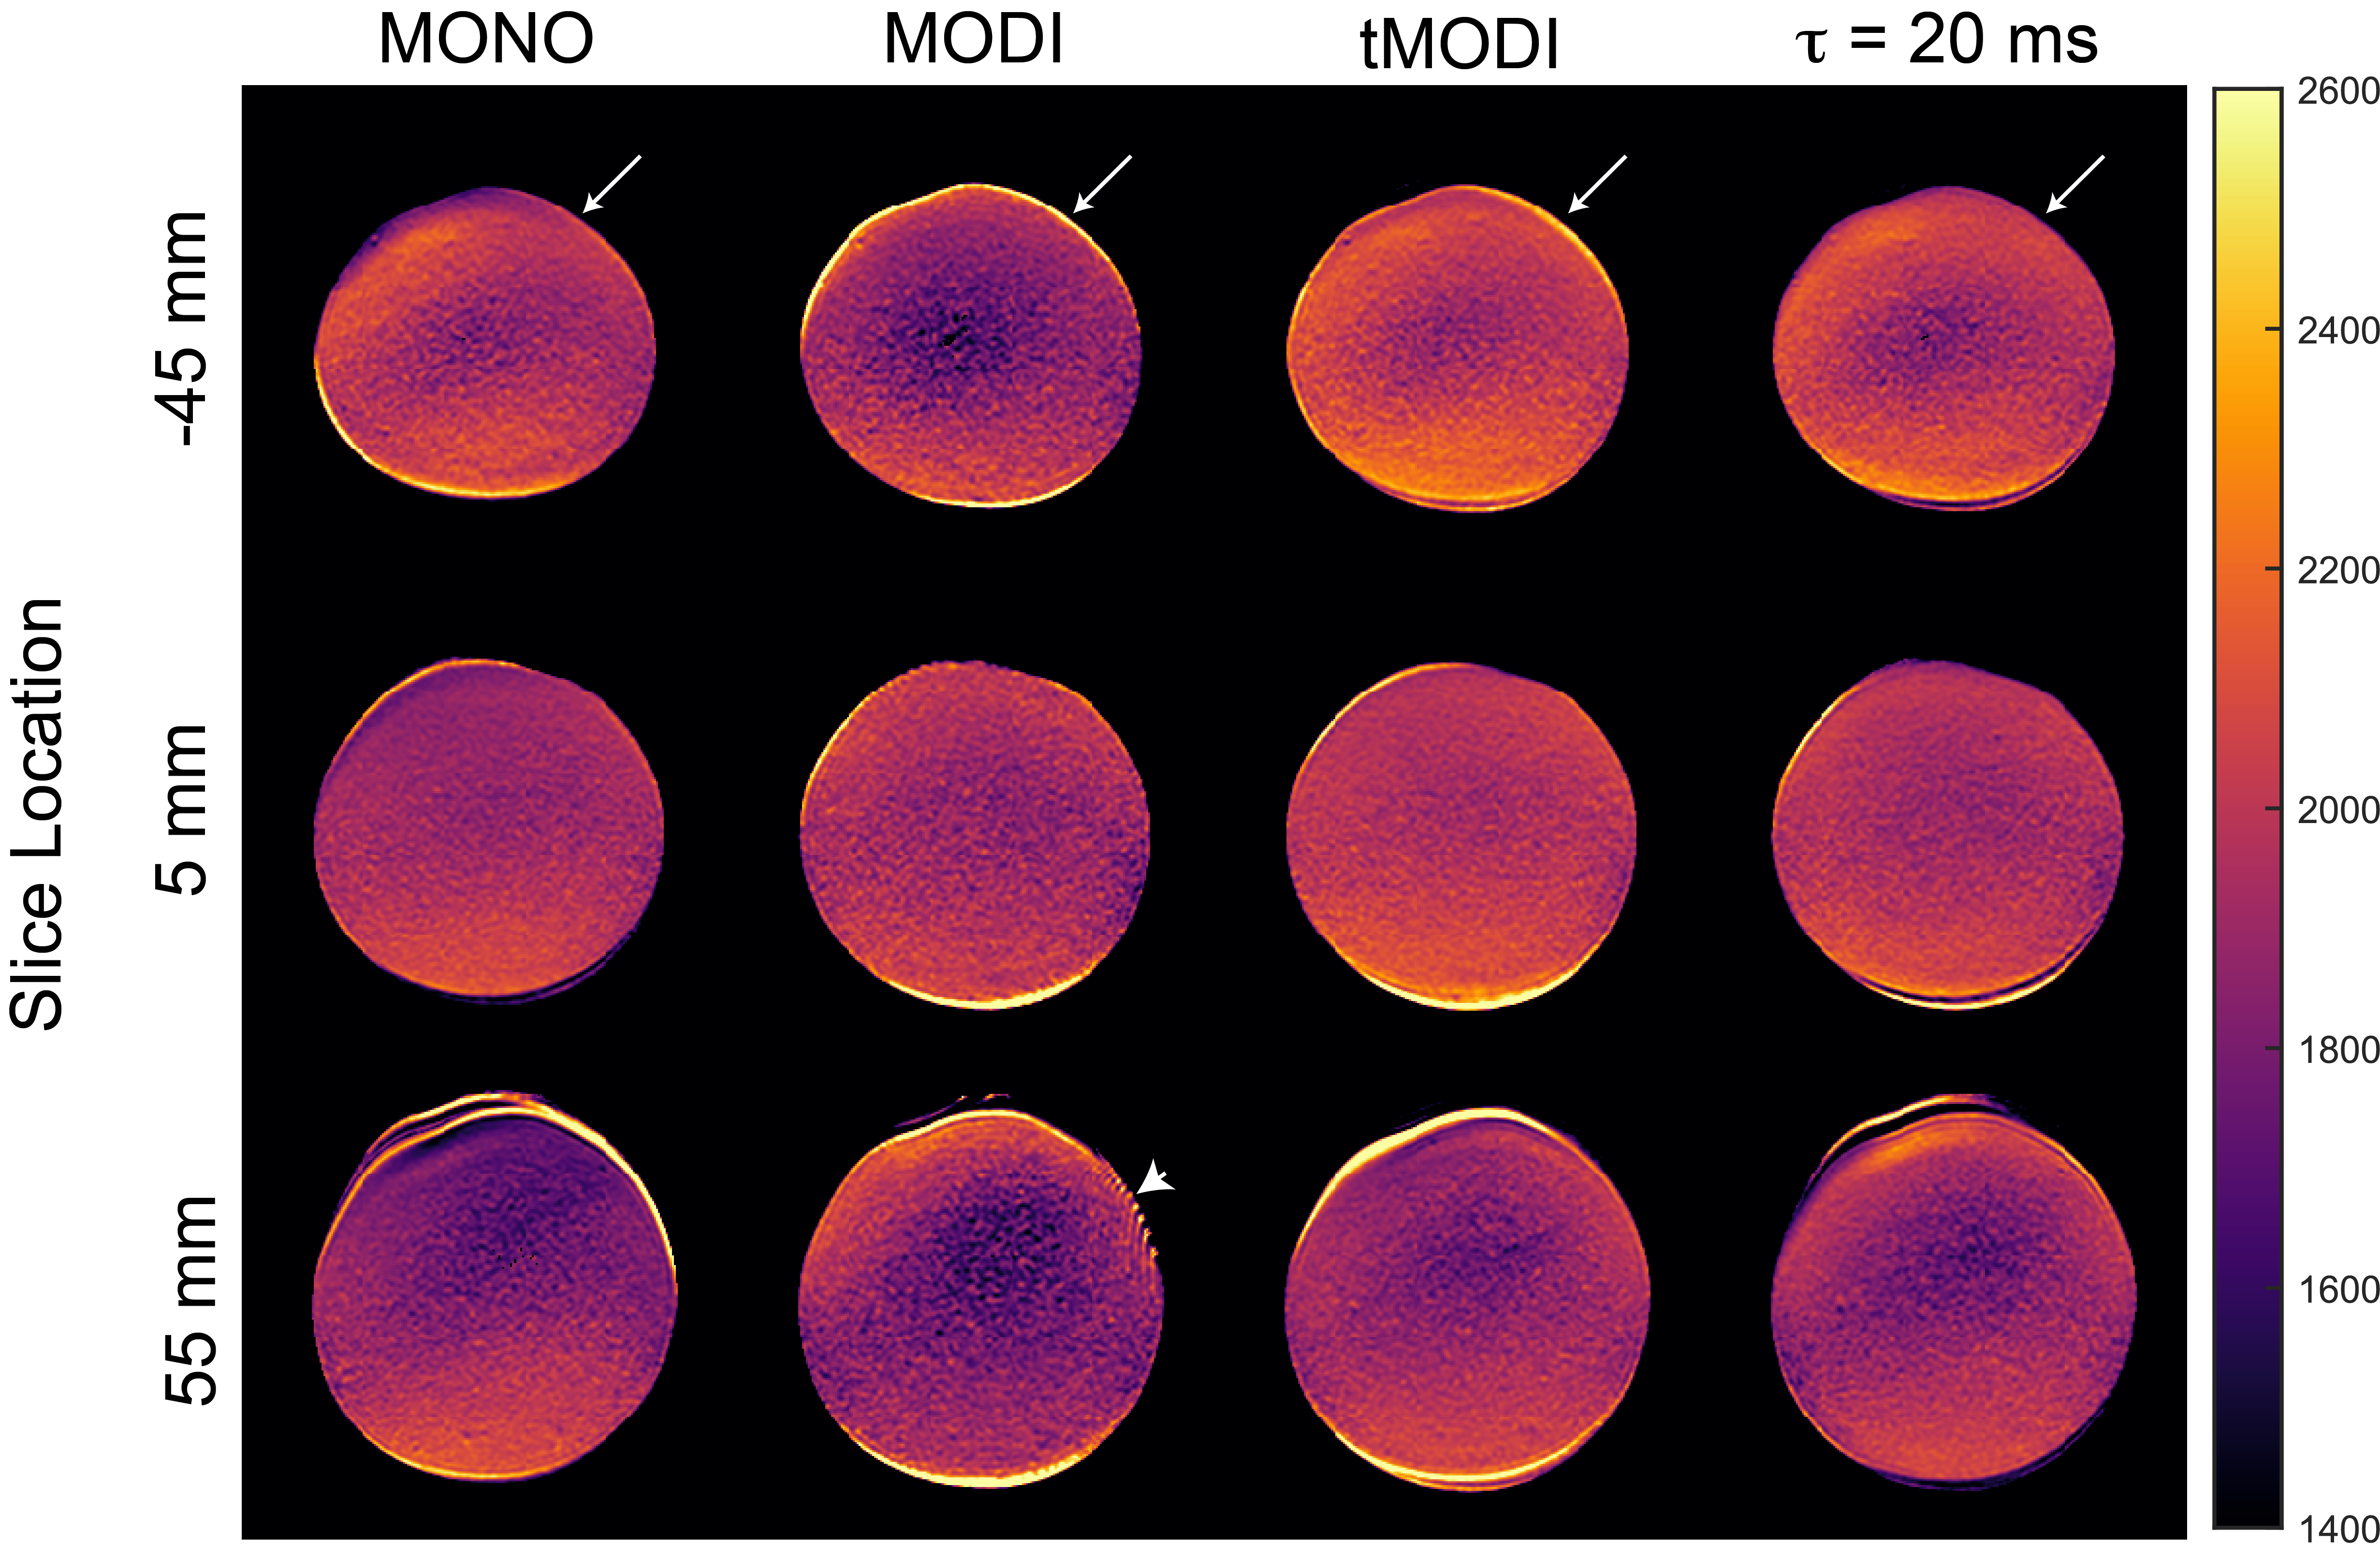
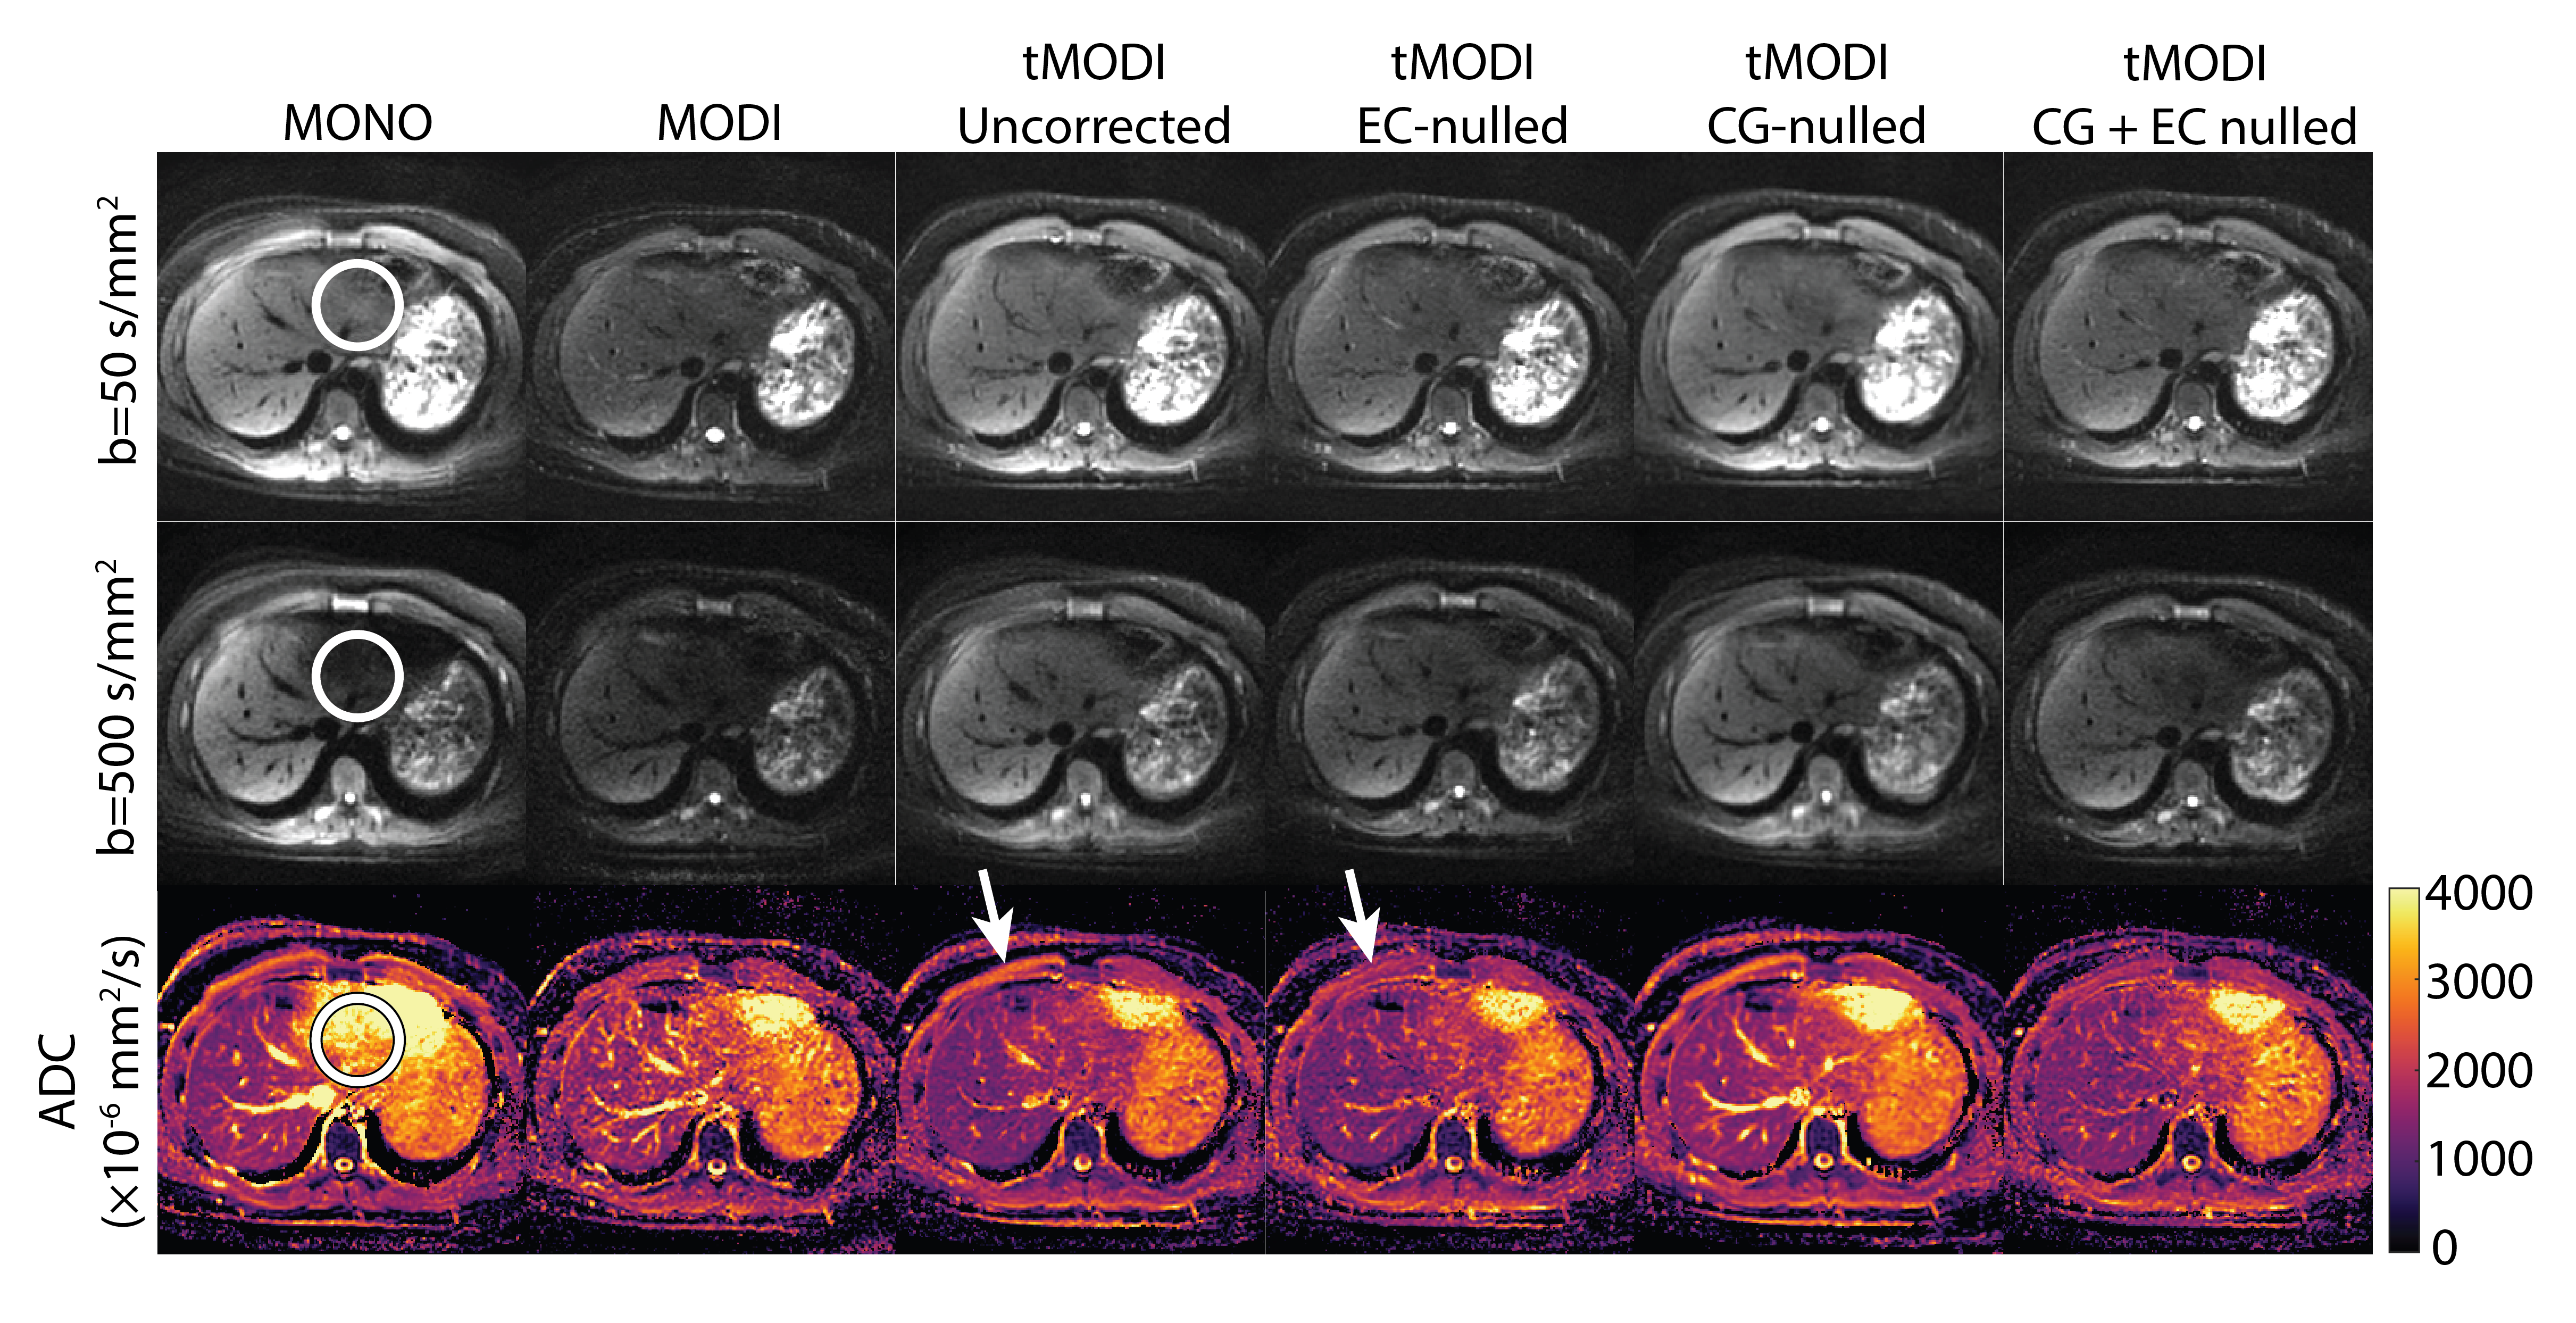
Figure 4: Representative liver DWI and ADC maps from a healthy volunteer show a reduction in signal dropout in the left lobe using tMODI (white circle). The application of EC-nulling and CG-nulling help reduce undesirable effects associated with tetrahedral gradients. EC-nulling reduces elevated ADC near the periphery of the anatomy (white arrow) at the cost of increased TE. CG-nulling provides a small amount of correction which is difficult to see upon visual inspection of the images but becomes clear with ROI-based analysis (Figure 5).