5010
Time-dependence in Tensor-Valued Encoding in Ex Vivo Rat Heart1Leeds Institute of Cardiovascular and Metabolic Medicine, University of Leeds, Leeds, United Kingdom, 2Danish Research Centre for Magnetic Resonance, Centre for Functional and Diagnostic Imaging and Research, Copenhagen University Hospital Amager and Hvidovre, Copenhagen, Denmark, 3Random Walk Imaging, Lund, Sweden, 4Medical Radiation Physics, Clinical Sciences Lund, Lund University, Lund, Sweden
Synopsis
Keywords: Diffusion/other diffusion imaging techniques, Heart, Time dependence, Myocardium, Microstructure, q-space, QTI
Tensor-valued encoding is a promising technique for improving specificity in assessing the myocardial microstructure, but can be confounded by time-dependent diffusion (TDD). Here, the influence of TDD on q-space trajectory imaging (QTI) was examined in ex vivo rat heart, using 17 diffusion encoding waveforms with different frequency content and b-tensor shapes. We report apparent over/underestimation of QTI parameters when waveforms had different sensitivity to TDD, and demonstrate a means of frequency matching that reduced the apparent bias. Acquiring QTI at higher frequencies may provide greater sensitivity to intracellular structures, complementing QTI at lower frequencies.Introduction
Tensor-valued encoding is a promising technique for improving specificity in myocardial tissue characterisation. While conventional diffusion tensor imaging (DTI) provides information on average diffusion features such as mean, axial and radial diffusivity (MD, AD & RD) and fractional anisotropy (FA), it has limited specificity and is confounded by orientation dispersion and microscopic heterogeneity. By using b-tensors of different shapes e.g. spherical, planar and linear tensor encoding (STE, PTE & LTE), and analysing data using the q-space trajectory imaging (QTI) framework1, additional metrics, such as microscopic FA (µFA) and isotropic, anisotropic and total mean kurtosis (MKi, MKa & MKt), can be obtained2, 3. This information can be used to calculate intra-voxel size variation and orientation dispersion for example, thereby providing greater specificity1.In first work, QTI parameters were evaluated using non-motion compensated STE and LTE in ex vivo mouse heart4. However, we know from previous work in calf5, pig6, mouse7, rat8 and human heart9, that time-dependent diffusion is seen in the myocardium, and this has the potential to affect the measured QTI parameters. In this work, we perform QTI across a broad frequency spectrum, and characterise the sensitivity and apparent bias in QTI, with respect to encoding power spectra of PTE and LTE waveforms.
Methods
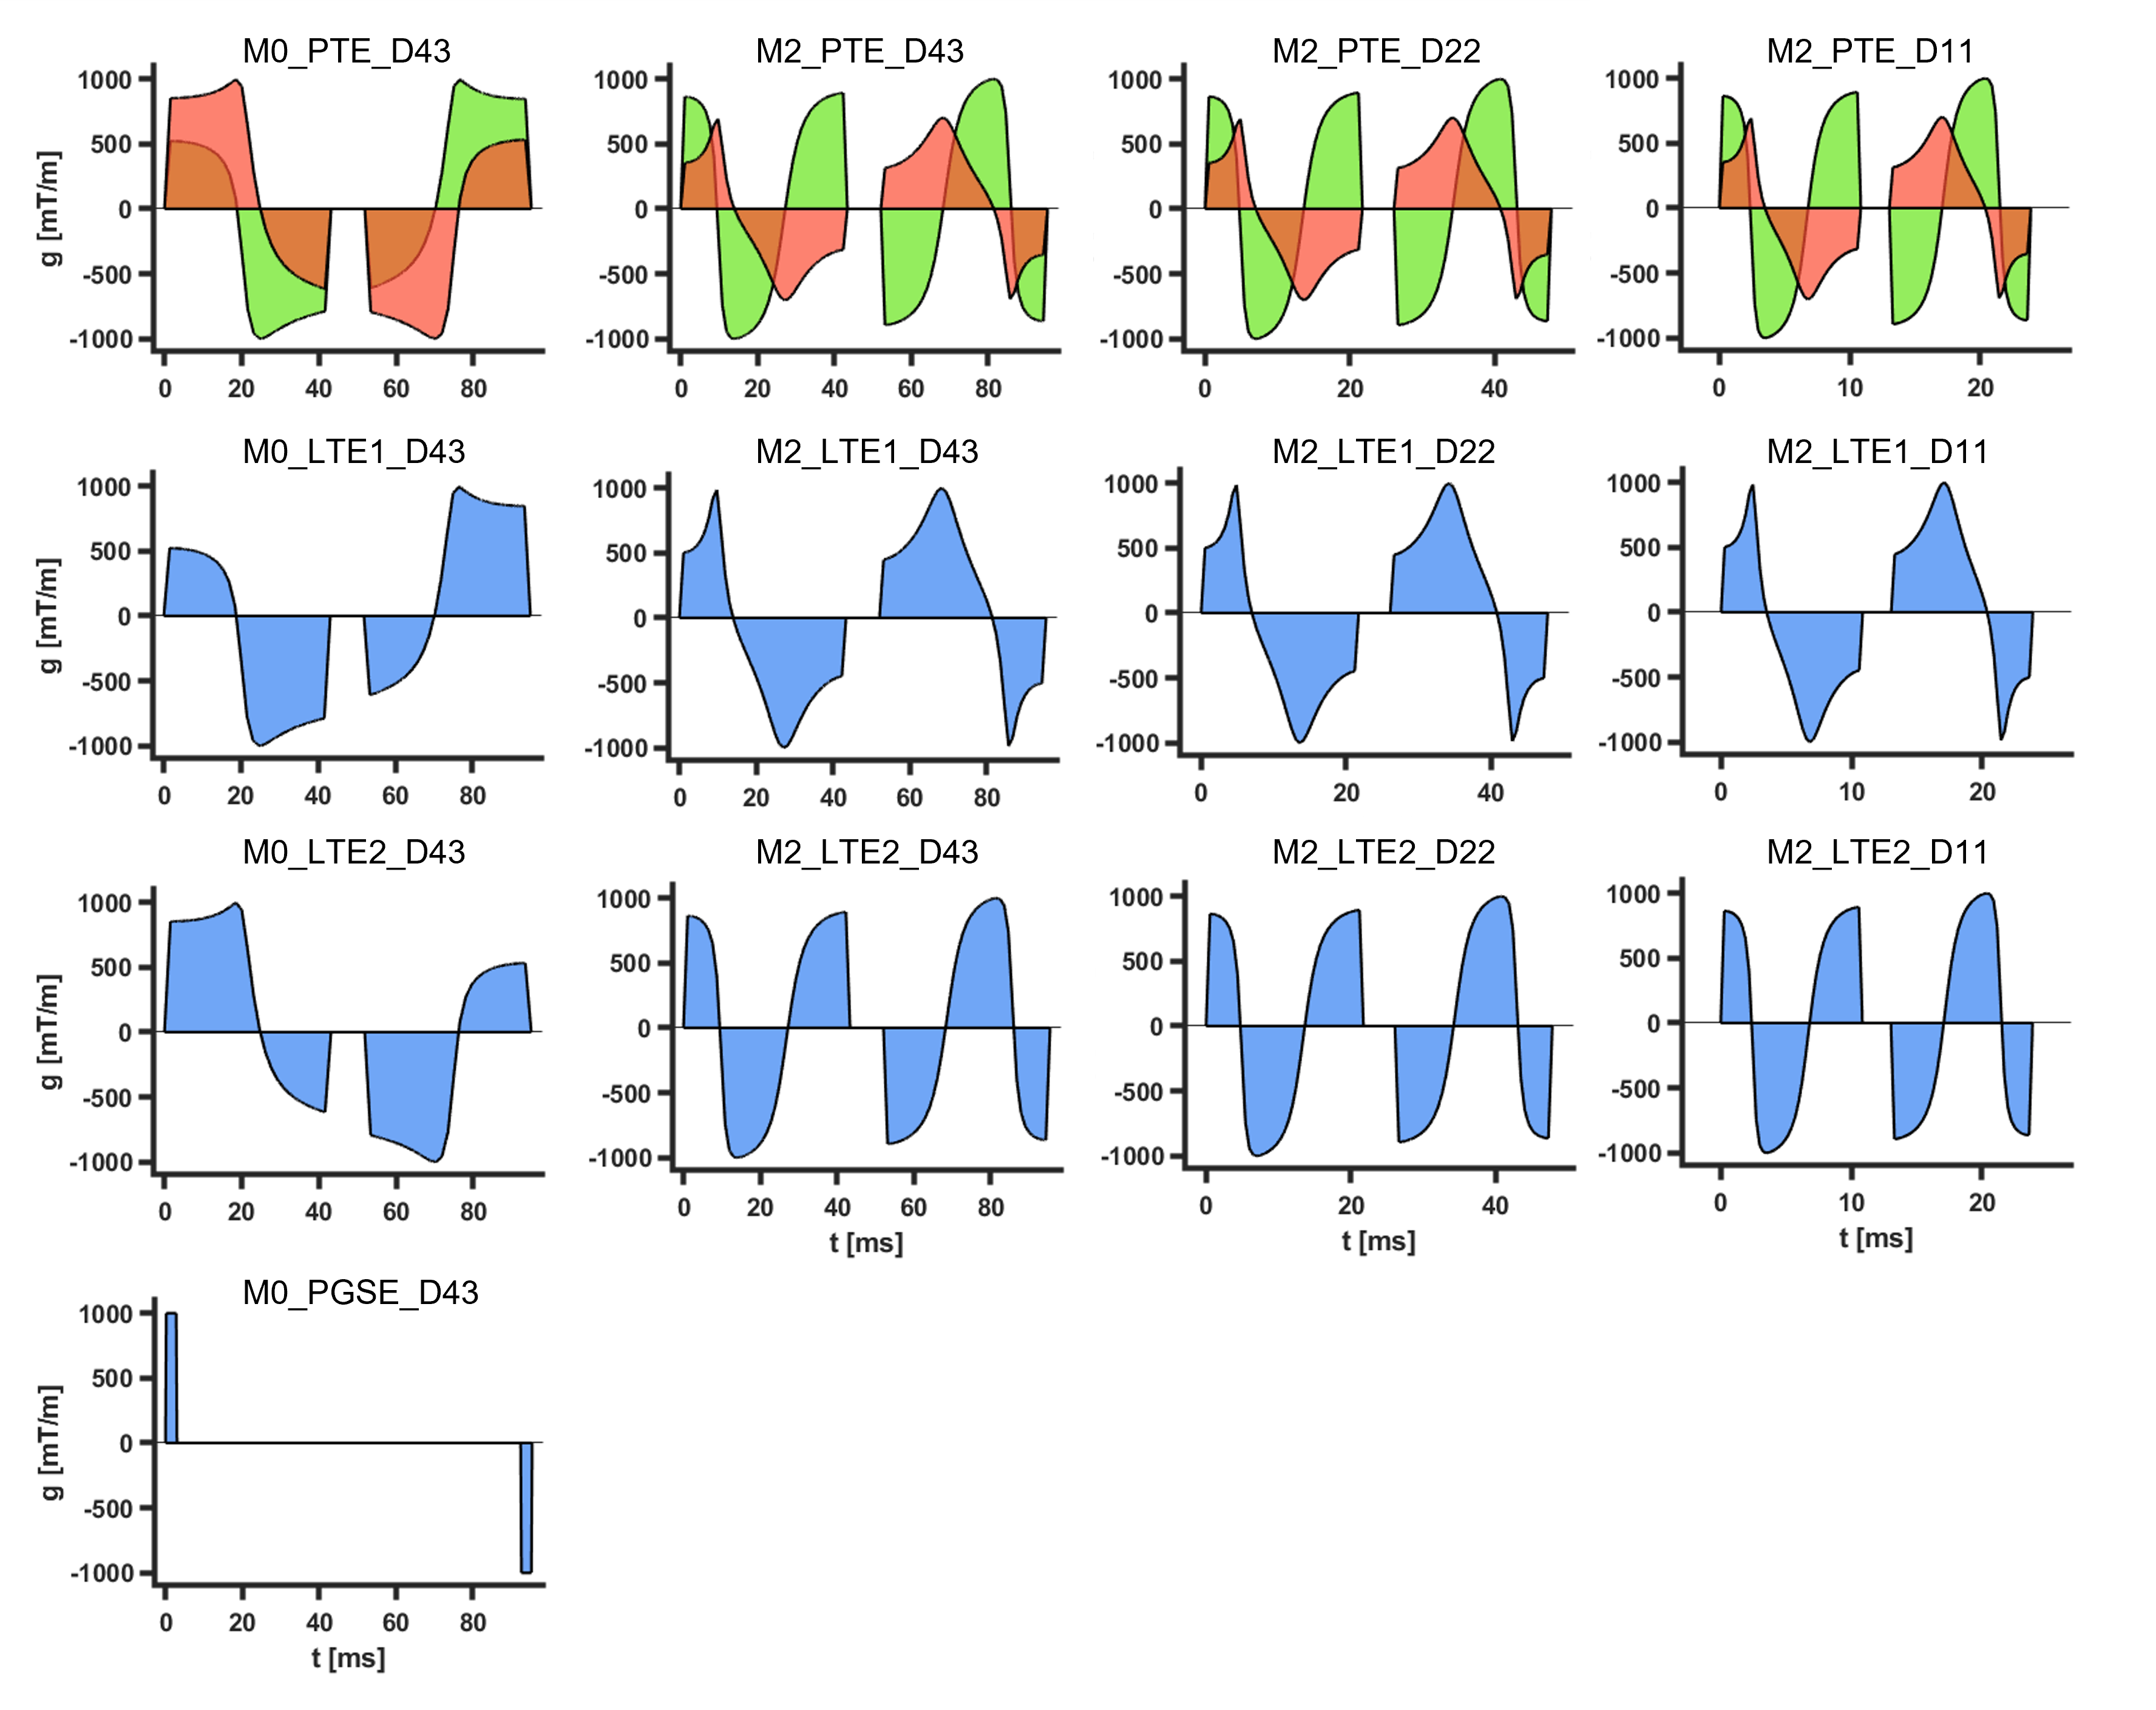
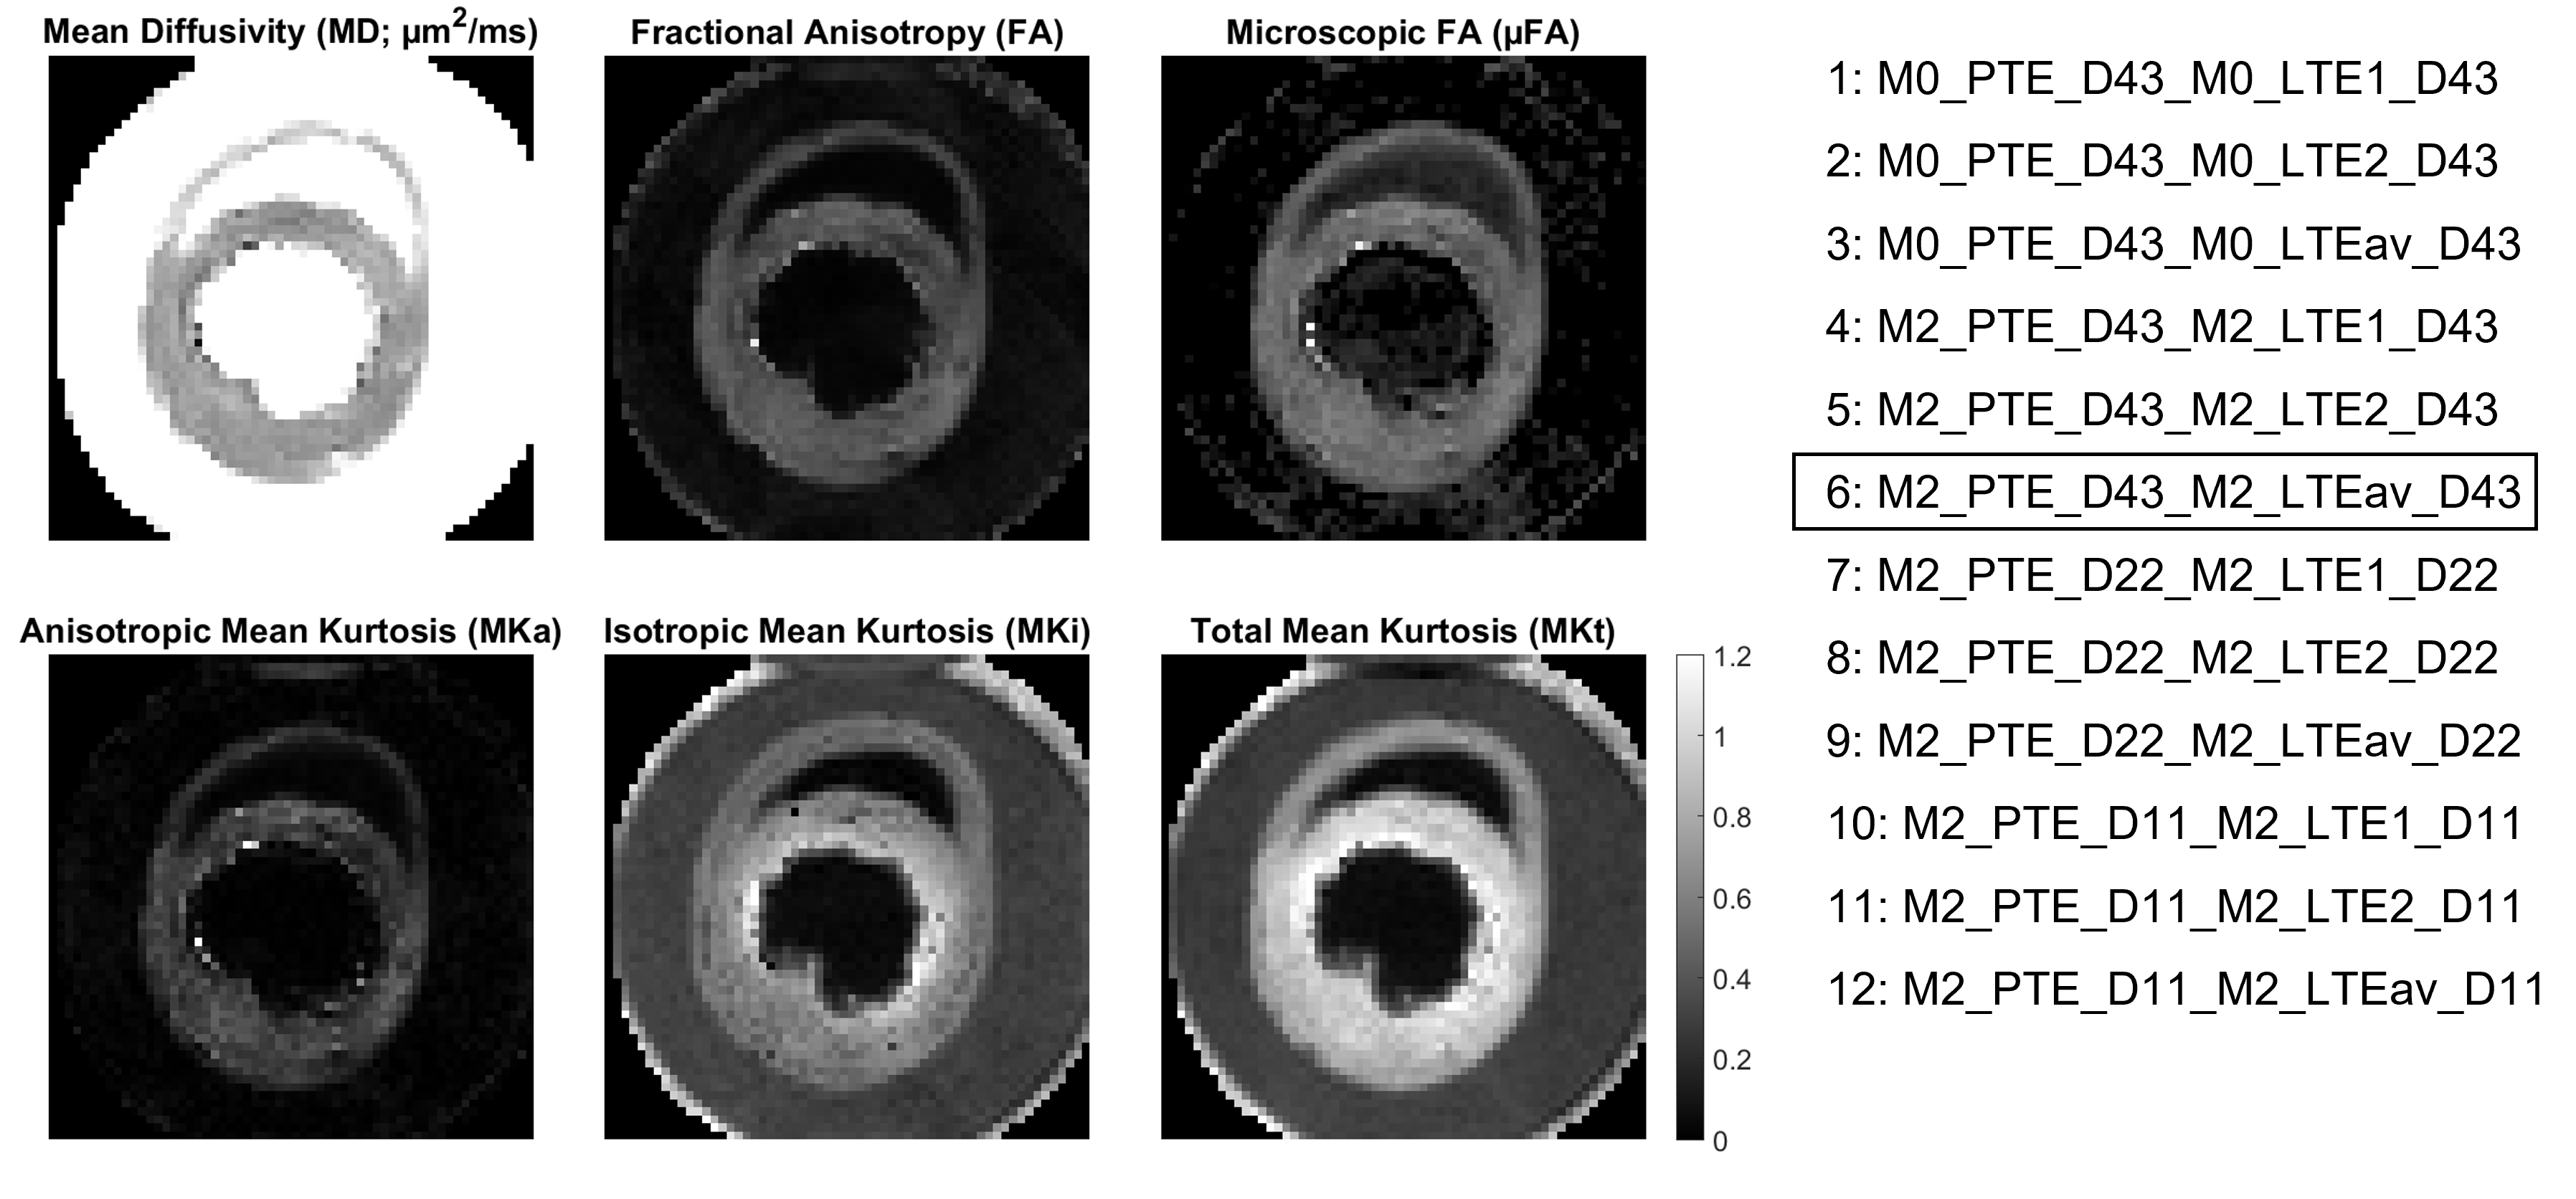
Hearts were excised from healthy Wistar rats (N = 3), arrested in slack state, perfusion and immersion fixed in paraformaldehyde, and embedded in 1.5% agarose PBS gel for imaging. All animal use was in accordance with UK Home Office authorisation. Data were acquired on a Biospec 7T MRI scanner (Bruker BioSpin MRI GmbH, Ettlingen, Germany) with a 1.5 T/m gradient system and 20 mm diameter transmit-receive volume coil. 2D multi-shot EPI were acquired TR = 3600 ms, TE = 124 ms, FOV = 16.8 × 16.8 mm, resolution = 280 × 280 µm, slice thickness = 2 mm, diffusion encoding directions = 21, b = [0.1 0.8 1.8 2.8] ms/µm2. Data were acquired with 17 waveforms (Figure 1) with varying degrees of motion compensation i.e. none (M0) or acceleration-nulled (M2), b-tensor shape (PGSE, PTE or LTE), and waveform block duration (11 to 43 ms). Gradient waveforms were generated in the open-source optimisation framework (https://github.com/jsjol/NOW)10, and characterised by the mean frequency11 of the power spectrum of the dephasing vector q(t). PTE waveforms were constituted of a long and a short diffusion time (td) waveform denoted LTE1 and LTE2. LTEav data were generated by geometrically averaging LTE1 and LTE2 data12. Data processing included Gibbs ringing removal13 and estimation of QTI parameters (MD, FA, µFA, MKi, MKa and MKt) within the multidimensional diffusion MRI framework14, based on 12 combinations of PTE + LTE (Figure 2). Data were reported across the left ventricular myocardium in a mid-ventricular short-axis slice. In addition, DTI parameters (MD, FA, AD and RD) were estimated from PGSE and LTE data with b ≤ 0.8 ms/µm2 data.Results
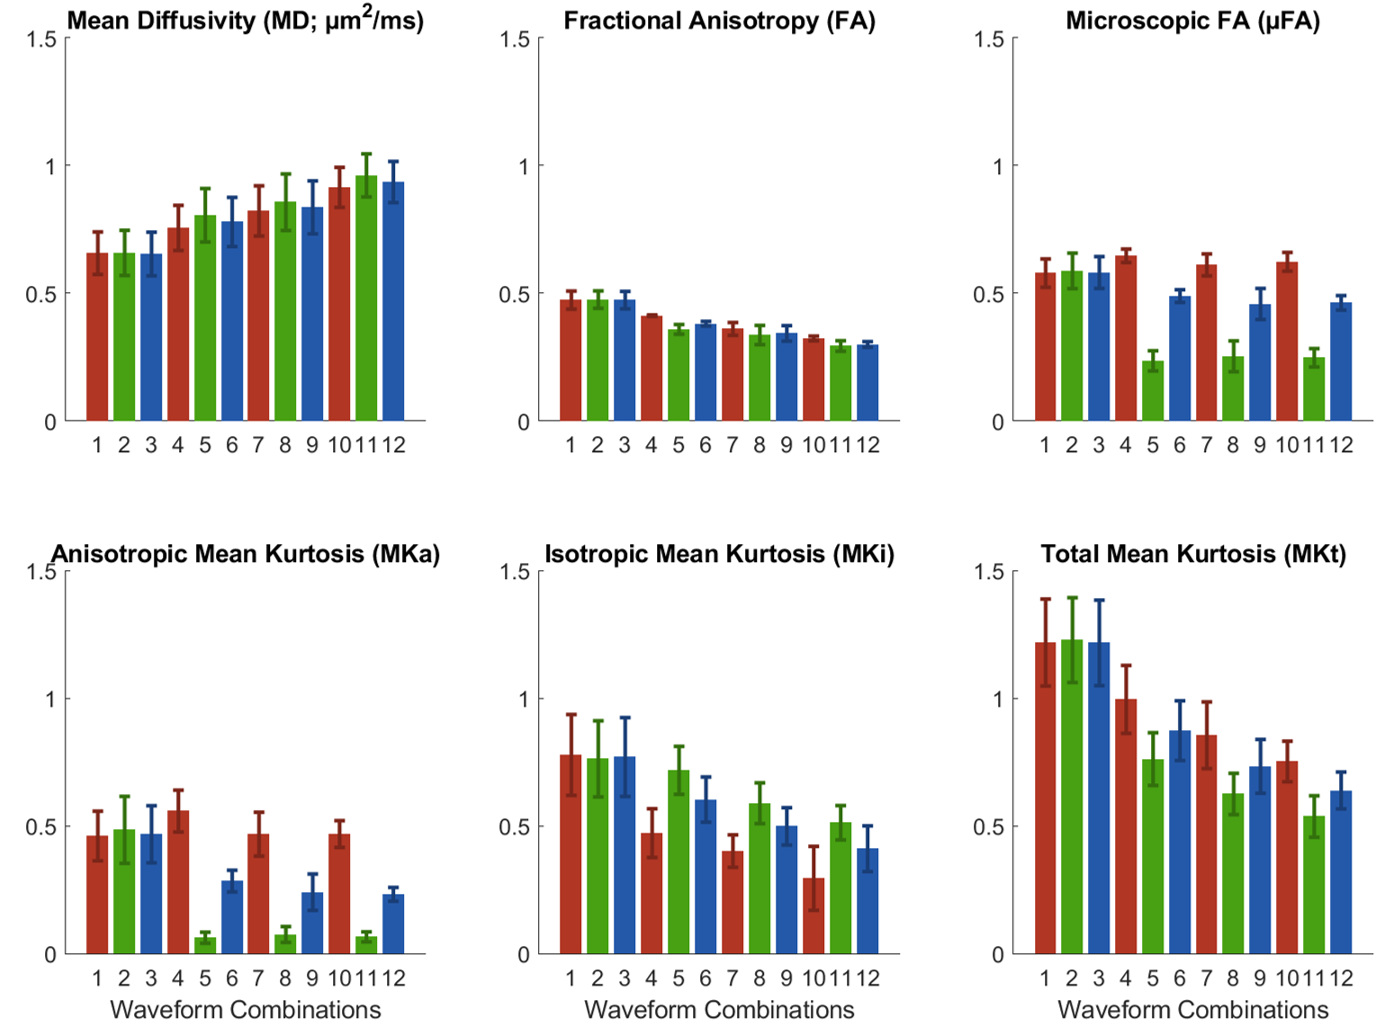
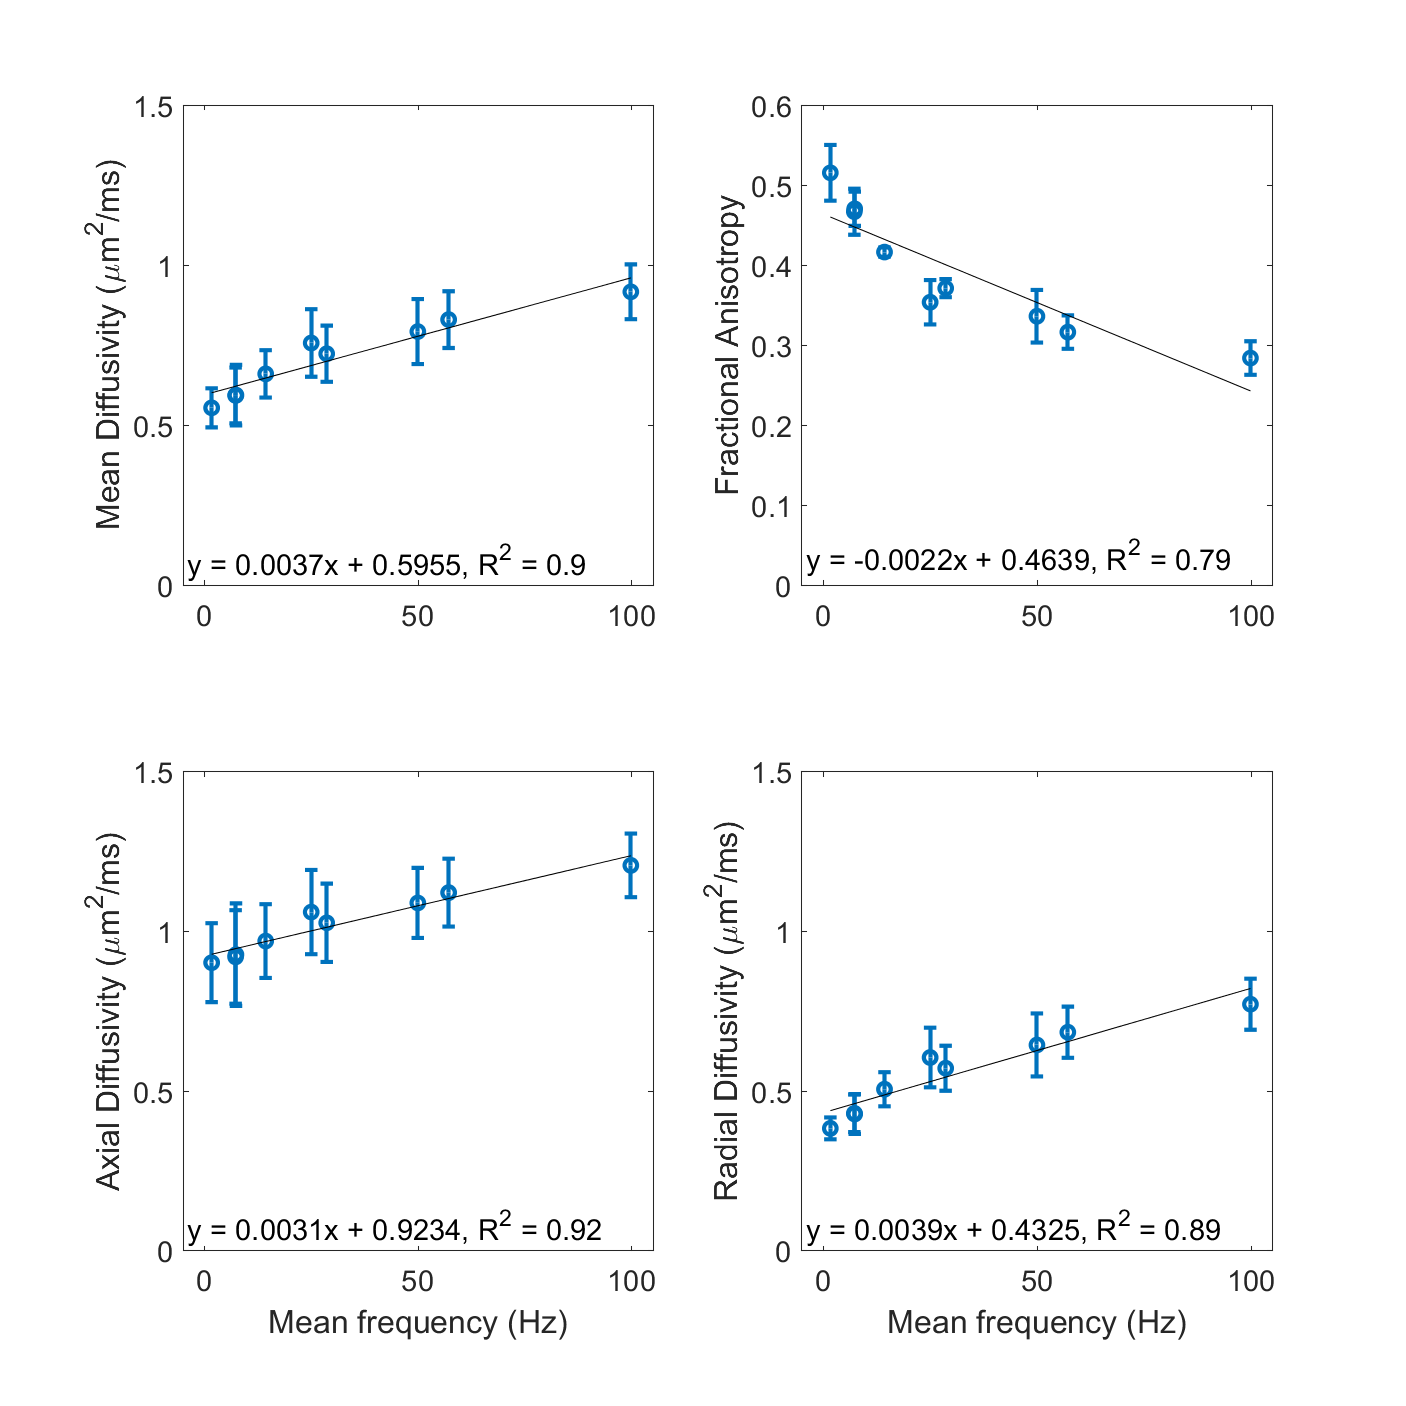
QTI maps are presented in a representative heart, using an example waveform combination of M2_PTE_D43 and M2_LTEav_D43 (Figure 2). We observed a general increase in MD and decrease in FA, µFA, MKi, MKa and MKt with mean frequency (Figure 3). When PTE was paired with LTE1 (long td), µFA, MKa, and MKt appeared to be overestimated. The reverse was observed when PTE was paired with LTE2 (short td). Combining PTE and LTEav yielded intermediate results. The three combinations with M0-nulling only (control) yielded similar results as expected, given similar mean frequencies of M0-nulled LTE1, LTE2 and LTEav. The DTI fitting showed that the MD, AD and RD increases while FA decreases as a function of frequency, and this dependence was largely linear over 1.6 – 100 Hz.Discussion
The measured QTI and DTI data provide support for restriction effects and time-dependent diffusion in the myocardium. When the encoding frequencies of the PTE and LTE waveforms are not matched, we see an apparent over/underestimation in all parameters, most prominently in µFA, MKa, MKi and MKt. Evidence of inaccurate estimates include, for example, µFA (low frequency) < µFA (high frequency), and MKa near zero. This is likely due to the invalid assumption of equal initial slope in the PTE and LTE signal attenuation. Bias can be reduced by matching of PTE and LTE encoding frequencies, as may be obtained using LTEav, or other tuning approaches12.A linear dependence of DTI parameters against frequency was observed. This was consistent with the data (≤ 100 Hz) in a previous study using oscillating gradients7. Based on that study, it is expected that MD and FA will approach an asymptote above 100 Hz, which may reflect diffusion in intracellular structures e.g. actin-myosin filaments. These findings require independent validation and verification in a larger sample size, which will be addressed in future work.
Conclusion
Time-dependent diffusion was observed and quantified in cardiac QTI ex vivo for the first time. We demonstrate potential bias from using non-frequency matched PTE and LTE, and suggest a possible solution by using LTEav. Furthermore, we employed up to 2nd-order motion compensation as a key step towards in vivo application. QTI at higher frequencies (≥ 100 Hz) may provide greater sensitivity to detect early changes in the intracellular environment in disease that precede changes in cardiomyocyte structure.Acknowledgements
We thank A/Prof Matthew Budde for the custom waveform pulse sequence used. This work was supported by the British Heart Foundation, UK (PG/19/1/34076, FS/13/71/30378, CH/16/2/32089). JES acknowledges funding from the Wellcome Trust 219536/Z/19/Z. SL and HL have received funding from the European Research Council (ERC) under the European Union’s Horizon 2020 research and innovation programme (grant agreement No 804746).References
1. Westin CF, Knutsson H, Pasternak O, Szczepankiewicz F, Ozarslan E, van Westen D, Mattisson C, Bogren M, O'Donnell LJ, Kubicki M, Topgaard D and Nilsson M. Q-space trajectory imaging for multidimensional diffusion MRI of the human brain. NeuroImage. 2016;135:345-62.
2. Szczepankiewicz F, Sjolund J, Stahlberg F, Latt J and Nilsson M. Tensor-valued diffusion encoding for diffusional variance decomposition (DIVIDE): Technical feasibility in clinical MRI systems. PloS one. 2019;14:e0214238.
3. Lasic S, Szczepankiewicz F, Eriksson S, Nilsson M and Topgaard D. Microanisotropy imaging: quantification of microscopic diffusion anisotropy and orientational order parameter by diffusion MRI with magic-angle spinning of the q-vector. Frontiers in Physics. 2014.
4. Teh I, Lasic S, Lundell H, Wereszczyńska B, Budde M, Dall'Armellina E, Yuldasheva N, Szczepankiewicz F and Schneider JE. Multidimensional Diffusion MRI in the Ex Vivo Mouse Heart. Proc Int Soc Magn Reson Med. 2021:3618.
5. Kim S, Chi-Fishman G, Barnett AS and Pierpaoli C. Dependence on diffusion time of apparent diffusion tensor of ex vivo calf tongue and heart. Magnetic resonance in medicine : official journal of the Society of Magnetic Resonance in Medicine / Society of Magnetic Resonance in Medicine. 2005;54:1387-96.
6. Froeling M, Mazzoli V, Nederveen AJ, Luijten PR and Strijkers GJ. Ex vivo cardiac DTI: on the effects of diffusion time and b-value. Journal of cardiovascular magnetic resonance : official journal of the Society for Cardiovascular Magnetic Resonance. 2014;16 (Suppl 1):P77.
7. Teh I, Schneider JE, Whittington HJ, Dyrby TB and Lundell H. Temporal Diffusion Spectroscopy in the Heart with Oscillatiing Gradients. Proc Int Soc Magn Reson Med. 2017:3114.
8. Farzi M, McClymont D, Whittington H, Zdora MC, Khazin L, Lygate CA, Rau C, Dall'Armellina E, Teh I and Schneider JE. Assessing Myocardial Microstructure with Biophysical Models of Diffusion MRI. IEEE transactions on medical imaging. 2021;PP.
9. Lasic S, Szczepankiewicz F, Dall'Armellina E, Das A, Kelly C, Plein S, Schneider JE, Nilsson M and Teh I. Motion-compensated b-tensor encoding for in vivo cardiac diffusion-weighted imaging. NMR in biomedicine. 2020;33:e4213.
10. Sjolund J, Szczepankiewicz F, Nilsson M, Topgaard D, Westin CF and Knutsson H. Constrained optimization of gradient waveforms for generalized diffusion encoding. Journal of magnetic resonance. 2015;261:157-68.
11. Arbabi A, Kai J, Khan AR and Baron CA. Diffusion dispersion imaging: Mapping oscillating gradient spin-echo frequency dependence in the human brain. Magnetic resonance in medicine : official journal of the Society of Magnetic Resonance in Medicine / Society of Magnetic Resonance in Medicine. 2020;83:2197-2208.
12. Lasic S, Just N and Lundell H. Spectral principal axes system (SPAS) and tuning of tensor-valued encoding for time-dependent anisotropic diffusion. Proc Int Soc Magn Reson Med. 2022:2509.
13. Kellner E, Dhital B, Kiselev VG and Reisert M. Gibbs-ringing artifact removal based on local subvoxel-shifts. Magnetic resonance in medicine : official journal of the Society of Magnetic Resonance in Medicine / Society of Magnetic Resonance in Medicine. 2016;76:1574-1581.
14. Nilsson M, Szczepankiewicz F, Lampinen B, Ahlgren A, de Almeida Martins JP, Lasic S, Westin CF and Topgaard D. An open-source framework for analysis of multidimensional diffusion MRI data implemented in MATLAB. Paper presented at: In: Proceedings of the 26th Annual Meeting of ISMRM, Paris; 2018.
Figures