5009
Multi-Scanner Reproducibility of IVIM Quantification in the Liver using Pseudo-Diffusion and Physical IVIM Signal Models1Radiology, University of Wisconsin-Madison, Madison, WI, United States, 2Medical Physics, University of Wisconsin-Madison, Madison, WI, United States
Synopsis
Keywords: Diffusion/other diffusion imaging techniques, Data Acquisition
Intravoxel incoherent motion (IVIM) quantification in the liver suffers from instability associated with separating multiple decaying signal components sampled along a single dimension (b-value). In this work, monopolar and 2D (b-value and first-order motion moment (M1)) noise-optimized IVIM-DWI acquisitions were acquired on three MR scanners with different MR gradient hardware. From each acquisition, IVIM estimates were obtained using pseudo-diffusion and physical (M1 dependent) IVIM signal models. Inter-scanner reproducibility and interlobar agreement were compared across acquisitions and models. 2D (b-M1) IVIM-DWI acquisitions combined with physical IVIM signal modeling improved reproducibility of IVIM quantification in comparison to monopolar acquisitions and pseudo-diffusion modeling.Introduction
Intravoxel incoherent motion (IVIM) quantification in the liver suffers from instability associated with separating multiple decaying signal components sampled along a single dimension (i.e., b-value) in the presence of noise. Recently, 2D (b-value and first-order motion moment (M1)) noise-optimized IVIM-DWI data acquisitions have been proposed,1 as well as a Blood Velocity standard deviation Distribution (BVD) fitting method,2 which estimates IVIM parameters within spatially distinct locations. These recently proposed methods have demonstrated substantially improved test-retest repeatability1,2 and reproducibility across diffusion gradient waveforms3 of IVIM quantification in comparison to conventional monopolar acquisitions and ROI-based fitting. Therefore, the purpose of this work was to evaluate multi-scanner reproducibility of IVIM quantification in the liver using 2D (b-M1) data acquisitions and BVD fitting.Methods
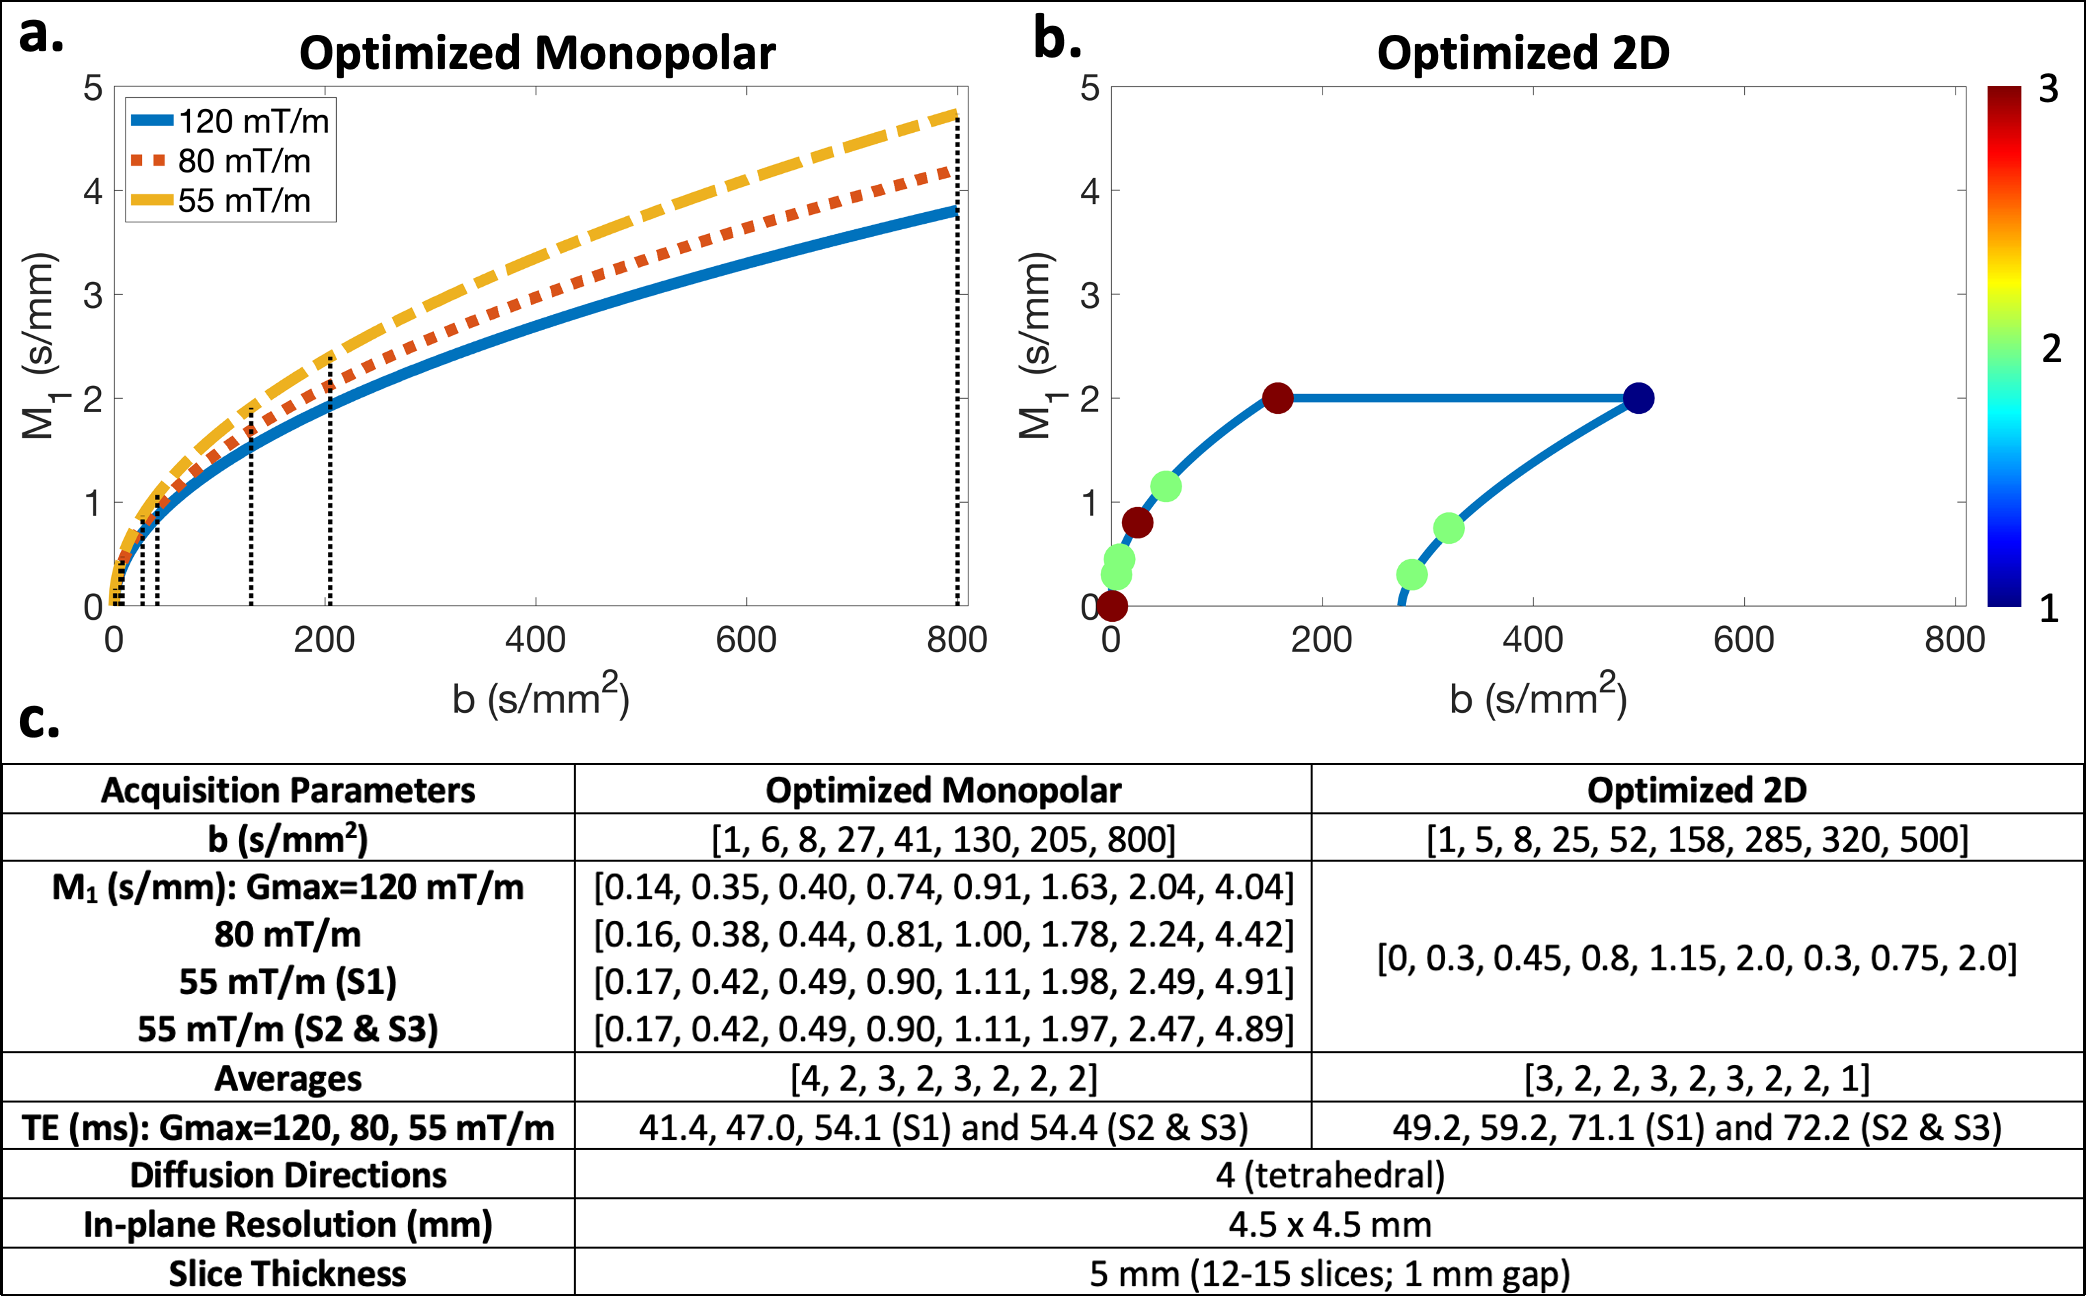
Acquisition optimization: Based on the physical IVIM signal model proposed by Ahlgren et al.4 (which contains b and M1 dependence), Cramer-Rao lower bound optimization was performed to determine optimized monopolar and optimized 2D (b-M1) IVIM-DWI data samplings (i.e., points in b-M1-space) (Figure 1). Optimized samplings were determined using the pulse sequence timings and hardware constraints of a 3T Signa Premier scanner (GE Healthcare) (henceforth referred to as S3) with maximum gradient amplitude (Gmax) of 120 mT/m. For the 2D sampling, M1 was constrained to less than 2 s/mm to mitigate the effects of cardiac-induced motion in the left lobe.For each sampling, diffusion gradient waveforms were designed for three different GE Healthcare MR scanners using three different Gmax: 1.5T Signa Artist (S1) (Gmax = 55 mT/m), 3T Signa PET/MR (S2) (Gmax = 55 mT/m), and S3 (Gmax = 55, 80, and 120 mT/m).
MR acquisition: With IRB approval and informed consent, eight (n=8) healthy volunteers underwent liver MR exams on each of the three scanners listed above. The determined optimized monopolar (Figure 1a) and optimized 2D (Figure 1b) IVIM samplings were acquired for each set of waveforms described above using respiratory triggering and the parameters given in Figure 1c.
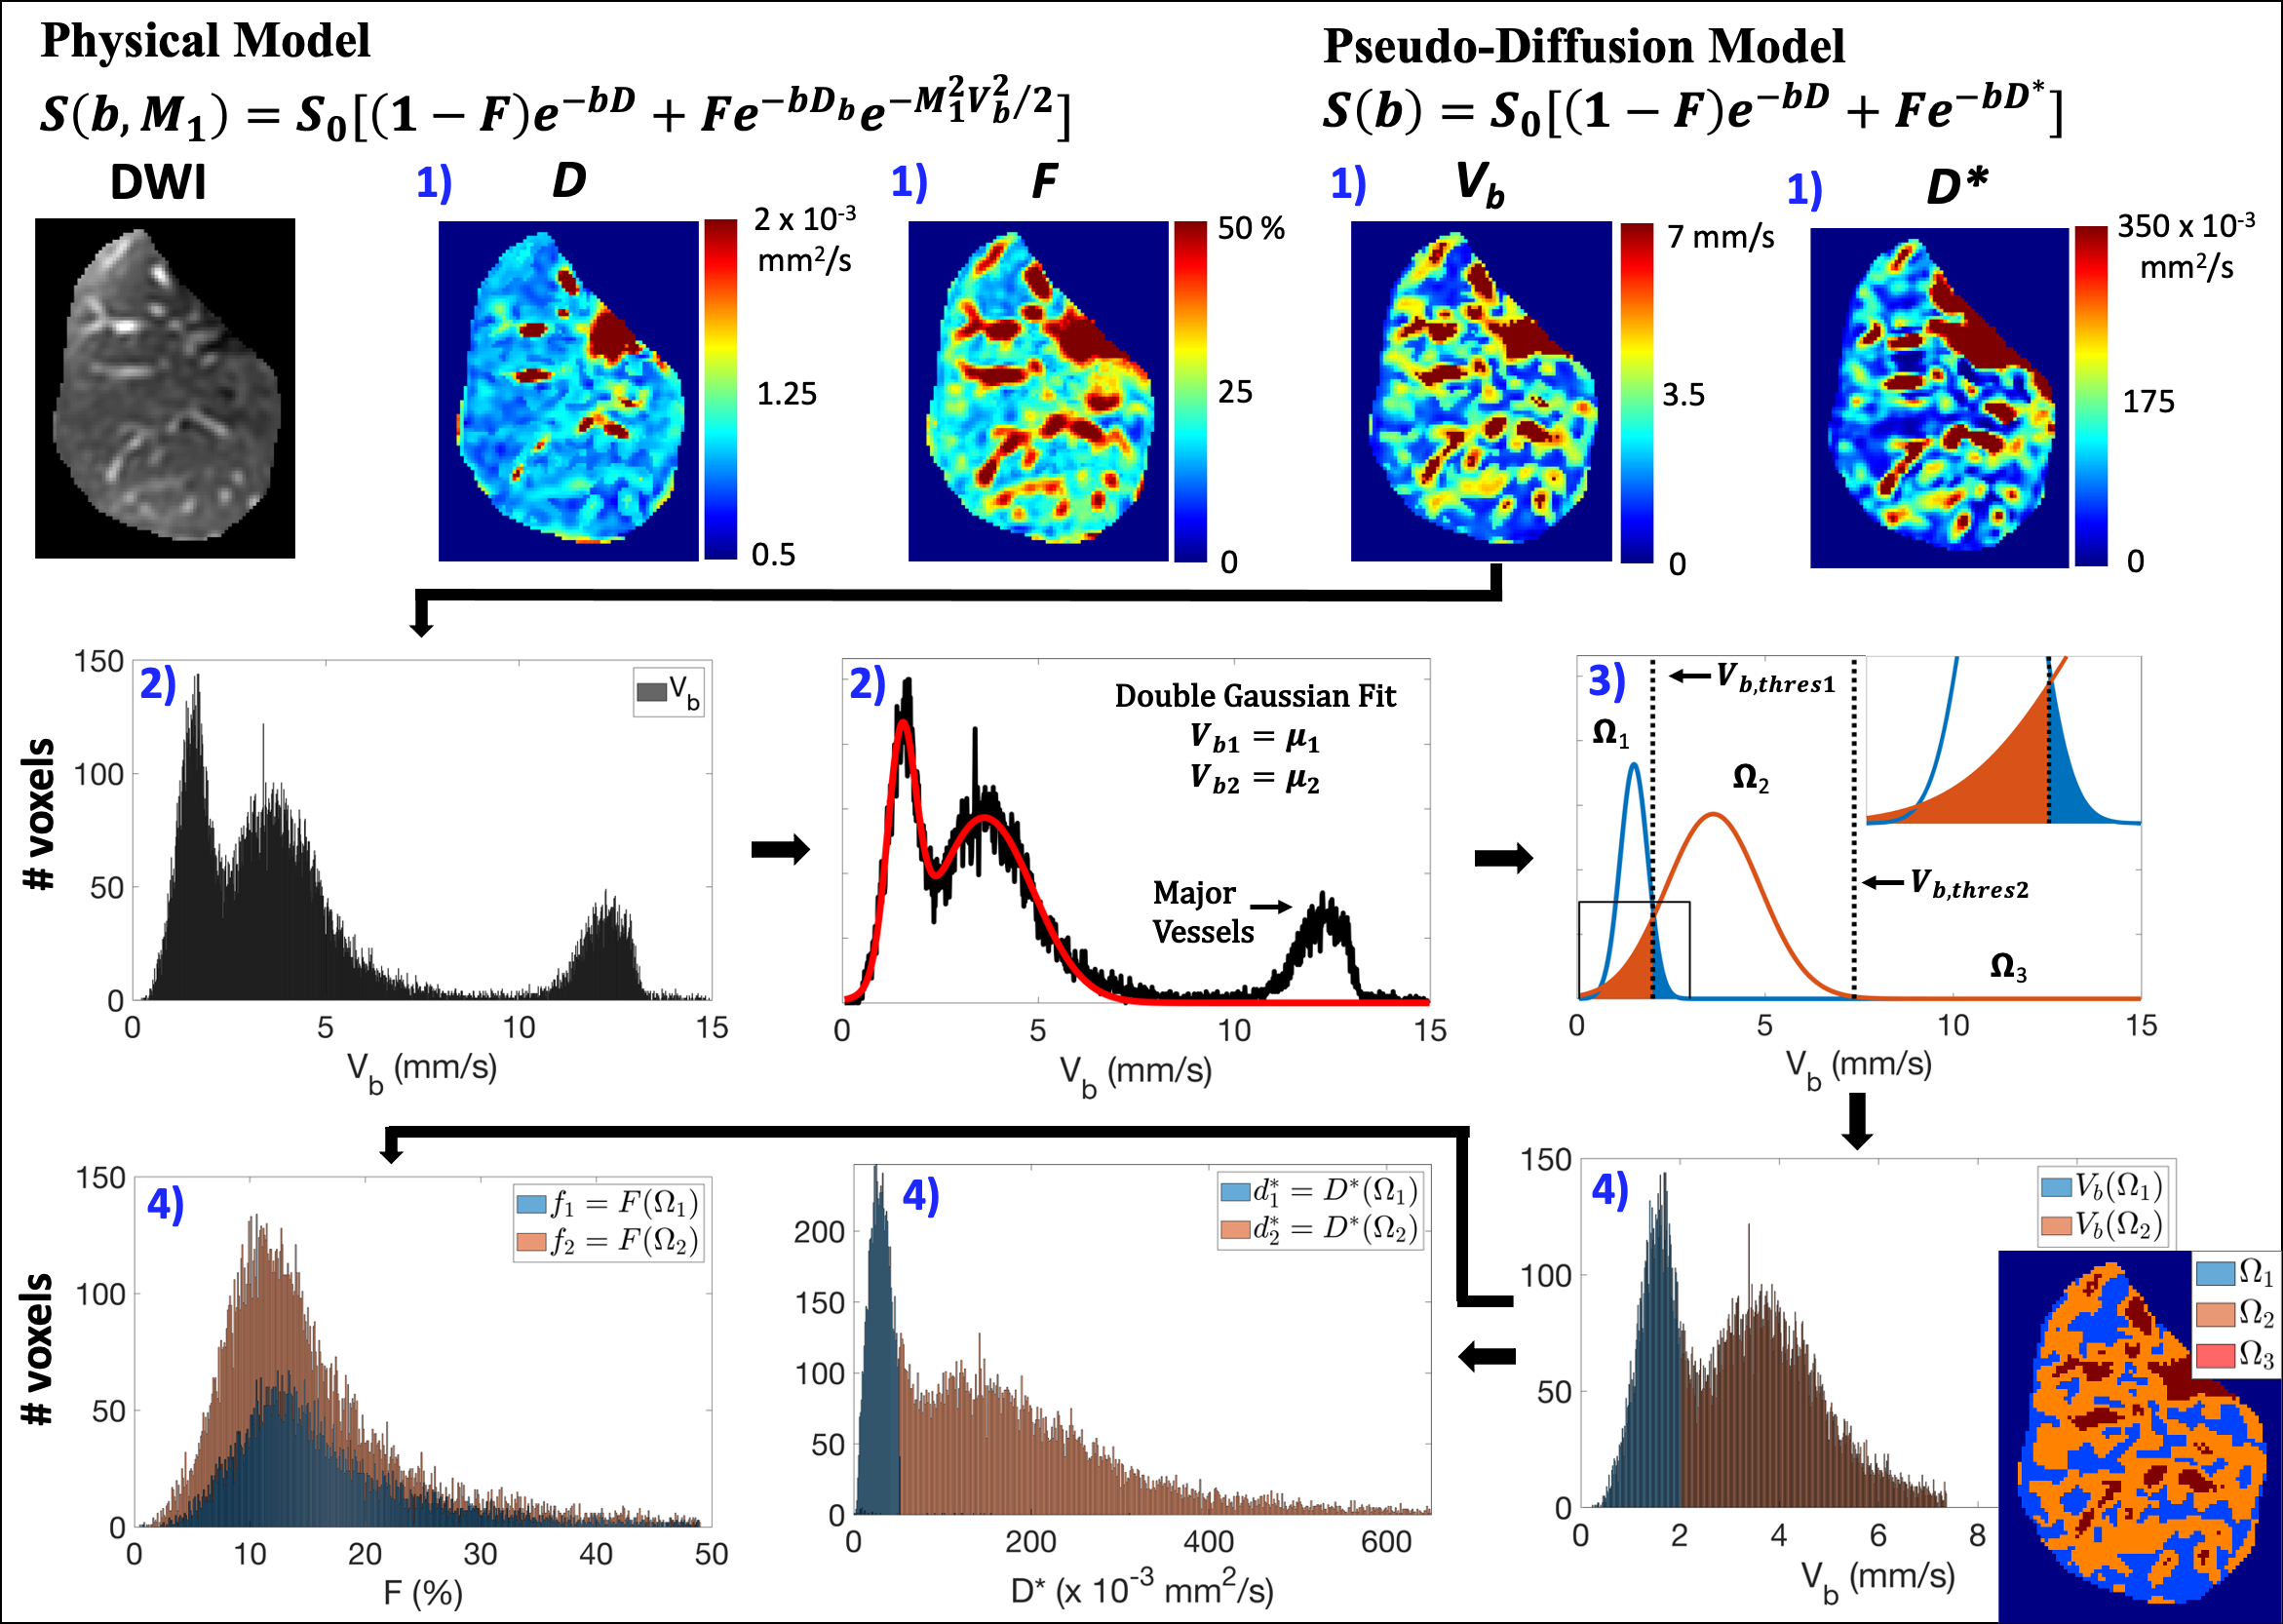
Data analysis: ROIs of the whole liver, including major vessels, were manually segmented and then divided into separate right and left lobe ROIs. For each ROI, IVIM estimates were obtained from voxelwise bi-exponential parameter maps using BVD fitting2 (see Figure 2 for details). BVD fitting is based on the observation of a multi-modal spatial distribution of the blood velocity standard deviation (Vb) and has been shown to improve test-retest repeatability in comparison to ROI-based fitting.2 From this multi-modal distribution, the liver was separated into three spatial locations (Ω1, Ω2, and Ω3), and IVIM estimates of Vb1 and Vb2, perfusion fractions (f1 and f2), pseudo-diffusion coefficients ($$$d_1^*$$$ and $$$d_2^*$$$), and the diffusion coefficient (D) were determined within Ω1/2. IVIM estimates were not determined within Ω3 since this spatial location corresponded to major vessels.
Reproducibility and interlobar agreement of the estimated parameters were evaluated using within-subject coefficients of variation (CVw=std/mean*100%), pair-wise coefficients of variation (CVp=std of differences/mean of all measurements*100%), mean differences, and paired sample t-tests (significance level ⍺=0.05).
Results
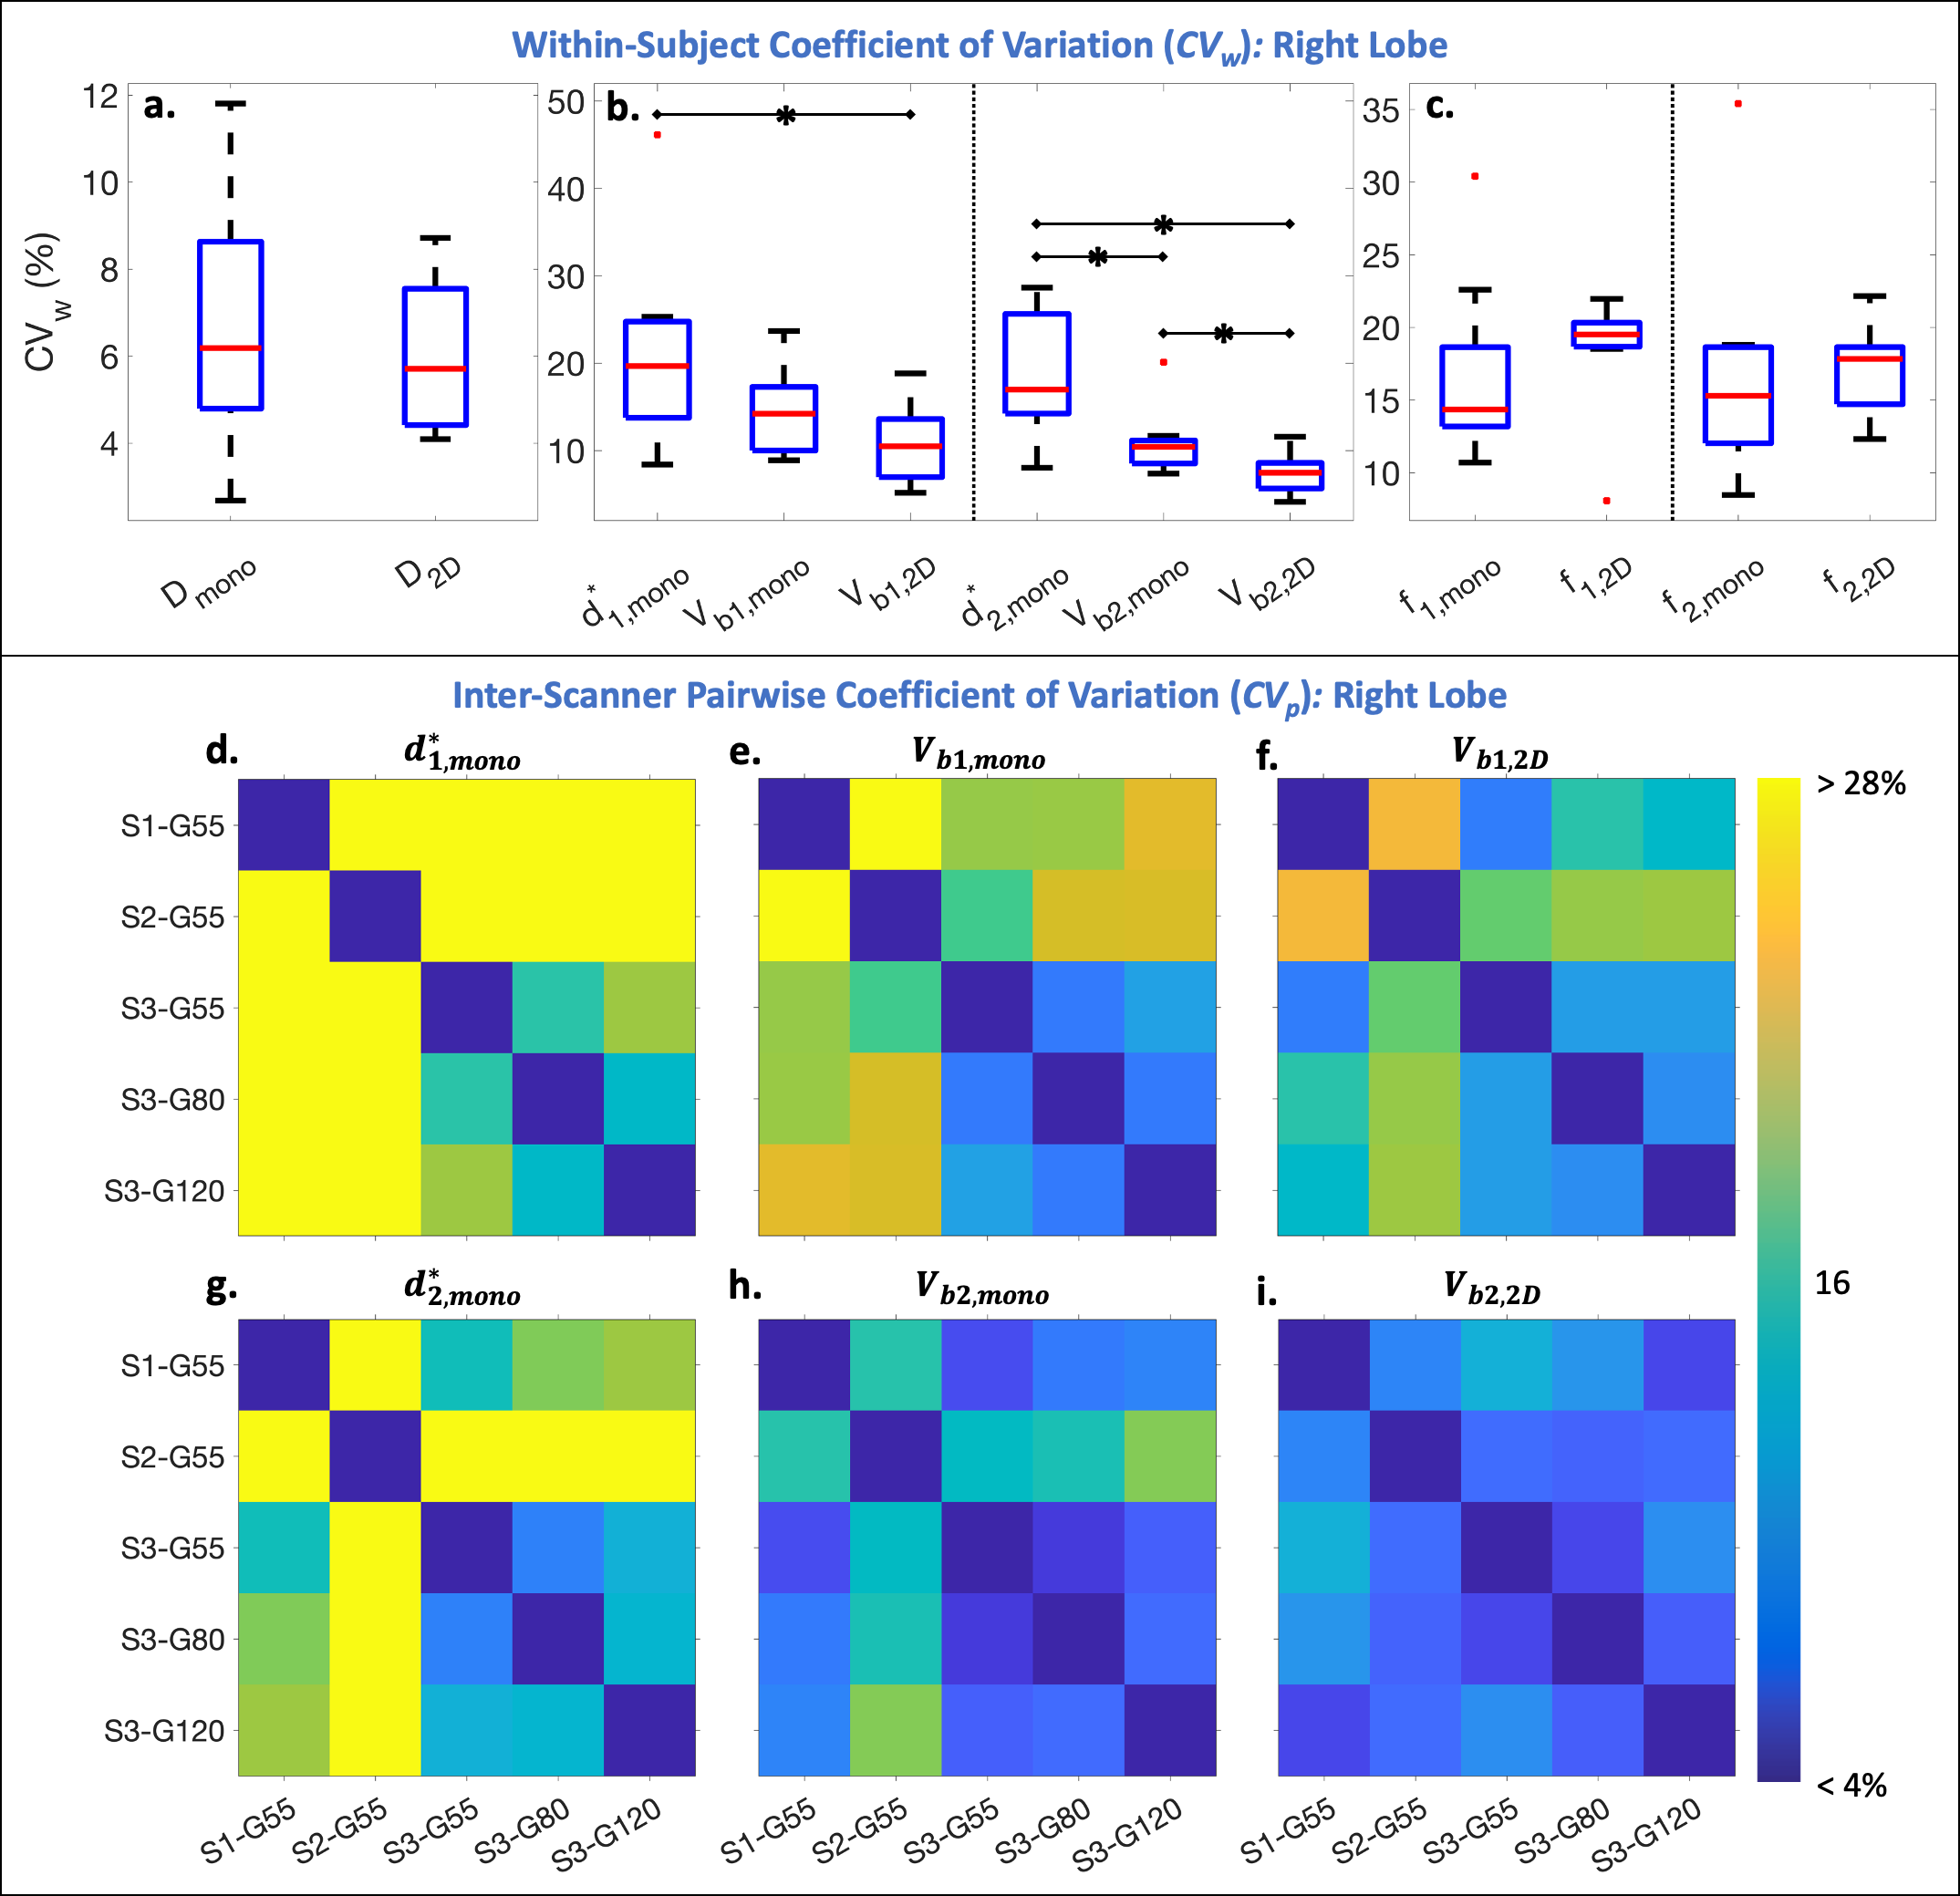
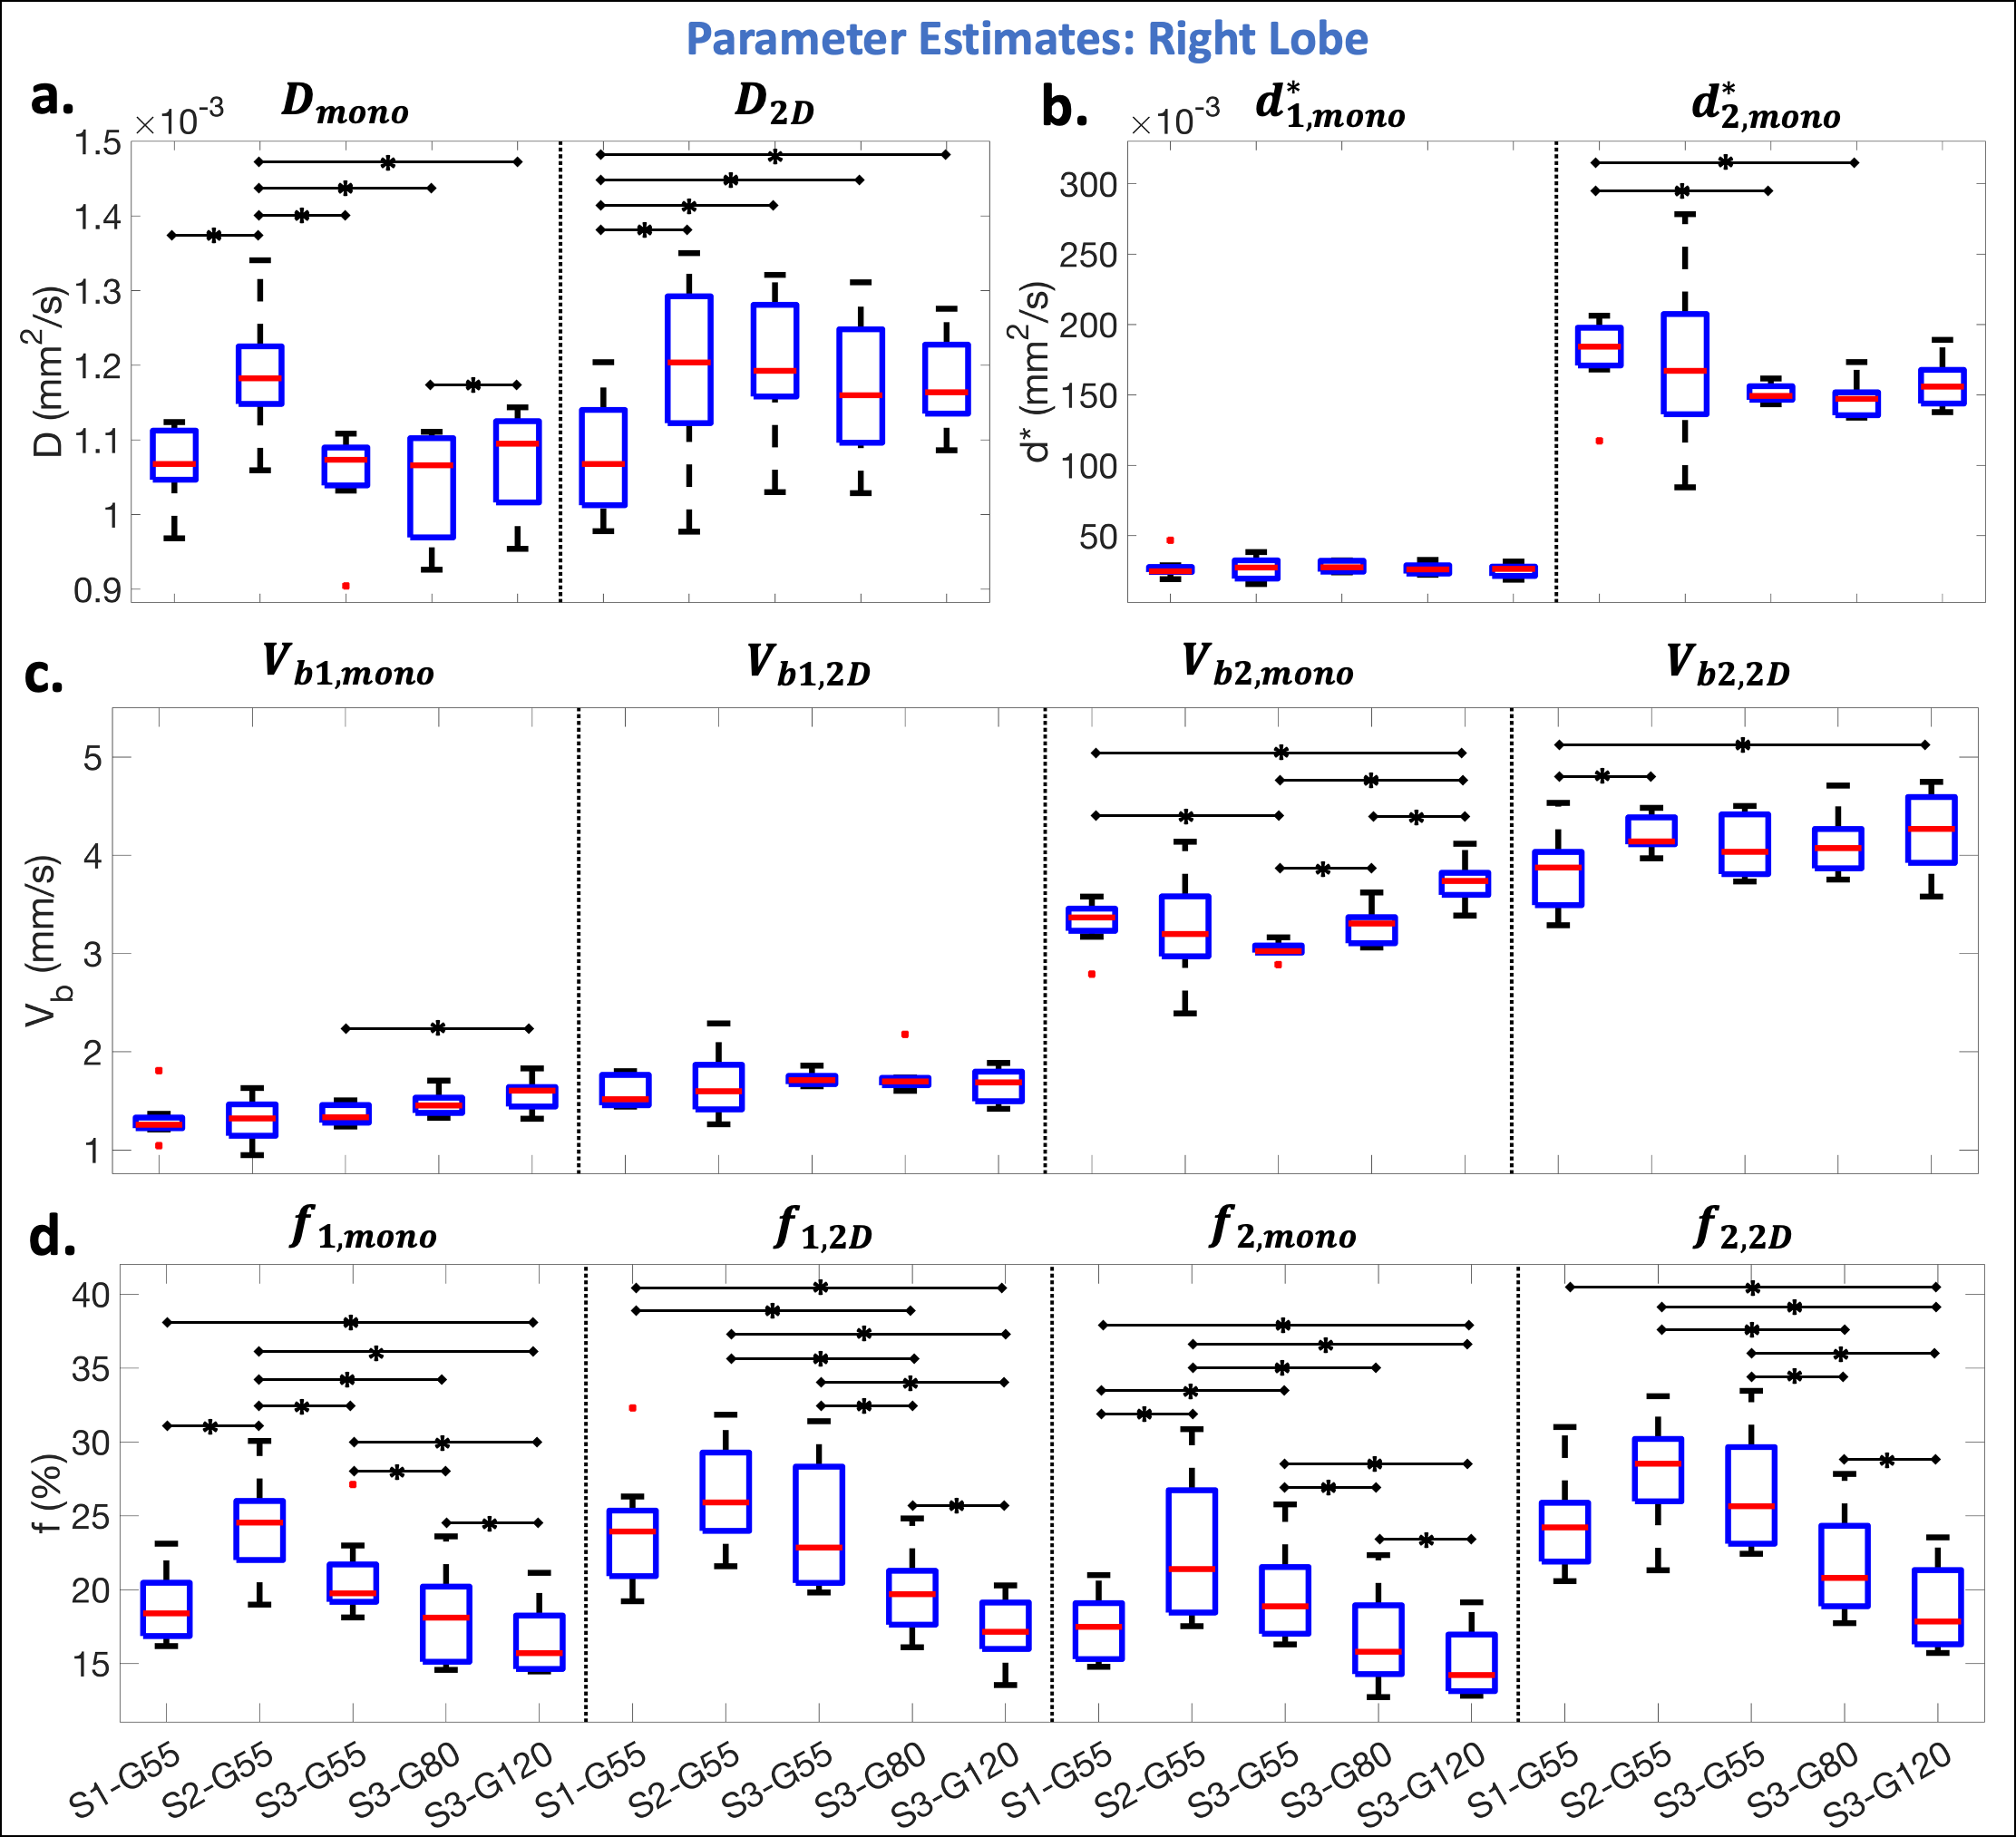
In the right liver lobe, significantly (p<0.05) lower CVw were observed for Vb1,2D and Vb2,2D in comparison to $$$d_{1,mono}^*$$$ and $$$d_{2,mono}^*$$$ (Figure 3b). Lower inter-scanner CVp were also observed in the perfusion decay estimates obtained using the 2D acquisition (Figure 3f,i) in comparison to the monopolar acquisition (Figure 3d,e,g,h).Significantly (p<0.05) larger estimates of Dmono and significantly lower estimates of D2D were observed for S2 and S1, respectively, in comparison to the other scanners (Figure 4a). Fewer significant differences were observed between scanners for Vb1,2D and Vb2,2D in comparison to Vb1,mono and Vb2,mono (Figure 4c). Estimates of f increased with decreasing Gmax (increasing TE) (Figure 4d).
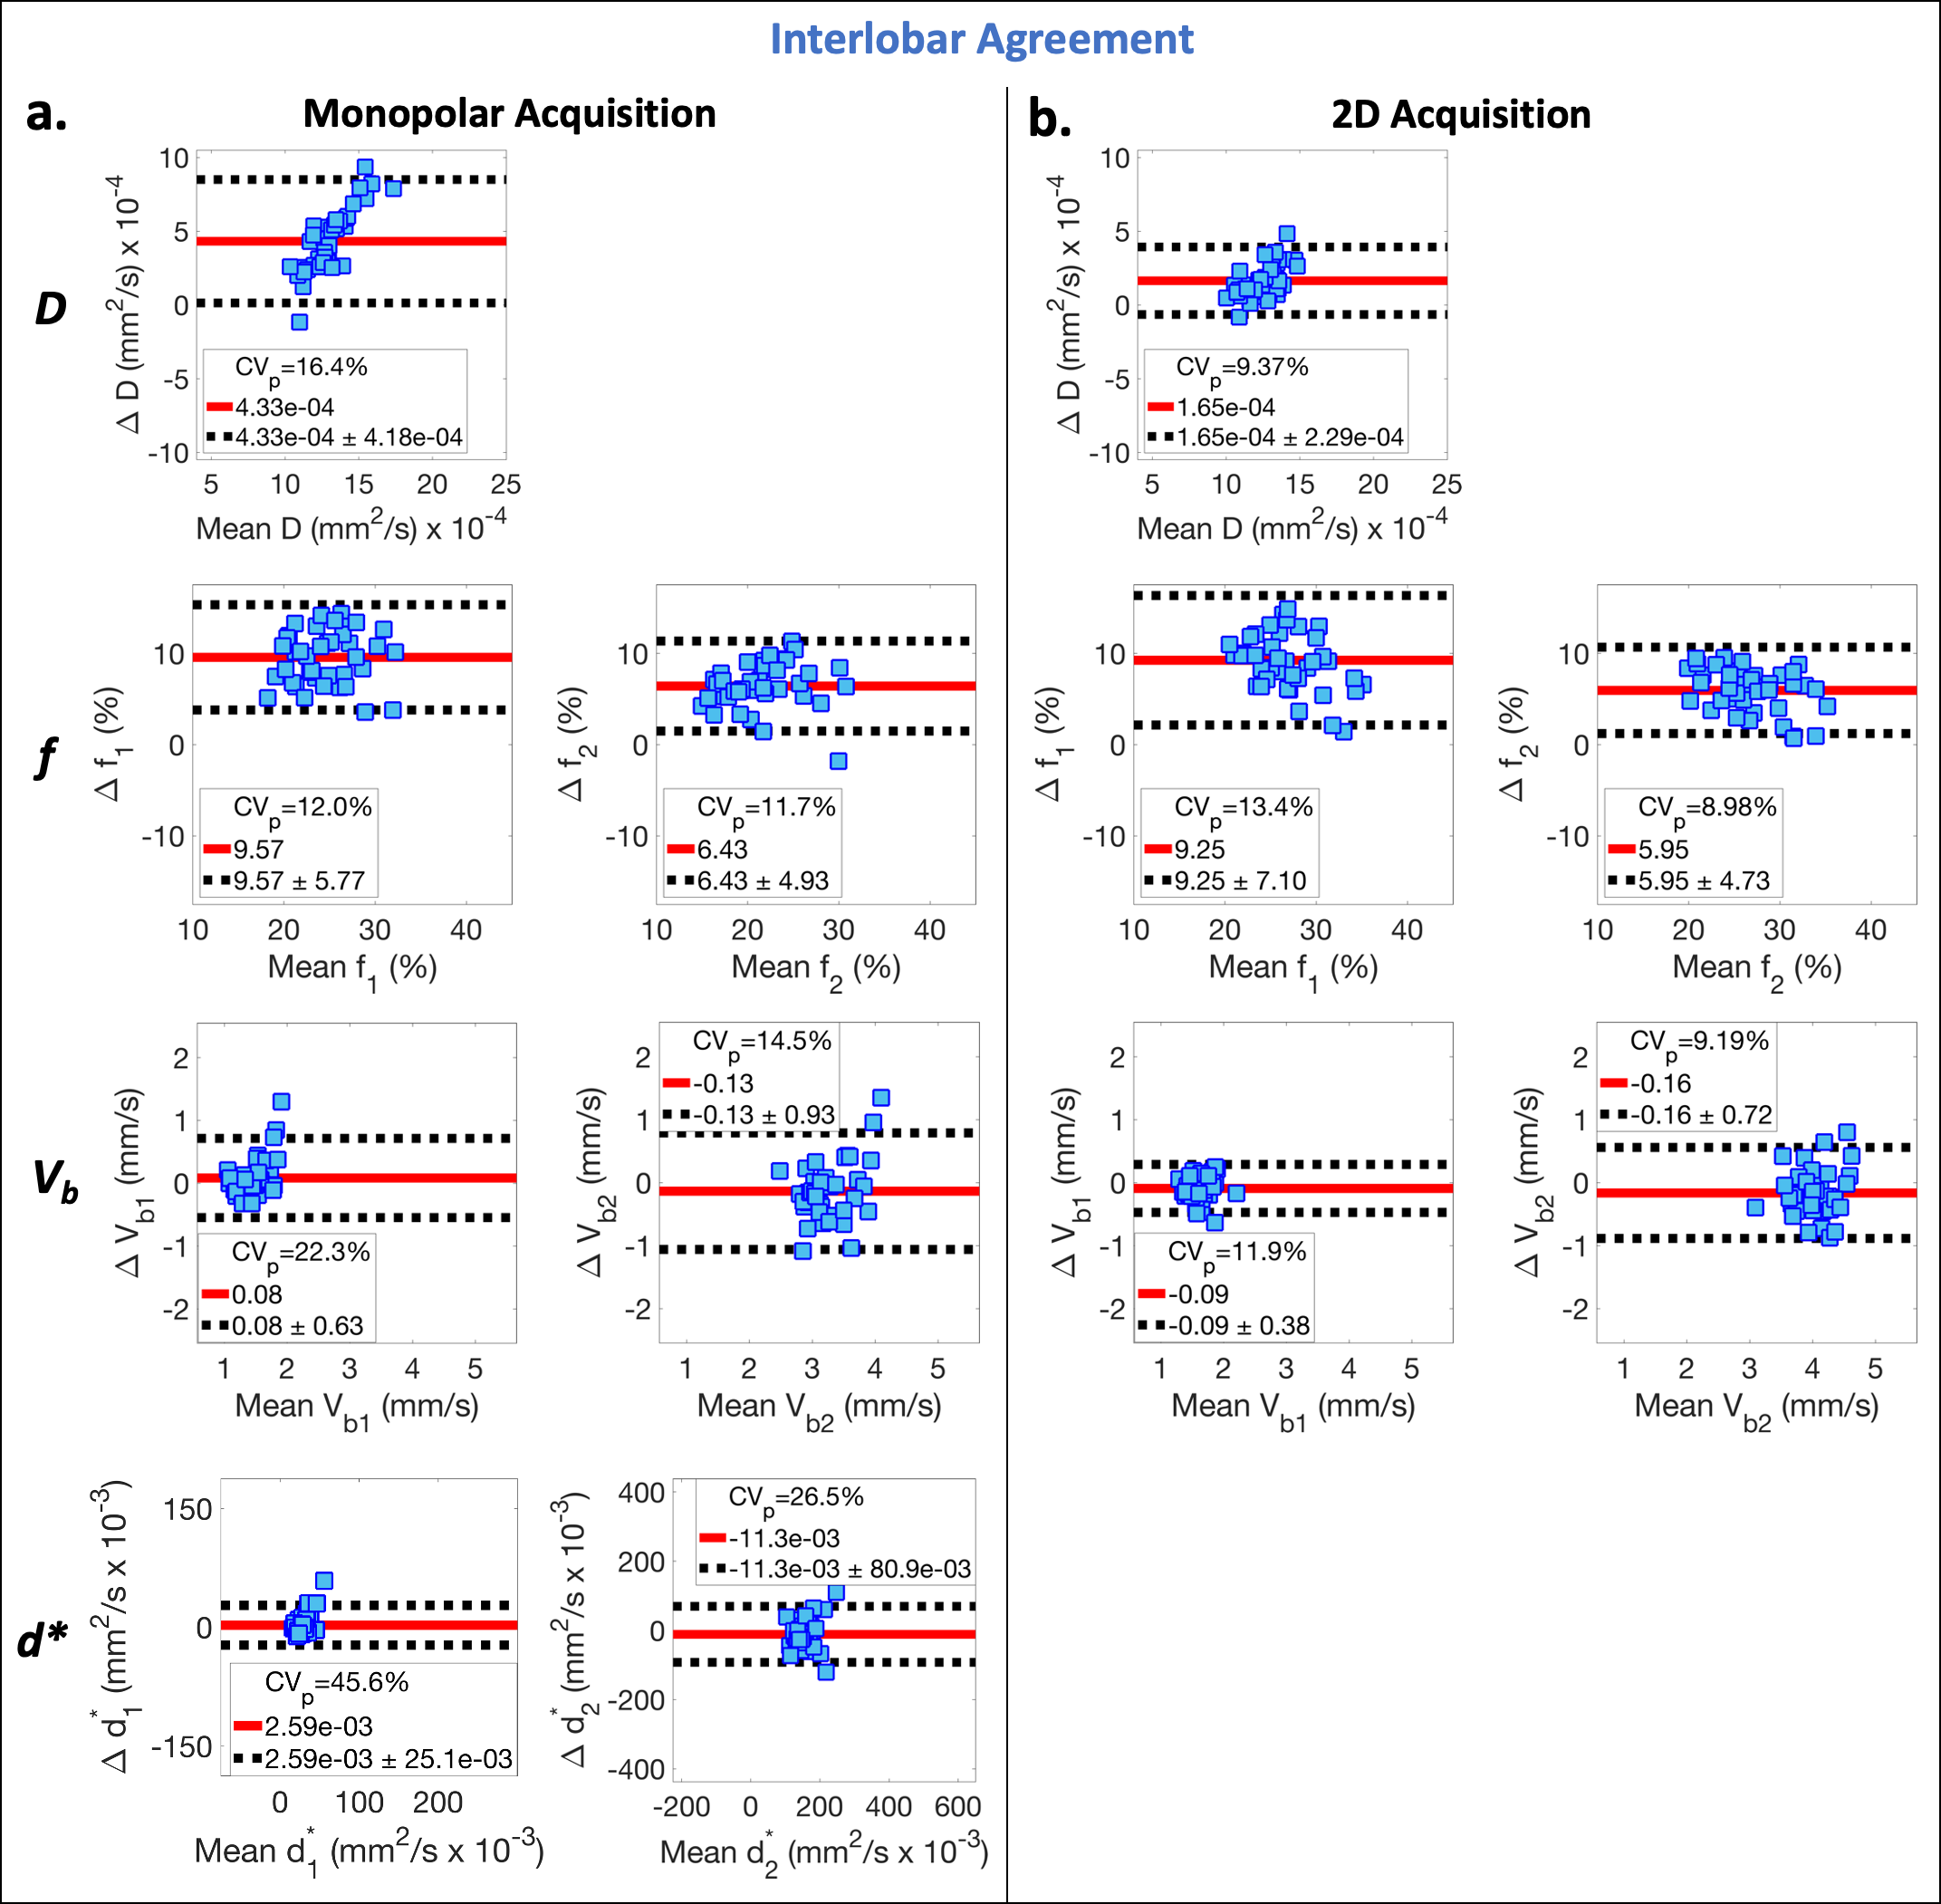
Evaluating inter-lobar agreement, lower CVp were observed in the estimates of D and Vb using the 2D acquisition (CVp ≤ 11.9%) (Figure 5b) in comparison to monopolar estimates of D, d*, and Vb (CVp ≥ 14.5%) (Figure 5a). Lower mean difference was also observed in D (=1.65x10⁻³ and 4.33x10⁻³ mm2/s, for the 2D and monopolar acquisitions, respectively).
Discussion
In this work, the 2D (b-M1) data acquisition demonstrated improved reproducibility in comparison to the monopolar acquisition. By using diffusion gradient waveforms with low M1 values (low motion sensitivity), the 2D acquisition was also able to reduce the bias in the estimates of D in the left lobe caused by cardiac-induced motion in comparison to right lobe estimates.In this work, estimates of Vb demonstrated better reproducibility in comparison to estimates of d*, suggesting that using a physical IVIM signal model that includes M1 dependence, instead of a pseudo-diffusion model, may improve the reproducibility of IVIM quantification.
Estimates of f increased with decreasing Gmax (increasing TE), which is likely due to confounding effects of T2 relaxation and has previously been reported.5,6 Since F is a signal fraction and may be hardware dependent (through T2-weighting), reproducibility across scanners was not expected.
Limitations of this work include evaluation of reproducibility in healthy volunteers only and the use of a large voxel size, which may be adequate for evaluation of diffuse liver disease, but inadequate for focal disease.
Conclusion
2D (b-M1) IVIM-DWI acquisitions combined with physical IVIM signal modeling improves the reproducibility of IVIM quantification across field strengths, scanners with different gradient hardware, and liver lobes.Acknowledgements
The authors acknowledge support from the NIH (R01-EB030497), the University of Wisconsin-Madison Office of the Vice Chancellor for Research and Graduate Education with funding from the Wisconsin Alumni Research Foundation, as well as from the UW Departments of Radiology and Medical Physics. GE Healthcare also provides research support to the University of Wisconsin.References
1. Simchick G, Geng R, Zhang Y, Hernando D. b value and first‐order motion moment optimized data acquisition for repeatable quantitative intravoxel incoherent motion DWI. Magnetic Resonance in Medicine. 2022;87(6):2724-2740.
2. Simchick G, Hernando D. Precision of region of interest‐based tri‐exponential intravoxel incoherent motion quantification and the role of the Intervoxel spatial distribution of flow velocities. Magnetic Resonance in Medicine. 2022;88(6):2662-2678.
3. Simchick G, Hernando D. Reproducibility of IVIM Quantification Across Diffusion Gradient Waveforms using Pseudo-Diffusion and Physical IVIM Signal Models. In Proceedings of the 30th Annual Meeting of ISMRM, London. 2022.
4. Ahlgren A, Knutsson L, Wirestam R, et al. Quantification of microcirculatory parameters by joint analysis of flow‐compensated and non‐flow‐compensated intravoxel incoherent motion (IVIM) data. NMR in Biomedicine. 2016;29(5):640-649.
5. Führes T, Riexinger AJ, Loh M, et al. Echo time dependence of biexponential and triexponential intravoxel incoherent motion parameters in the liver. Magnetic resonance in medicine. 2022;87(2):859-871.
6. Jerome NP, d’Arcy JA, Feiweier T, et al. Extended T2-IVIM model for correction of TE dependence of pseudo-diffusion volume fraction in clinical diffusion-weighted magnetic resonance imaging. Physics in Medicine & Biology. 2016;61(24):N667.
Figures