5007
Optimized diffusion-prepared 3D-MRF for rapid high-resolution whole-brain T1, T2, proton density, ADC and FA mapping1Department of Radiology, Stanford university, Stanford, CA, United States, 2Department of Electrical Engineering, Stanford university, Stanford, CA, United States, 3Center for Brain Imaging Science and Technology, Department of Biomedical Engineering, Zhejiang University, Hangzhou, China, 4Department of Electrical Engineering and Computer Science, MIT, Cambridge, MA, United States, 5Department of Bioengineering, Stanford university, Stanford, CA, United States, 6Department of Clinical Neuroscience, Karolinska Institute, Solna, Sweden, 7Department of Imaging Sciences, University of Rochester, Rochester, NY, United States
Synopsis
Keywords: Diffusion/other diffusion imaging techniques, Brain
In this work, a diffusion preparation was implemented into the 3D spiral-projection MRF sequence to introduce additional diffusion weighting and enables whole-brain T1, T2, PD, ADC and FA mapping with 1-mm isotropic resolution within 10min. To maximize the diffusion signal and image-encoding efficiency, a diffusion-preparation without an amplitude stabilizer is employed, where robustness against phase variations is achieved using a combination of M1-compensated encoding, cardiac-gating, and an eddy-current compensating pre-pulse gradient. The MRF acquisition scheme and subspace reconstruction were also modified to enable effective data sharing across diffusion directions, which increase acceleration capability and improve mapping quality.Introduction
MRF1 has been extended for quantification of multiple parameters, such as diffusivity2,3, velocity4 and T2*5 and several 3D-MRF techniques6–8 have been developed.In our last works3, we deployed diffusion-preparation(DP) with M1-compensated encoding and cardiac-gating into the 3D-SPI-MRF9,10 to enable whole-brain 1.25-mm T1&T2&PD&diffusivity mapping for one diffusion direction in 3-min.
In this work, we significantly improve the acquisition and reconstruction to enable diffusion-tensor-imaging(DTI) in a faster timeframe. However, eddy-currents from the strong diffusion-encoding gradients could cause significant phase variations in the diffusion-encoded Mxy leading to undesirable magnitude attenuation in the tip-up Mz (note: amplitude-stabilizer-gradient is not employed in this work as it was shown to markedly reduce DP-MRF’s SNR and encoding efficiency3). To overcome this, a pre-pulse11 gradient is introduced to compensate eddy-current. Additionally, to shorten scan time and improve DTI mapping, a novel data-sharing acquisition and reconstruction scheme is proposed.
To the best of our knowledge, this is the first time that FA mapping was obtained in in-vivo human brain imaging using diffusion-preparation without amplitude-stabilizer for MRF or for any other DP-sequence.
Method
Sequence: Fig1A shows the DP-MRF sequence diagram including a PG trigger12, an M1-compensated diffusion-preparation13 module, an adiabatic inversion preparation, and 600 variable-FA acquisitions(Fig1B) with TR=12.5m and 3s wait time (1s before inversion and 2s before the next group), resulting in a net acquisition per group of 10.5s. For 1-mm isotropic resolution acquisition across FOV of 220×220×220mm3, 8 acquisition groups were obtained in 84s per diffusion direction plus additional cardiac trigger waiting time about 4-8s. b=600s/mm2 was applied with a preparation time of 50ms under the Gmax=60mT/m for diffusion gradients.In comparison to our previous work3, several modifications were made:
1. A pre-pulse gradient used for eddy-current compensation (green box in Fig1A) was added. The eddy-current from this pre-pulse is used to compensate ones generated by the diffusion-encoding gradients. To characterize the eddy-current-caused phase and the optimal amplitude of the pre-pulse needed to compensate it, a spin-echo diffusion was created to acquire DWI images at b=0&600s/mm2, where the optimal amplitude could be determined by finding the one that minimizes the phase difference between b=0&600s/mm2 acquisitions.
2. Data sharing strategy(Fig1E) was implemented to accelerate the acquisition. With 6 diffusion directions used in this work, only 8 SPI-MRF groups were acquired per direction at 1mm resolution(compared to 18 groups at 1.25-mm data in our previous work3). To obtain high-quality images at such high acceleration, for the subspace reconstruction of each diffusion direction, we proposed to utilize data from the first 100 TRs after the DP of that particular diffusion direction along with data from all the TRs acquired after the inversion pulse from all acquisition groups across diffusion directions. This data sharing provides improved spatio-temporal encoding per diffusion direction and boost reconstruction performance.
3. To ensure that this data sharing would not create a bias in the quantitative mapping, an additional waiting time of 1s was added before the inversion pulse, so that the signal evolution curves of the 101st-600th TRs become decoupled from the diffusion encoding(Fig1C).
4. Resolution was improved from 1.25-mm to 1-mm isotropic.
5. ECG trigger was replaced with finger pulse trigger(PG) for more convenient scanning setup.
6. With robustness to phase-errors achieved, navigators were longer needed in the sequence. Removing them increases acquisition efficiency.
The same methods were used in dictionary generation and reconstruction as our previous works3.
Validation: Two healthy volunteers were scanned on 3T-scanner. For validation, conventional 3D-SPI-MRF was also acquired to provide reference T1&T2 maps and conventional DWI SE-EPI was acquired to provide reference ADC and FA maps.
Results
Fig2A shows the phase difference and Fig2B shows an approximately linear relationship between the amplitude of the pre-pulse and the average phase difference. By taking advantage of this linearity, phase difference measurement was obtained at a few different amplitudes settings and interpolation was used to find the amplitude level that provides optimal correction. For example, for the 1st diffusion direction with diffusion vector of [1,0,1] shown in Fig2C, approximately -10mT/m for Gx and -15mT/m for Gz direction were used for the pre-pulse gradient.Fig3 shows the phase difference maps and e-bD maps for six diffusion directions. Without eddy-current compensation(Fig3A), some directions(1st&3rd) show strong phase difference, which causes obvious bias in e-bD maps compared to ones using SE-EPI. With the pre-pulse(Fig3B), the phase difference is minimized which mitigates the bias in e-bD maps.
Fig4A shows phantom results of the T1&T2&e-bD maps obtained using the proposed DTI-MRF(top) compared with reference maps(bottom), where T1&T2 maps were acquired using conventional 3D-SPI-MRF and diffusivity map using DWI SE-EPI, as well as the corresponding mean values and standard deviations(Fig4B). Fig4C shows the T1&T2&ADC&FA&colored-FA maps from DTI-MRF(top) compared with reference methods(bottom).
Fig5 shows the T1&T2&PD&ADC&FA&colored-FA-maps using DTI-MRF and synthesized clinic contrast images14 using the quantitative results.
Discussion and Conclusion
In this work, an optimized diffusion-prepared-MRF was developed to enable whole-brain T1&T2&PD&ADC&FA mapping with 1-mm isotropic resolution within 10min, which also enables the generation of common clinic contrast images. To correct the diffusivity bias caused, an eddy-current compensation pre-pulse gradient was implemented. A data sharing acquisition and reconstruction scheme was also proposed to allow for faster acquisition and better image quality.Acknowledgements
This work was supported in part by NIH research grants: R01-EB020613, R01-EB019437, R01-MH116173, P41EB030006, U01-EB025162, and GE Healthcare.References
1. Ma, D. et al. Magnetic resonance fingerprinting. Nature 495, 187–192 (2013).
2. Afzali, M. et al. MR Fingerprinting with b-Tensor Encoding for Simultaneous Quantification of Relaxation and Diffusion in a Single Scan. Magn. Reson. Med. 88, 2043–2057 (2022).
3. Cao, X. et al. 3D Diffusion-prepared MRF ( 3DM ) with cardiac gating for rapid high resolution whole-brain T 1 , T 2 , proton density and diffusivity mapping. Proc Intl Soc Mag Reson Med 0101 (2022). 4. Flassbeck, S., Schmidt, S., Bachert, P., Ladd, M. E. & Schmitter, S. Flow MR fingerprinting. Magn. Reson. Med. 81, 2536–2550 (2019).
5. Wang, C. Y. et al. Magnetic resonance fingerprinting with quadratic RF phase for measurement of T2* simultaneously with δf, T1, and T2. Magn. Reson. Med. 81, 1849–1862 (2019).
6. Liao, C. et al. 3D MR fingerprinting with accelerated stack-of-spirals and hybrid sliding-window and GRAPPA reconstruction. Neuroimage 162, 13–22 (2017).
7. Ma, D. et al. Fast 3D magnetic resonance fingerprinting for a whole-brain coverage. Magn. Reson. Med. 79, 2190–2197 (2018).
8. Gómez, P. A. et al. Rapid three-dimensional multiparametric MRI with quantitative transient-state imaging. Scientific Reports vol. 10 (2020).
9. Cao, X. et al. Optimized multi‐axis spiral projection MR fingerprinting with subspace reconstruction for rapid whole‐brain high‐isotropic‐resolution quantitative imaging. Magn. Reson. Med. 88, 133–150 (2022).
10. Cao, X. et al. Fast 3D brain MR fingerprinting based on multi-axis spiral projection trajectory. Magn. Reson. Med. 82, 289–301 (2019).
11. Alexander, A. L., Tsuruda, J. S. & Parker, D. L. Elimination of eddy current artifacts in diffusion-weighted echo-planar images: The use of bipolar gradients. Magn. Reson. Med. 38, 1016–1021 (1997).
12. Gao, Y. et al. Multishot diffusion-prepared magnitude-stabilized balanced steady-state free precession sequence for distortion-free diffusion imaging. Magn. Reson. Med. 81, 2374–2384 (2019).
13. Lu, L. et al. Diffusion-prepared fast imaging with steady-state free precession (DP-FISP): A rapid diffusion MRI technique at 7 T. Magn. Reson. Med. 68, 868–873 (2012).
14. Sophie Schauman; Siddharth Srinivasan Iyer; Mahmut Yurt; Xiaozhi Cao; Congyu Liao; Zheng Zhong; Guanhua Wang; Greg Zaharchuk; Shreyas Vasanawala;Kawin Setsompop. Toward a 1-minute high-resolution brain exam - MR Fingerprinting with fast reconstruction and ML-synthesized contrasts. in Proc Intl Soc Mag Reson Med 0056 (Proc Intl Soc Mag Reson Med 0056 (2022), 2020).
Figures
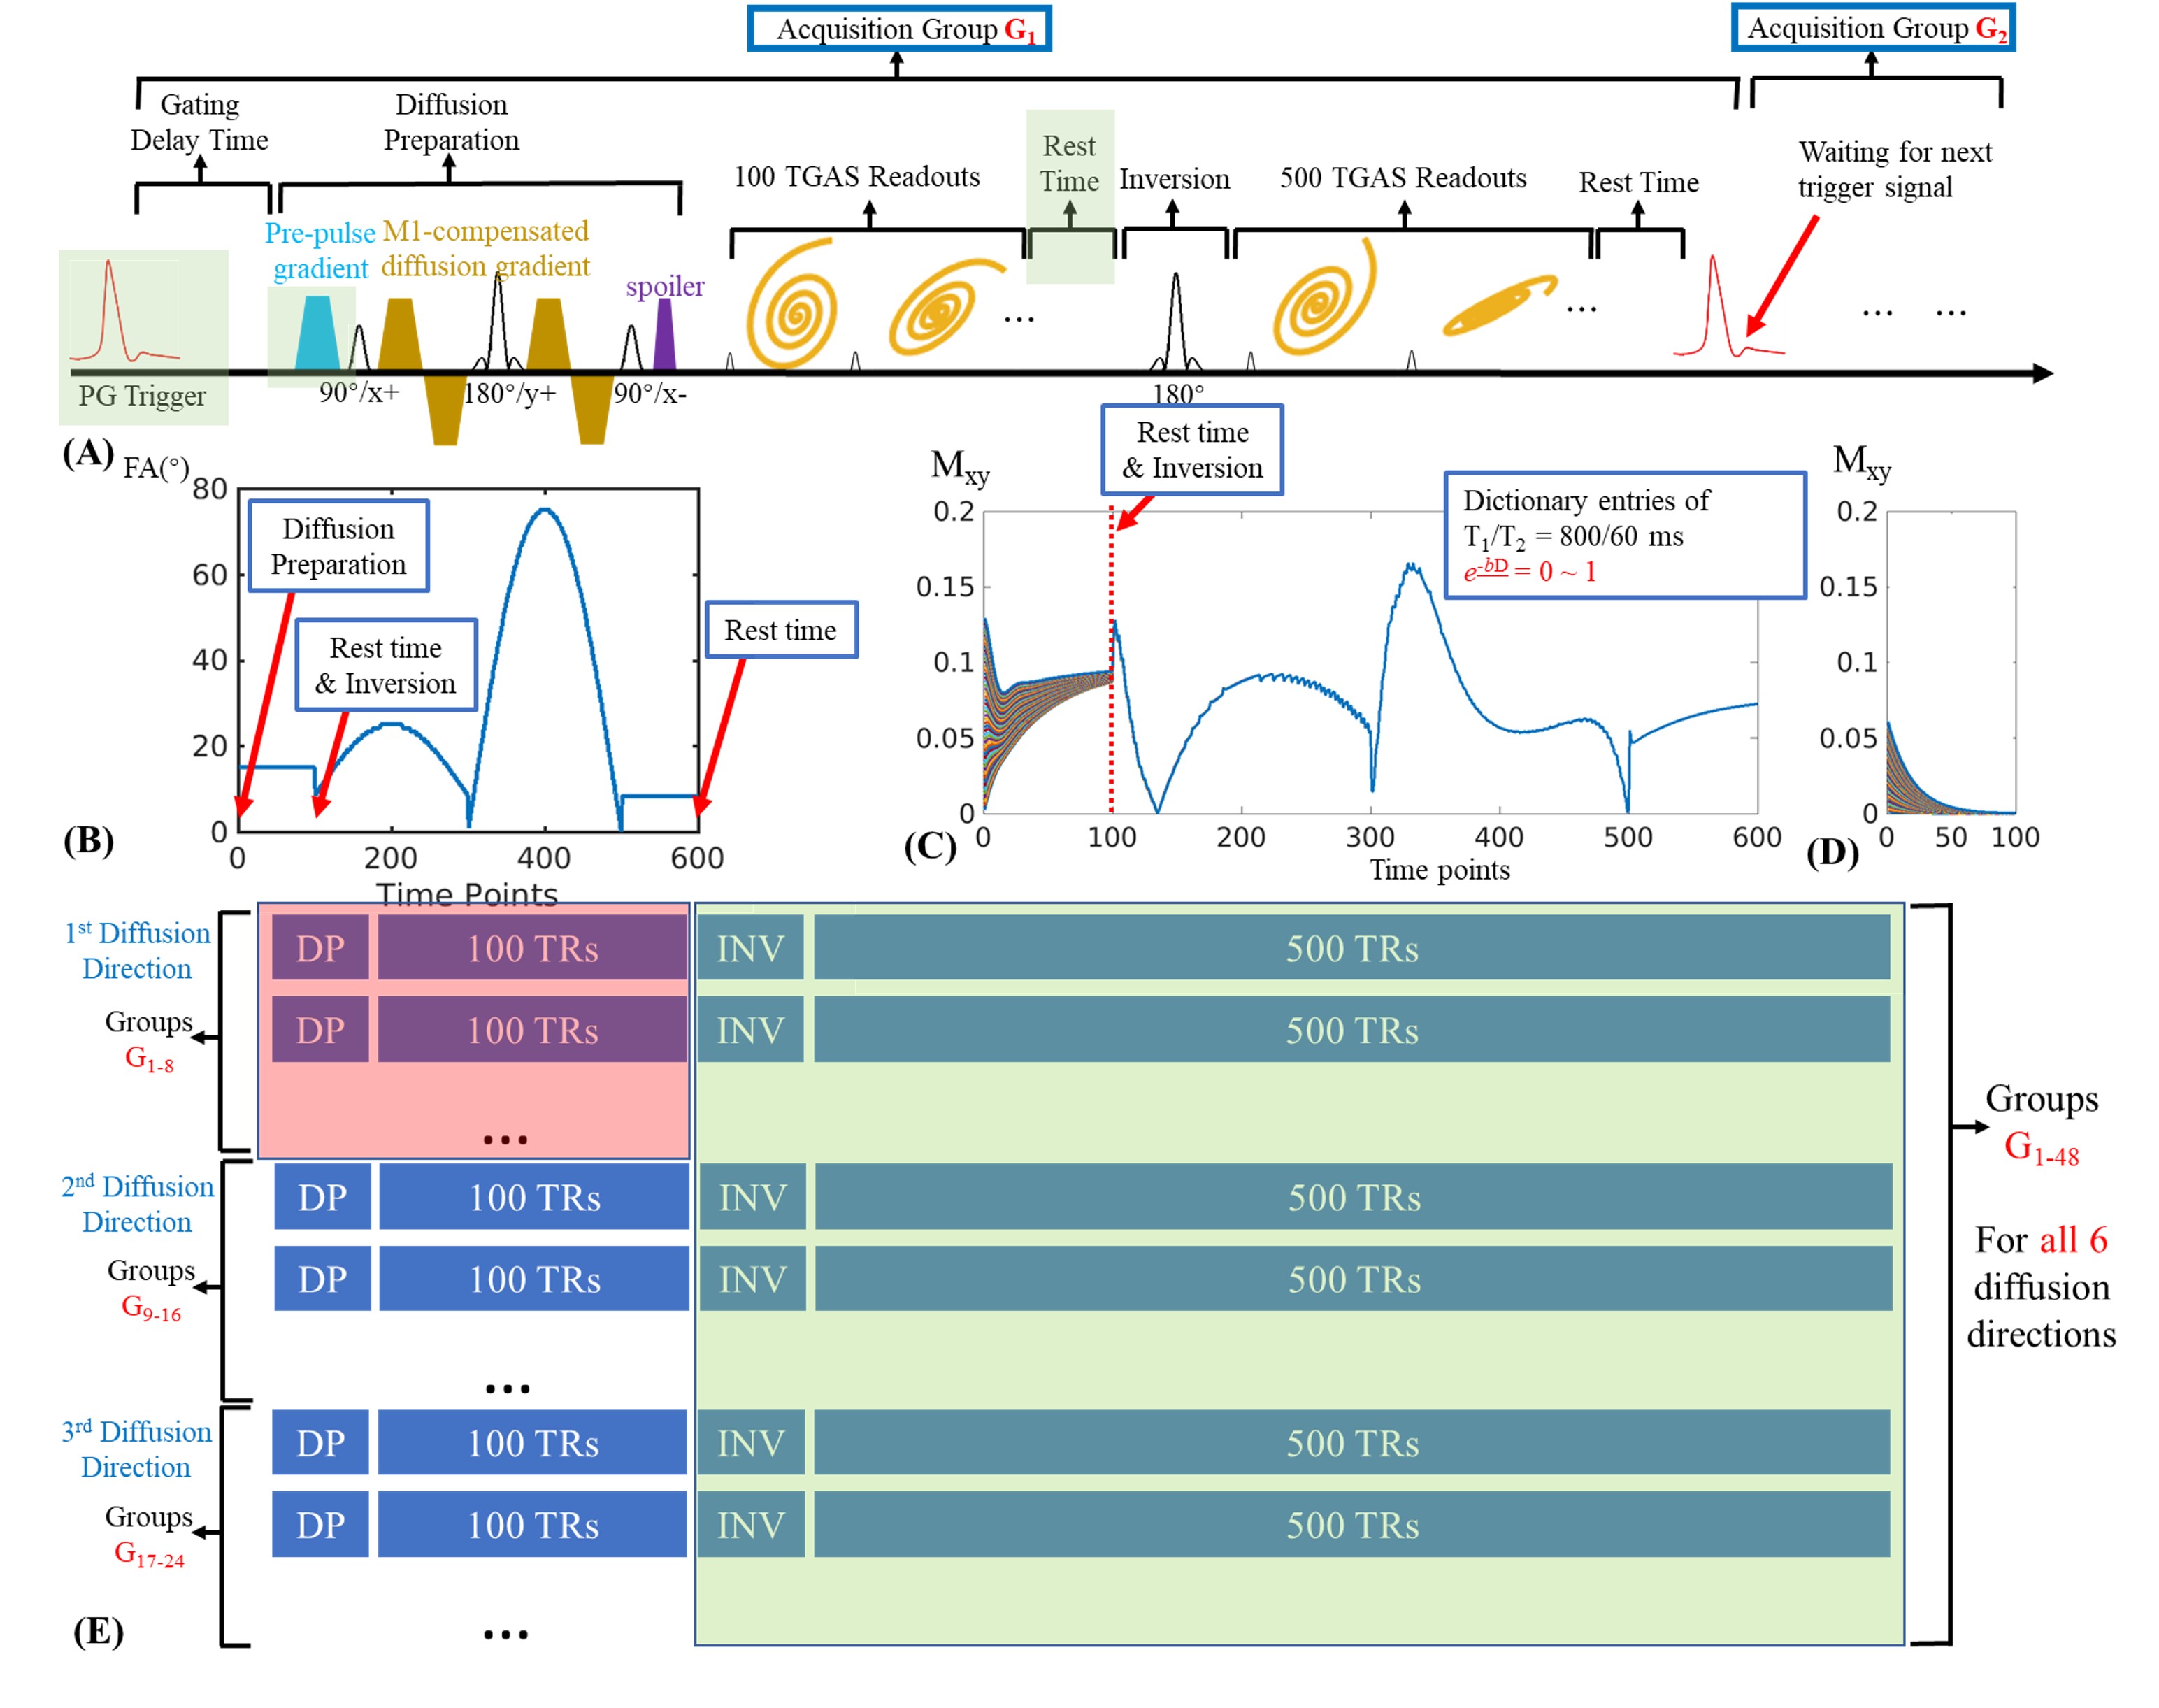
Figure 1.
(A) Sequence diagram and the FA pattern(B).
(C) Dictionary entries of T1/T2=800/60ms with e-bD from 0 to 1. Signal evolution after inversion (101-600 TRs) are independent of e-bD.
(D) Dictionary entries of 1-100 TRs with amplitude-stabilizer-gradient, which causes 2x drop in the signal at the first time point and rapid decay along the train as it fails to capture the recovering Mz signal.
(E) Data sharing scheme. For the 1st diffusion-direction recon, 1-100 TRs of the 1-8 groups (red box) are used together with 101-600 TRs of all 48 groups (all diffusion directions, green box).
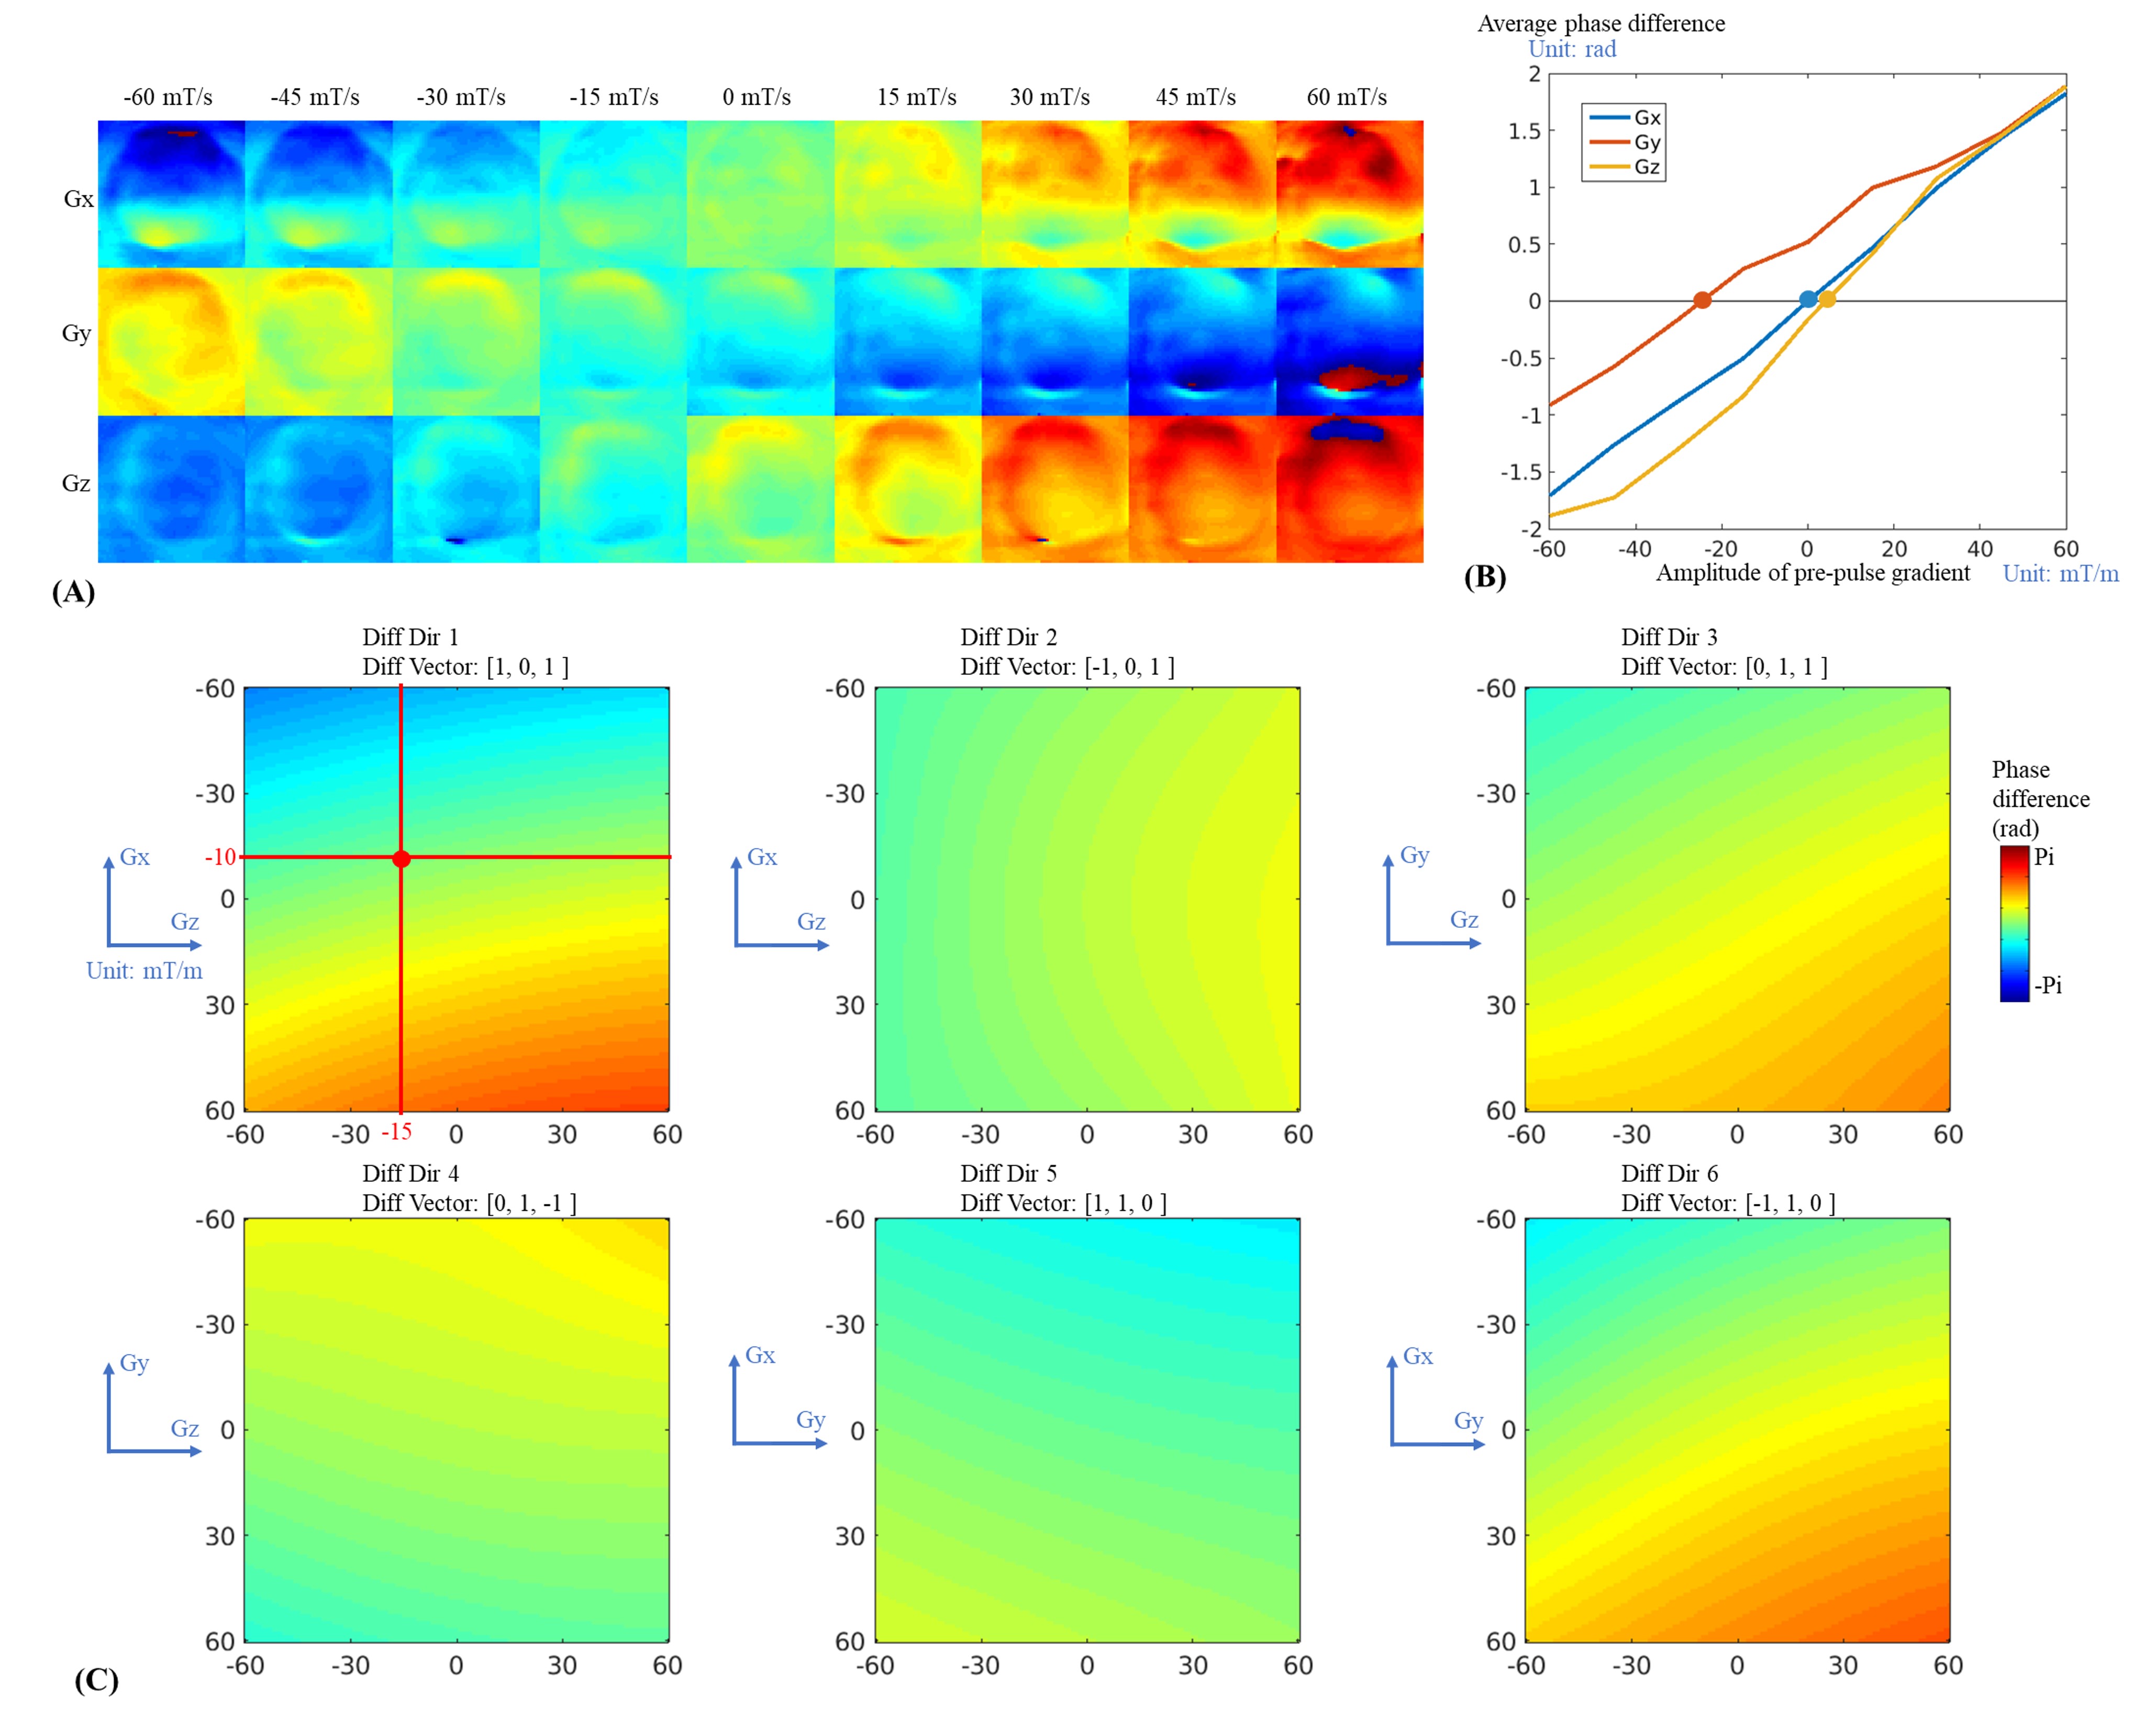
Figure 2.
(A) Phase difference maps using spin-echo diffusion sequence between b=0 and b=600s/mm2 with amplitude of the pre-pulse gradient varying from -60mT/m to 60mT/m for diffusion direction applied at Gx, Gy and Gz, respectively.
(B) Average phase difference across 3D images of (A).
(C) Phase difference for the six diffusion directions used in DTI-MRF. Since each direction used two different gradient axes (e.g. Gx and Gz for the 1st direction), a two-dimensional compensation was implemented.
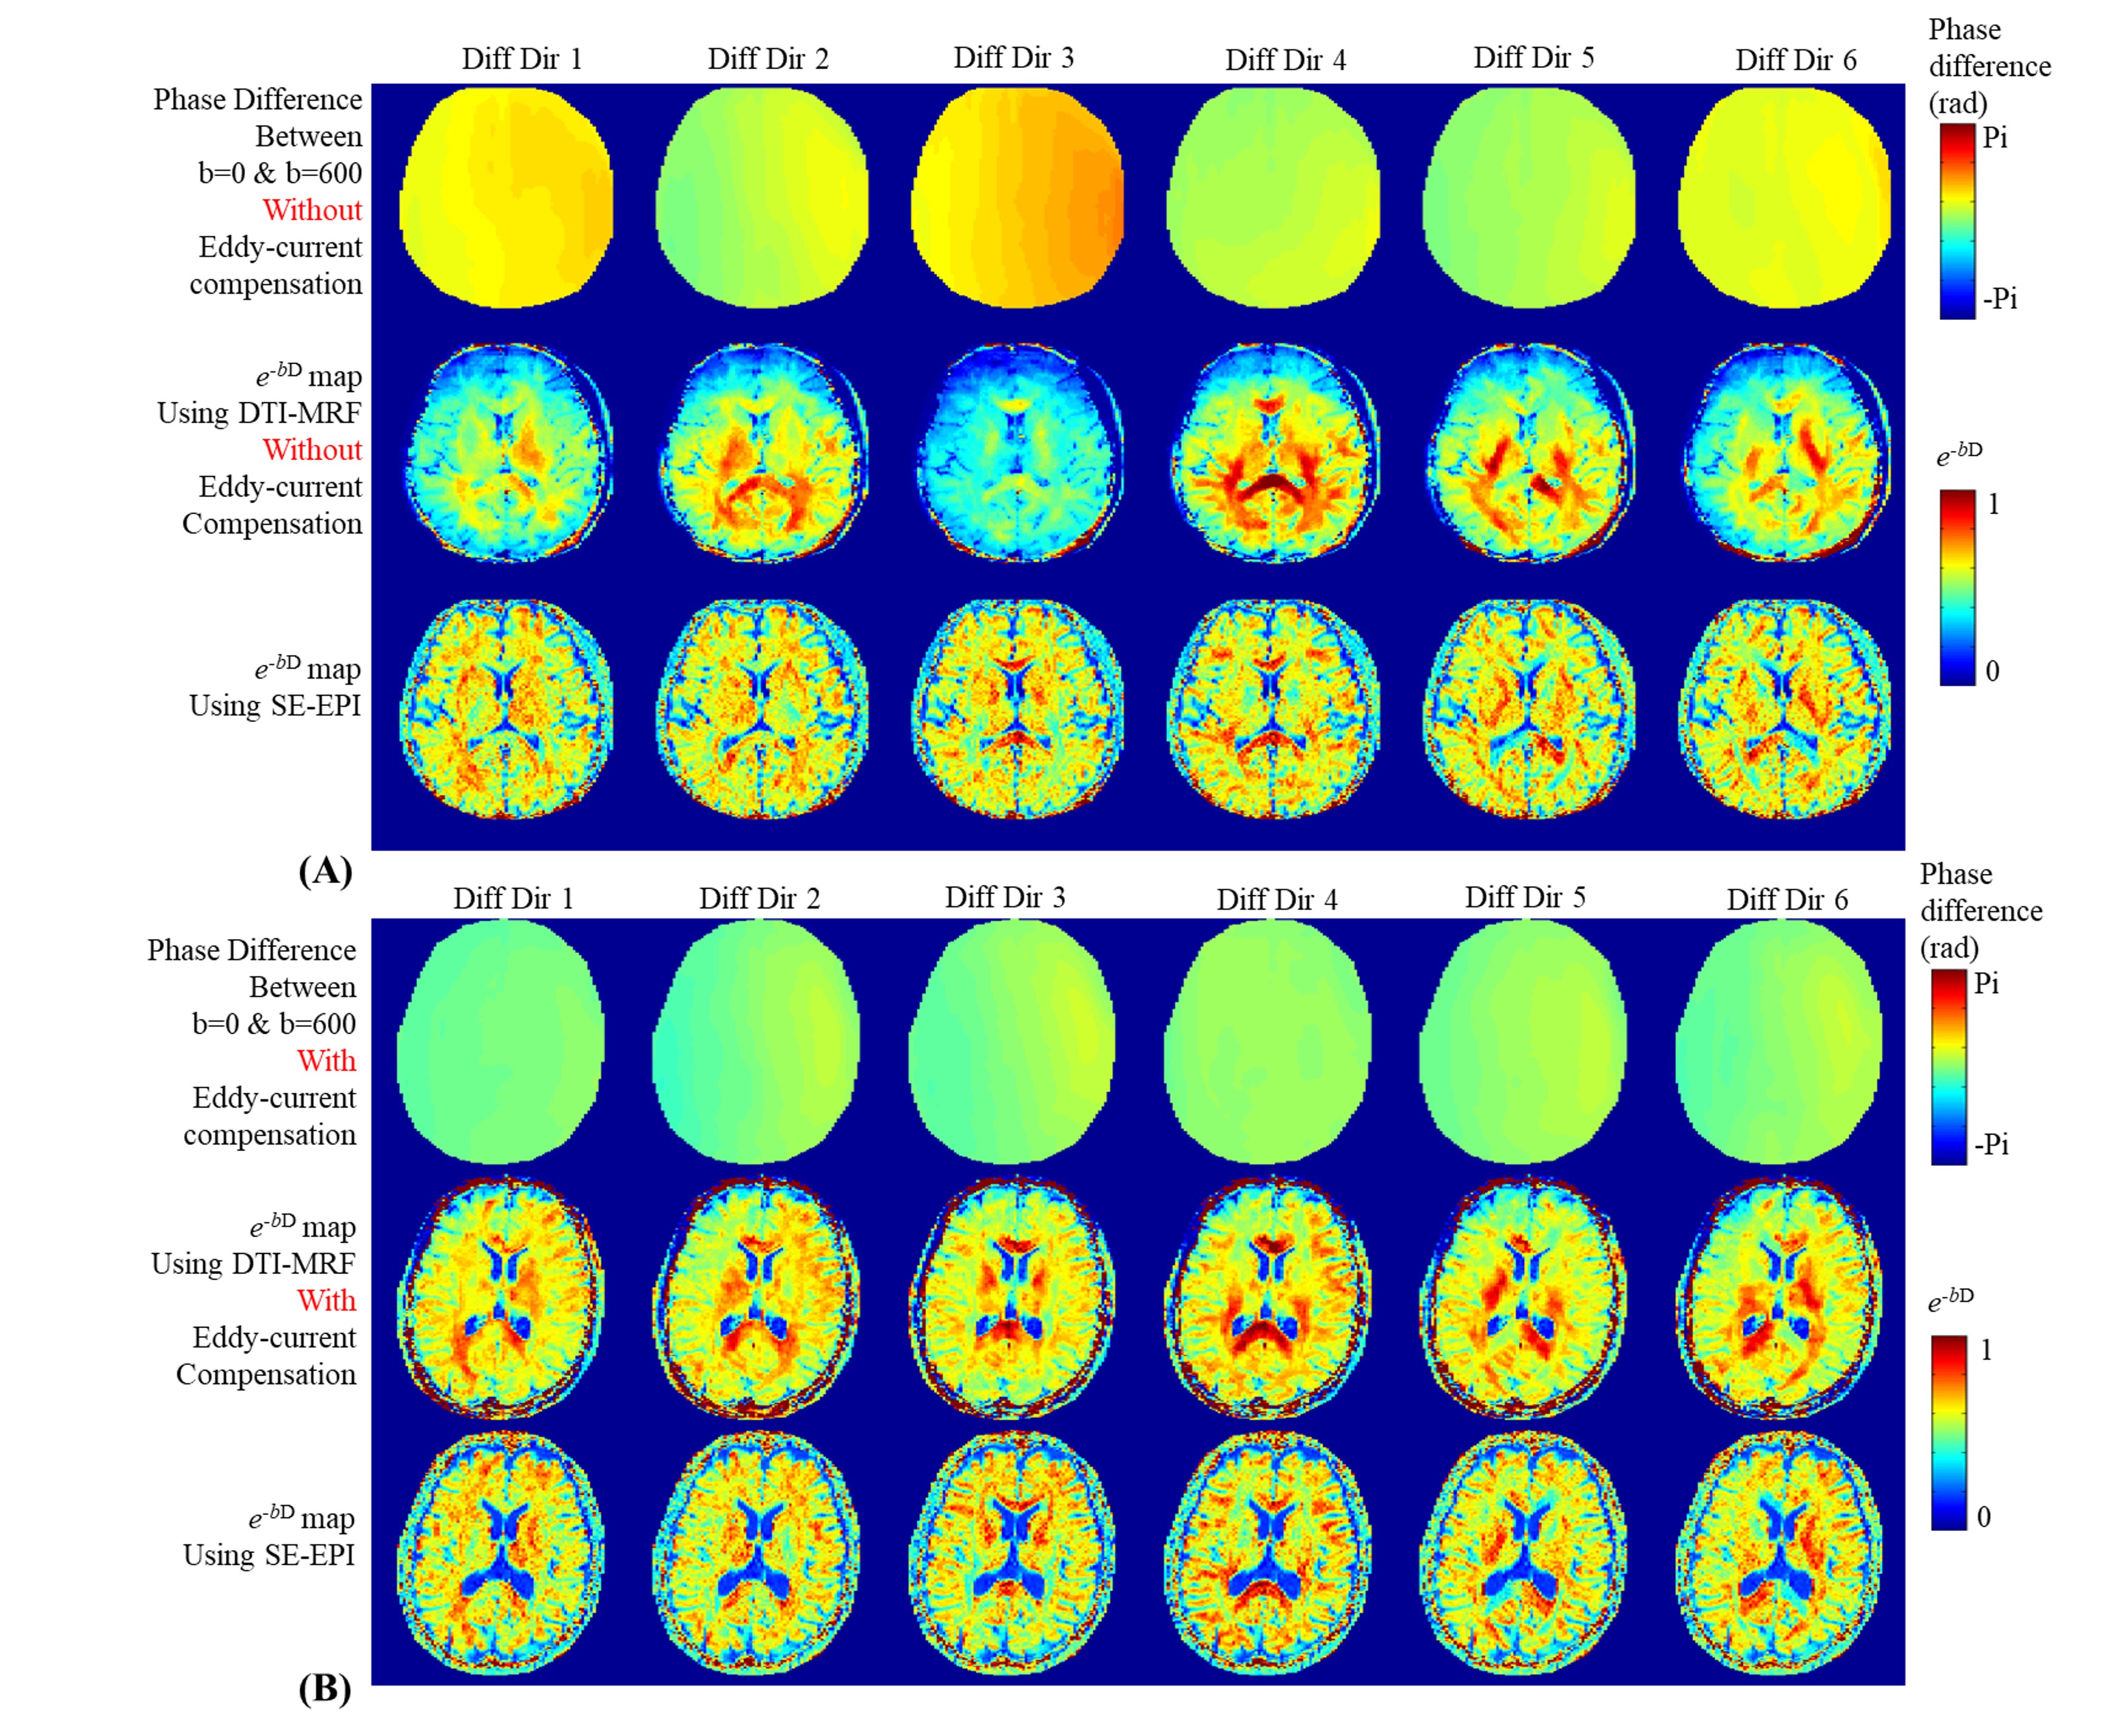
Figure 3.
(A) Without eddy-current compensation, the phase difference as measured using SE-EPI between b=0 and b=600s/mm2 (top), e-bD maps using DTI-MRF (middle) and the reference e-bD maps using SE-EPI (bottom).
(B) With eddy-current compensation, the phase difference between b=0 and b=600s/mm2 (top), e-bD maps using DTI-MRF (middle) and the reference e-bD maps using SE-EPI (bottom).
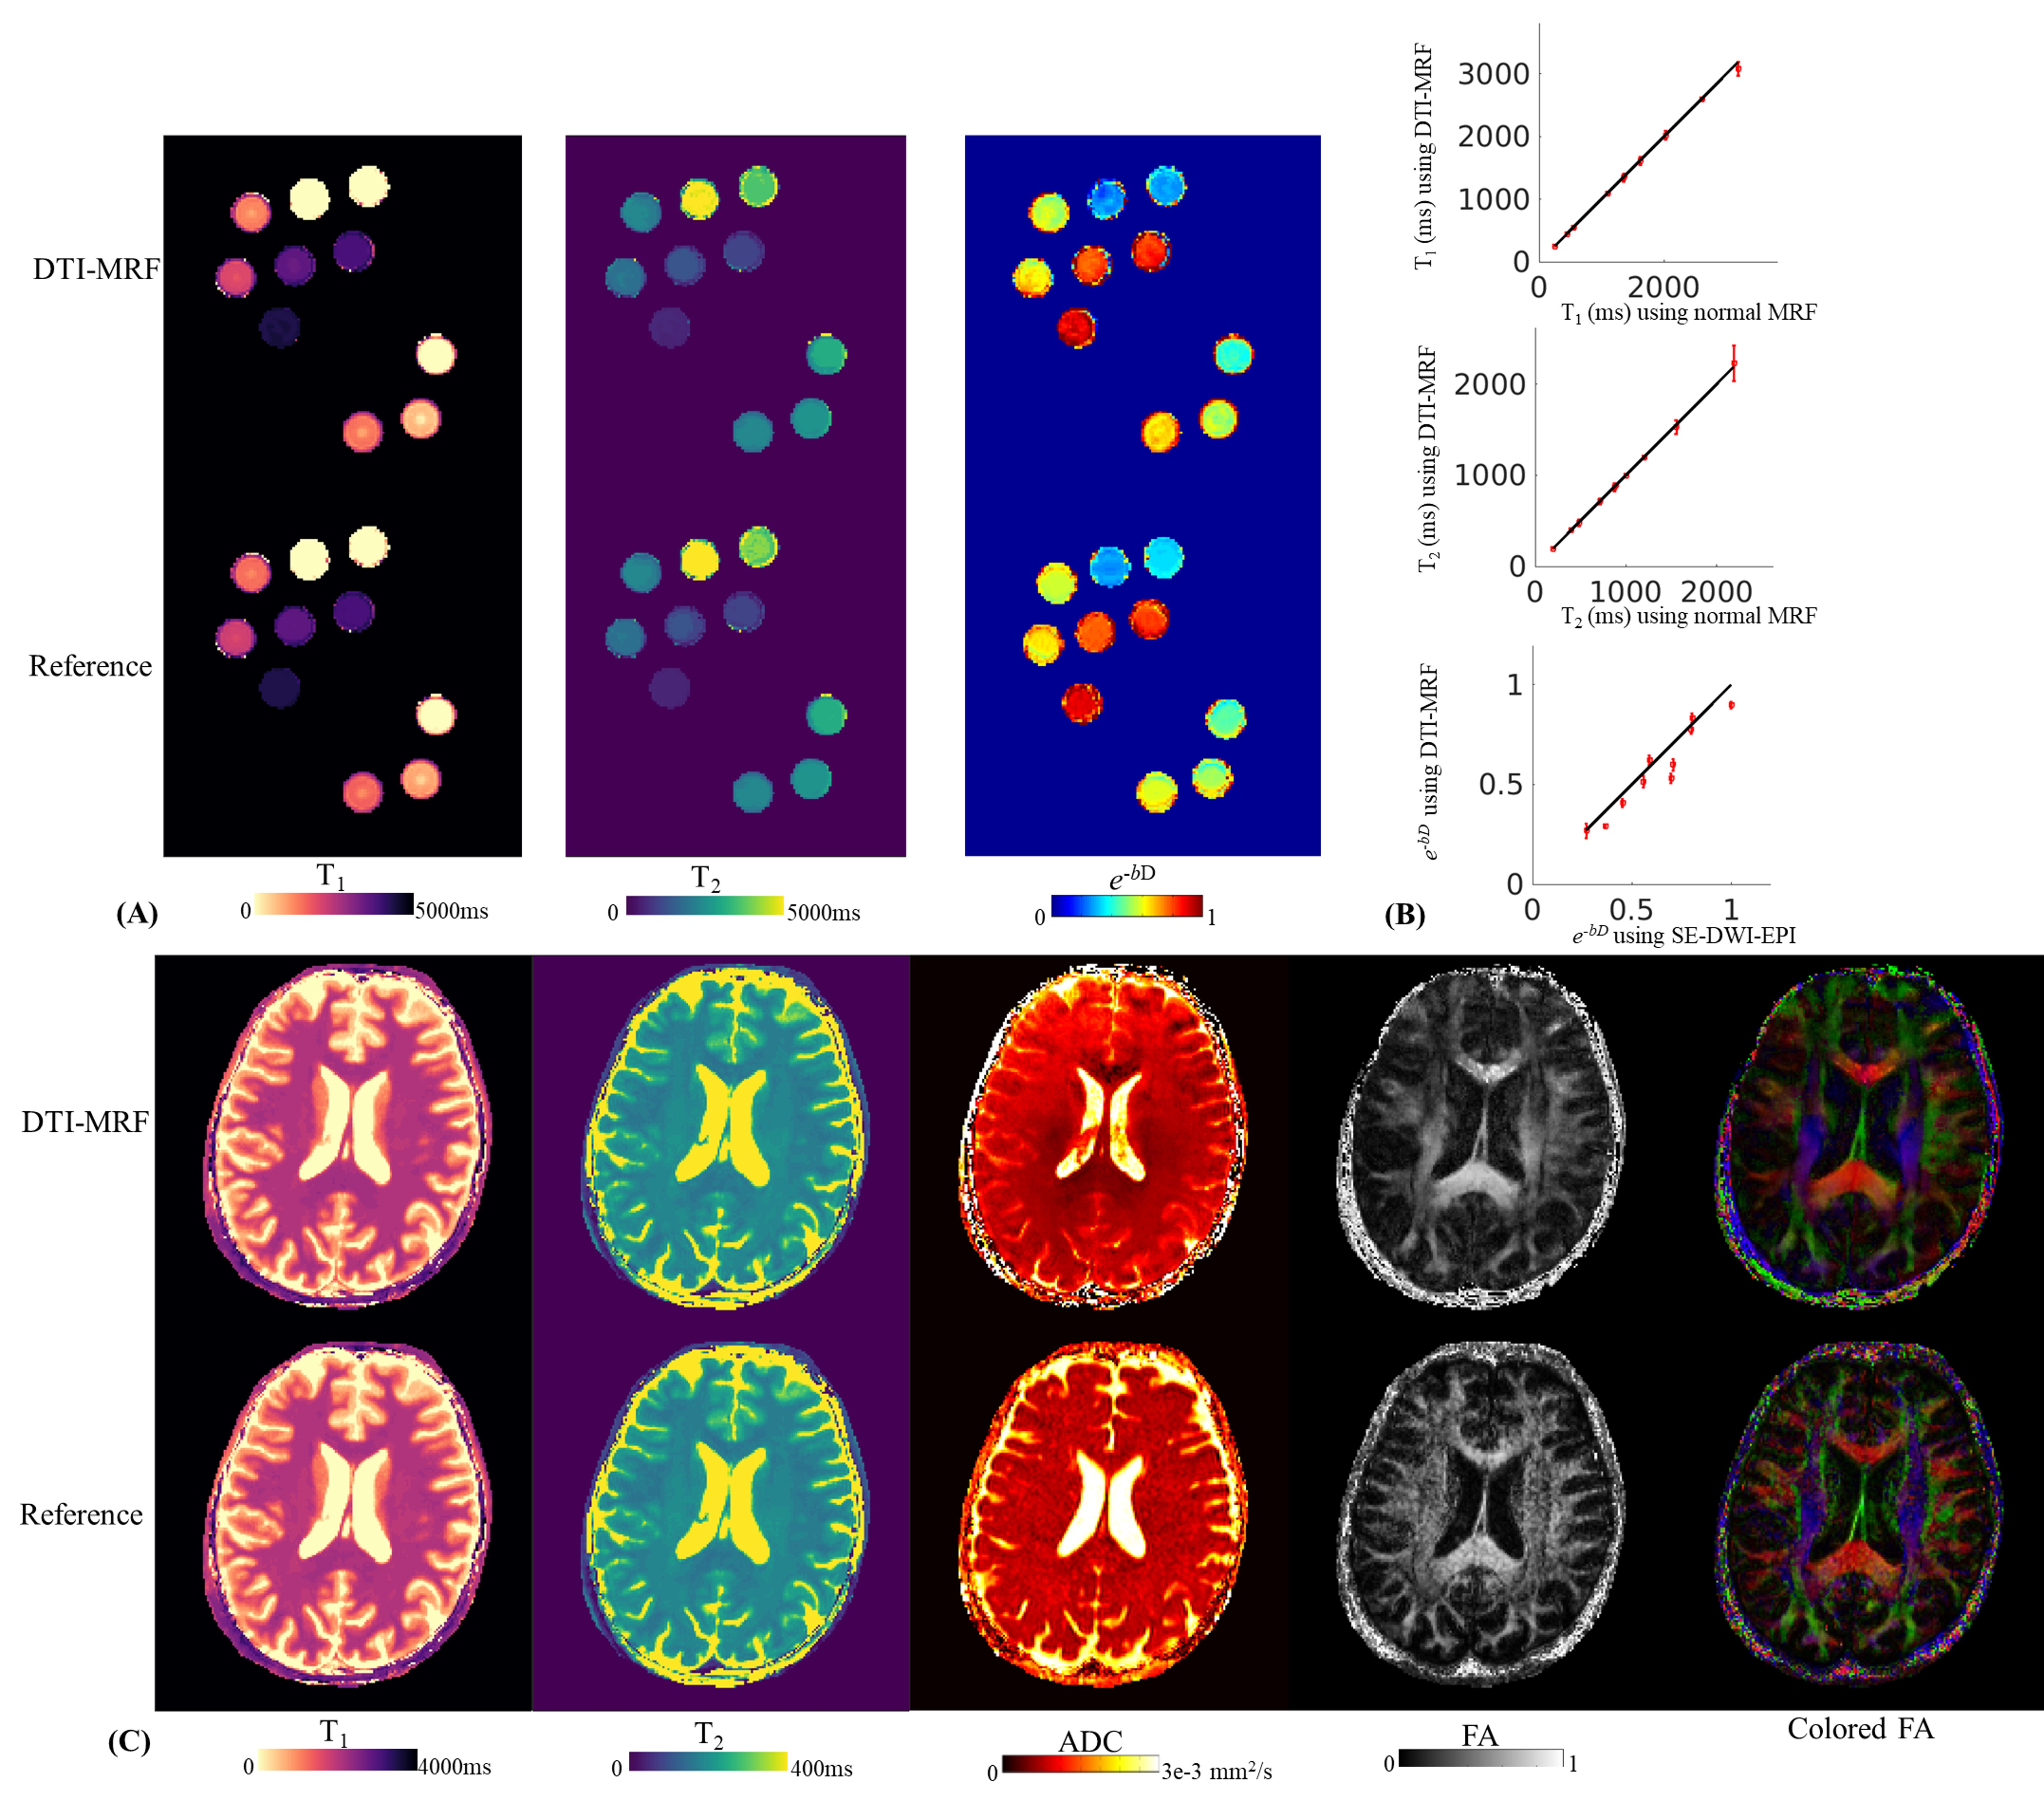
Figure 4.
(A) T1, T2 and e-bD maps using DTI-MRF (top) compared with reference images (bottom) for a phantom experiment.
(B) For each tube within the phantom, the mean values and standard deviations of the T1, T2 and e-bD values from the proposed method are plotted against those from the reference methods.
(C) In-vivo T1, T2, ADC, FA and colored maps using DTI-MRF (top) compared with reference images (bottom) acquired from a healthy subject.
The reference T1 and T2 maps were acquired using a normal 3D-SPI-MRF while reference ADC, FA and colored FA maps were acquired using DWI SE-EPI.
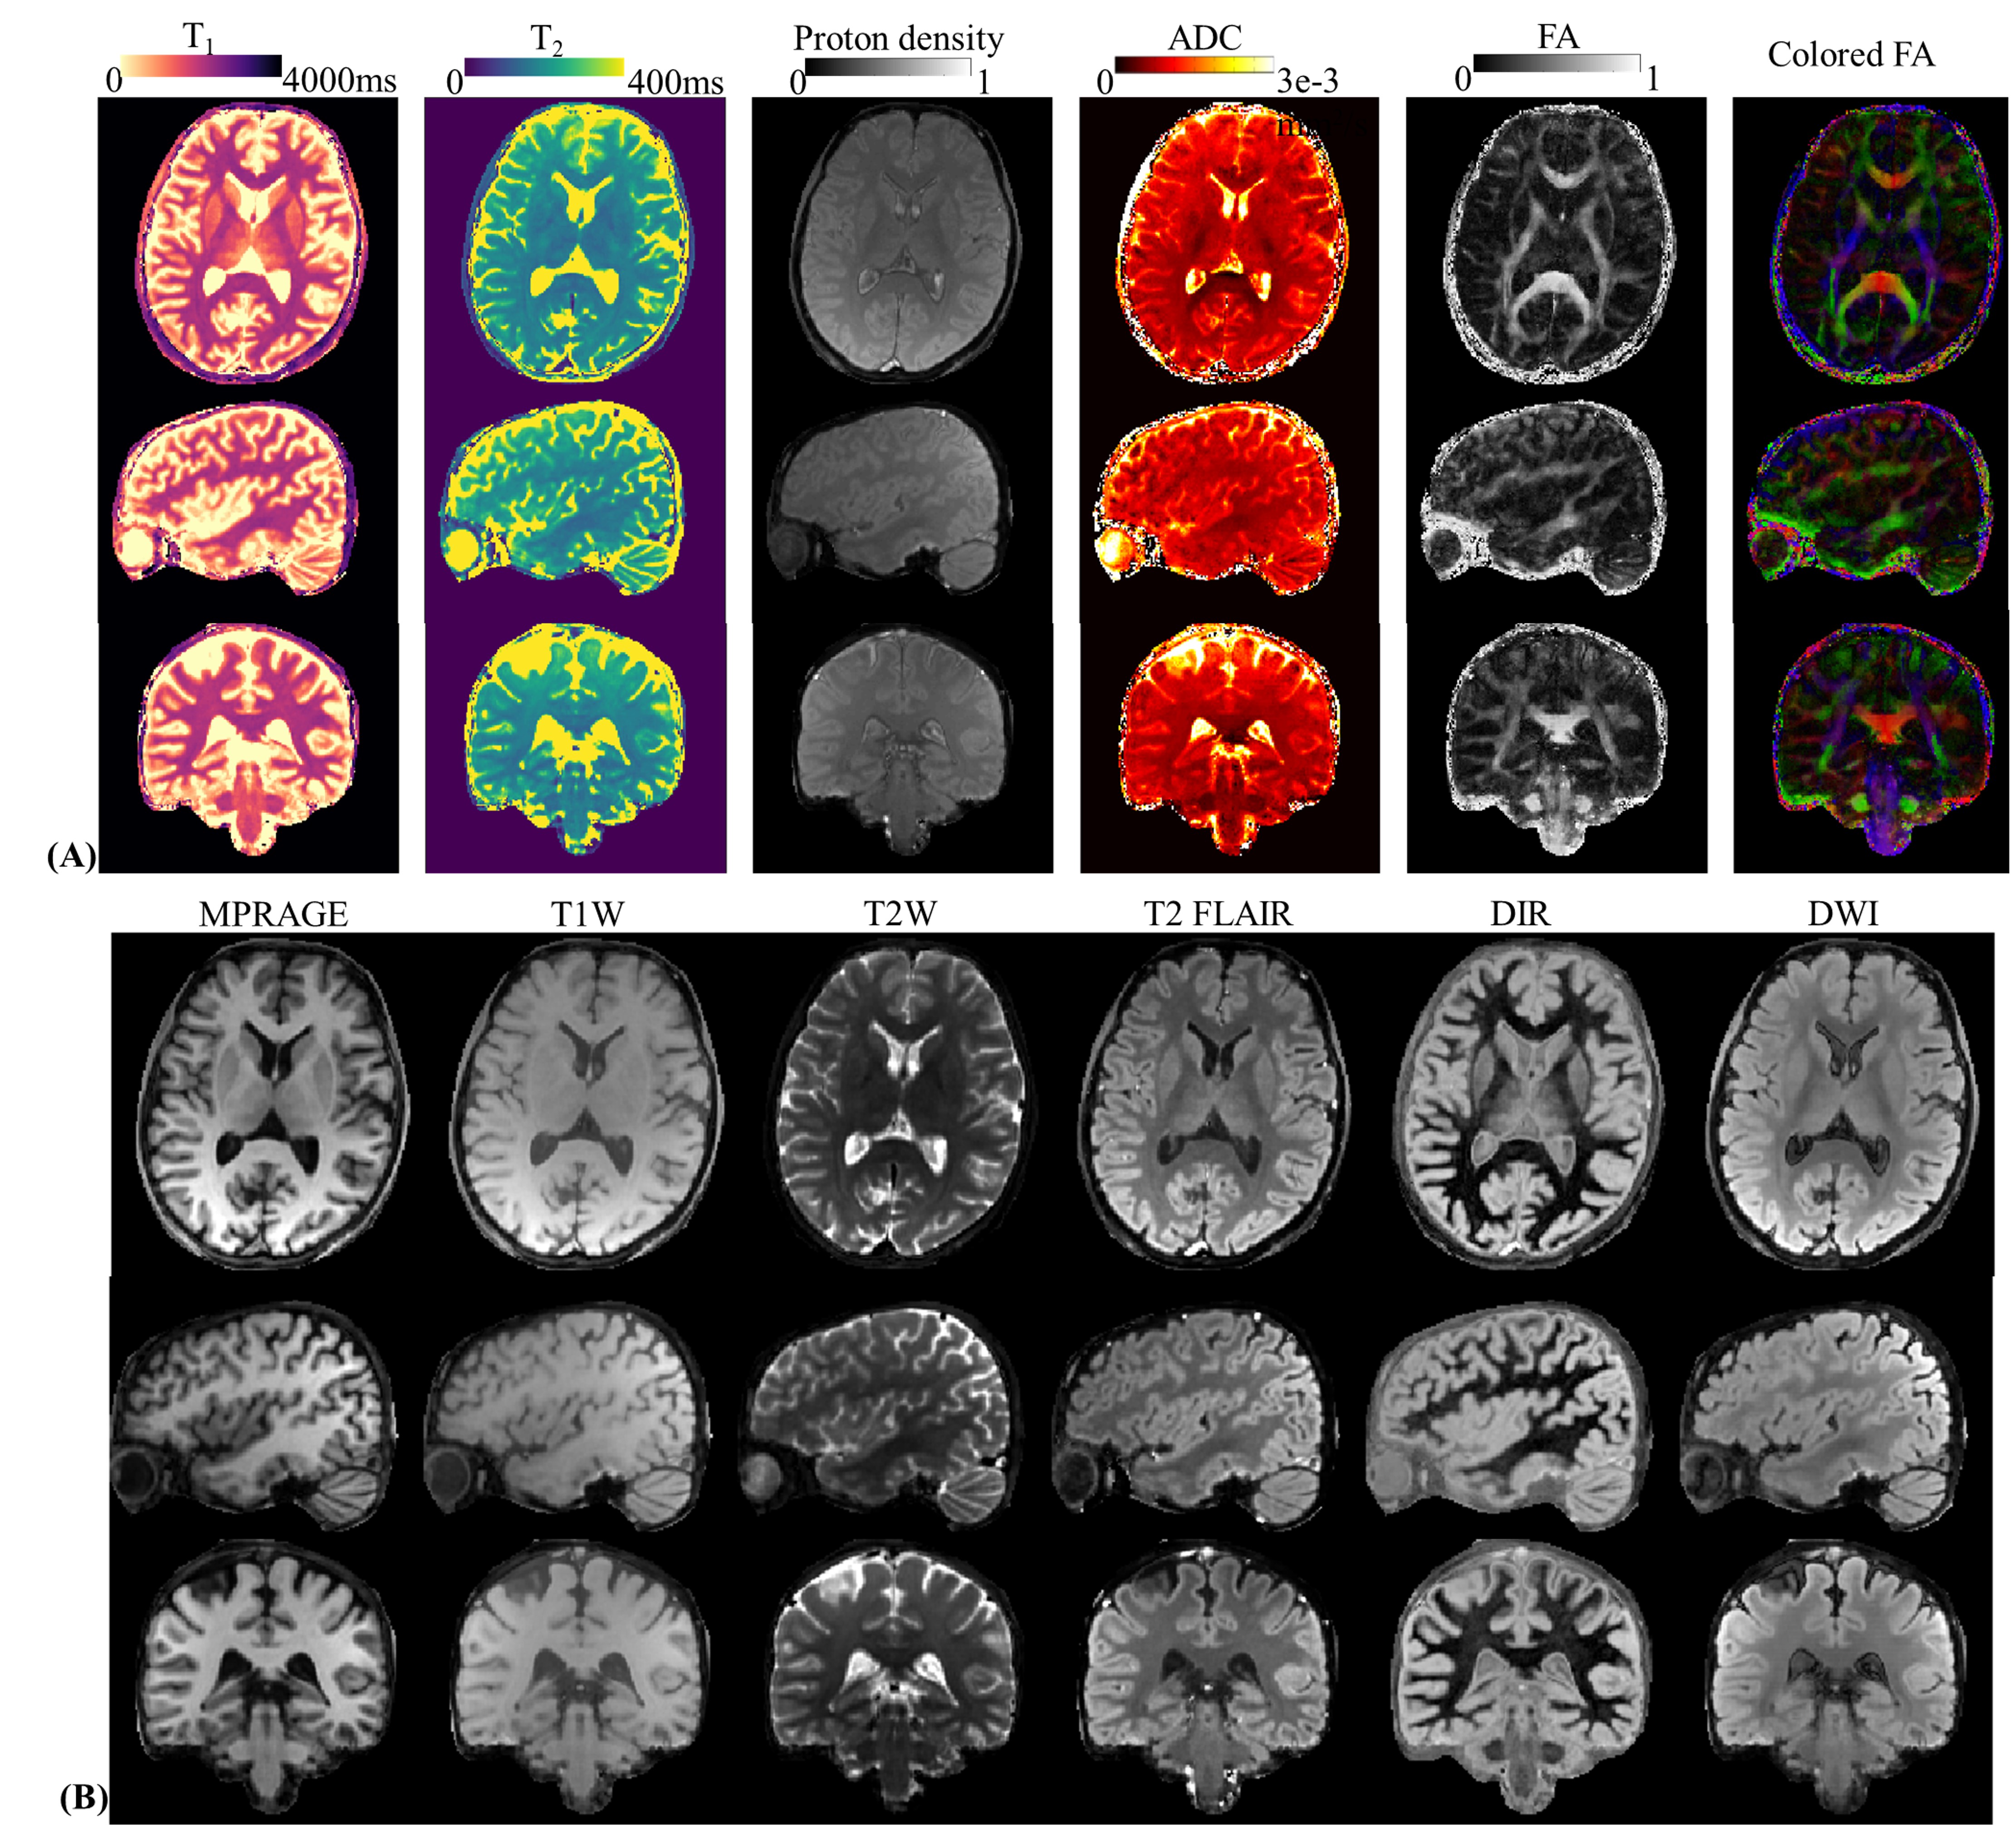
Figure 5.
(A) Whole-brain T1, T2, proton density, ADC, FA and colored-FA maps from DTI-MRF with 1-mm isotropic resolution and 10-min acquisition time.
(B) Synthesized clinic contrast images using the quantitative results.