5005
A New-found Approach to Temperature Monitoring Utilizing a Magnetic Field Map
Sangwoo Kim1 and Sukhoon Oh2
1Daewon University College, Jecheon-si, Korea, Republic of, 2Korea Basic Science Institution, Ochang-eub, Korea, Republic of
1Daewon University College, Jecheon-si, Korea, Republic of, 2Korea Basic Science Institution, Ochang-eub, Korea, Republic of
Synopsis
Keywords: Safety, Thermometry
We showed a new approach of MR temperature mapping without the oil-based phase reference of the conventional proton resonance frequency shift method (cPRFS), named as delta field-corrected temperature mapping (DFCTM). The performance of the DFCTM was compared with measurements using fiber optic thermal sensor and the cPRFS at the human-tissue mimicking agar-gel phantom. The sensor–measured temperature range was 6.05 ℃, while the DFCTM exhibited about 5.93 ℃. It exhibited a difference of -0.12 ℃ and the RMSE of the DFCTM was 0.16 ℃ for the entire experiments, which means that it could realize a temperature monitoring without oil phantoms.Introduction
Proton resonance frequency shift (PRFS) is established as a simple and rapid method with high spatial and temporal resolution than other methods such as T1 relaxation time- or diffusion-based temperature mapping techniques1. However, the MRI system phase variations caused by the eddy-current effect affect the temperature reliability and fidelity1,2. It needs oil phantoms or magnetic field monitoring probes to correct the phenomenon, whereas the use of these supplies is quite cumbersome in the PRFS1-4. We developed a new approach for temperature mapping without the oil phantom for phase references on the PRFS process, named as delta field-corrected temperature mapping (DFCTM).Methods
An agar-gel phantom to mimic human tissue was constructed with the agar (8 g/L), NaCl (10 g/L), and CuSO4 (1 g/L). At 3T MRI (Archiva, Philips Medical System, Best, Netherland), 3D dual-gradient echo (GRE) images were acquired before and after the insertion of the fiber-optic thermal sensor without phantom heating for the estimation of the susceptibility changes around the fiber optic sensor. Subsequently, the agar-gel phantom was heated using a microwave oven. Then, temperature images (PRFS) based on echo-planar imaging (EPI) with dual echoes were acquired. All procedures for the DFCTM were shown at Figure 1. Four oil phantoms were placed around the agar-gel phantom to estimate the background phase drift for the conventional PRFS (cPRFS) in comparison of the DFCTM. In addition, thermal sensor-measured temperature changes were monitored as a reference. The susceptibility changes of the cPRFS and DFCTM around the fiber optic sensor were lastly corrected. The scan parameters of 3D-GRE (for the susceptibility measurements) and EPI (for PRFS) were summarized in Table 1.Results
We analyzed the root-mean-square error (RMSE) of DFCTM, oPRFS, and the fiber optic sensor readings to determine the performance of the DFCTM. The apparent patterns of temperature changes of DFCTM and oPRFS look different (Fig. 2). However, DFCTM is much closer to the fiber optic sensor readings as shown at Fig. 3. The sensor measured heating was up to 6.05 ℃ whereas the DFCTM exhibited 5.93 ℃, which showed a difference of - 0.12 ℃ (cPRFS = + 0.31 ℃). The RMSE of the DFCTM was 2.7 times lower than the cPRFS (0.16 ℃ vs. 0.43 ℃, respectively).Discussion
This study showed the performance of temperature mapping of the DFCTM (RMSE = 0.16 ℃), which is the reference phantoms-free PRFS method, in comparison to the oPRFS and fiber optic thermal sensor. The sensitivity of the DFCTM was within ± 1 ℃. This result indicates that the phase drift caused by the eddy current and the phase retardation by large-volume heating could be corrected using the magnetic field maps through dual-echo phase images. The PRFS needs oil phantoms, which are fewer phase shifts, to correct phase drifts caused by eddy currents that are varying according to any temperature1,2,4. Magnetic field maps were generated through Hermitian products using dual echoes, which can remove the phase retardation1. In the DFCTM process, each phase difference map was calculated by subtracting different field maps, which were acquired during temperature rises, from the first field map, and then the difference maps were added to the field maps with temperature changes (Fig. 1). These steps imply that phase drift caused by eddy currents in all temperature ranges becomes similar to the first field map considerably. In addition, the phase retardation remained only in the phase offset because it subtracted the field maps from the original phase images, and the phase offset was subsequently removed from the original data. This indicates that a new-found DFCTM enables simultaneous correction of the phase drift and the phase retardation, leading to the temperature reading from only phase information of the MRI. Therefore, we believe that the DFCTM method can be applied to most MR thermometry studies.Acknowledgements
This work was supported by the Institute for Information and Communications Technology Promotion (IITP) Grant by the Korean Government through the Ministry of Science, ICT and Future Planning (MSIP) (Development of precision analysis and imaging technology for biological radio waves) under Grant 2021-0-00490.References
1. Winter L, Oberacker E, Paul K, Ji Y, Oezerdem C, Ghadjar P, et al. Magnetic resonance thermometry: Methodology, pitfalls and practical solutions. Int J Hyperthermia. 2016;32(1):63-75. 2. Rieke V. MR thermometry. J. Magn. Reson. Imaging. 2008;27:376-390. 3. Hernandez D, Kim KS, Michel E, Lee SY. Correction of B0 drift effects in magnetic resonance thermometry using magnetic field monitoring technique. Concepts Magn Reson Part B (Magn Reson Engineering). 2016;46B(2):81-89. 4. Ferrer CJ, Bartels LW, van der Velden TA, Grüll H, Heijman E, Moonen CT, et al. Field drift correction of proton resonance frequency shift temperature mapping with multichannel fast alternating nonselective free induction decay readouts. Magn Reson Med. 2020;83(3):962-973.Figures
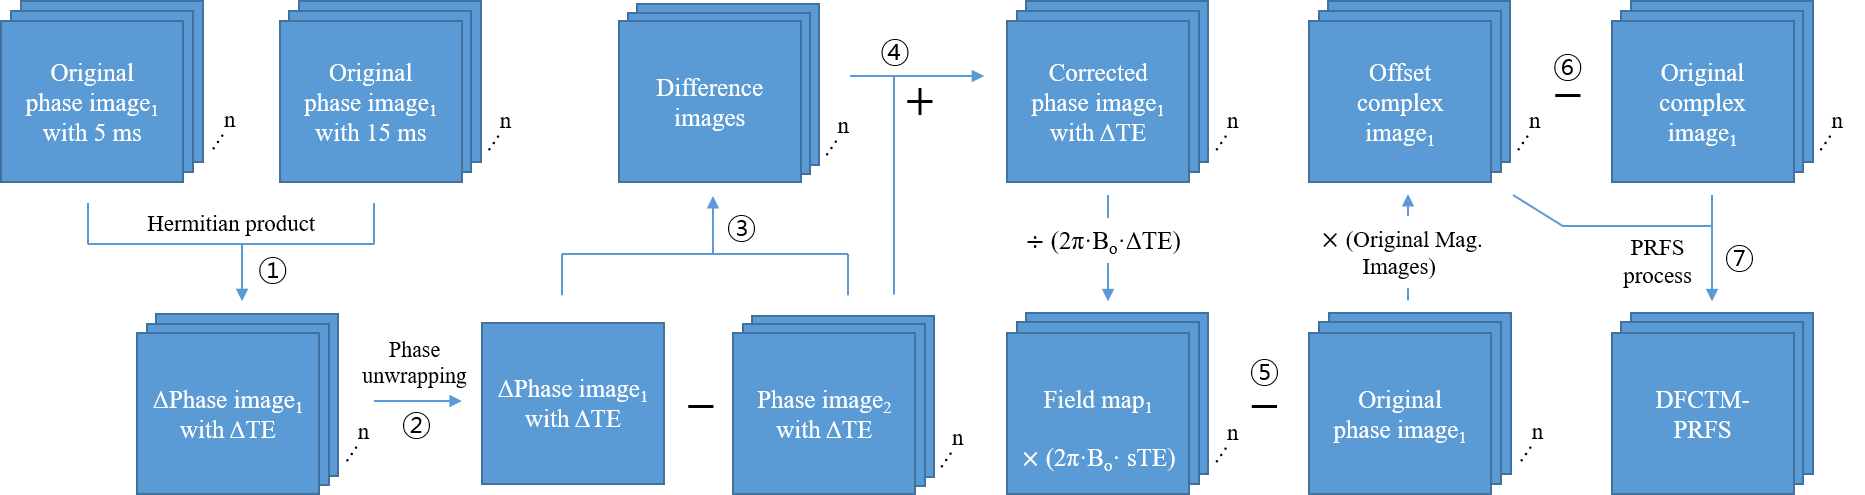
Fig. 1 A whole temperature reconstruction step of DFCTM-PRFS. ΔTE = 10 ms; n = total image
numbers; PRFS = proton resonance frequency shift; DFCTM = delta field-corrected
temperature mapping; Mag = magnitude; sTE = selective echo time (5 ms or 15
ms).

Table. 1 The 3D-GRE for the susceptibility correction value and EPI parameters
for the PRFS. GRE = gradient echo; EPI = echo-planar imaging; TR = repeat to time; TE
= echo time; FA = flip angle; FOV = field of view.
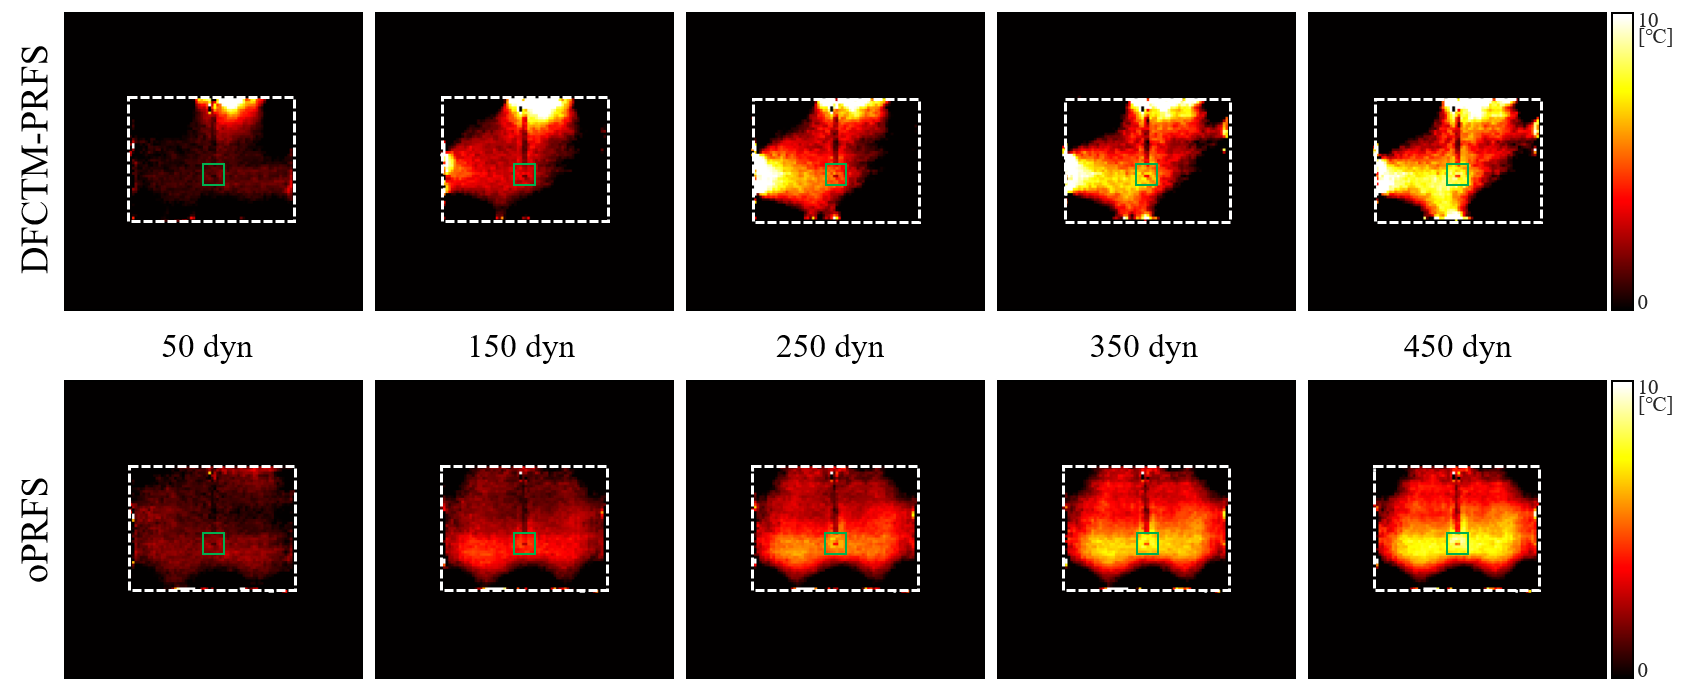
Fig. 2 Temperature maps of the DFCTM and oPRFS. The entire patterns of
temperature increase in the phantom (white dotted-box) is different from the
DFCTM and oil-based PRFS, whereas the temperature changes in the fiber optic sensor
region (green box) show similar. oPRFS = oil-based PRFS; DFCTM = delta
field-corrected temperature mapping; dyn = dynamic scan numbers.
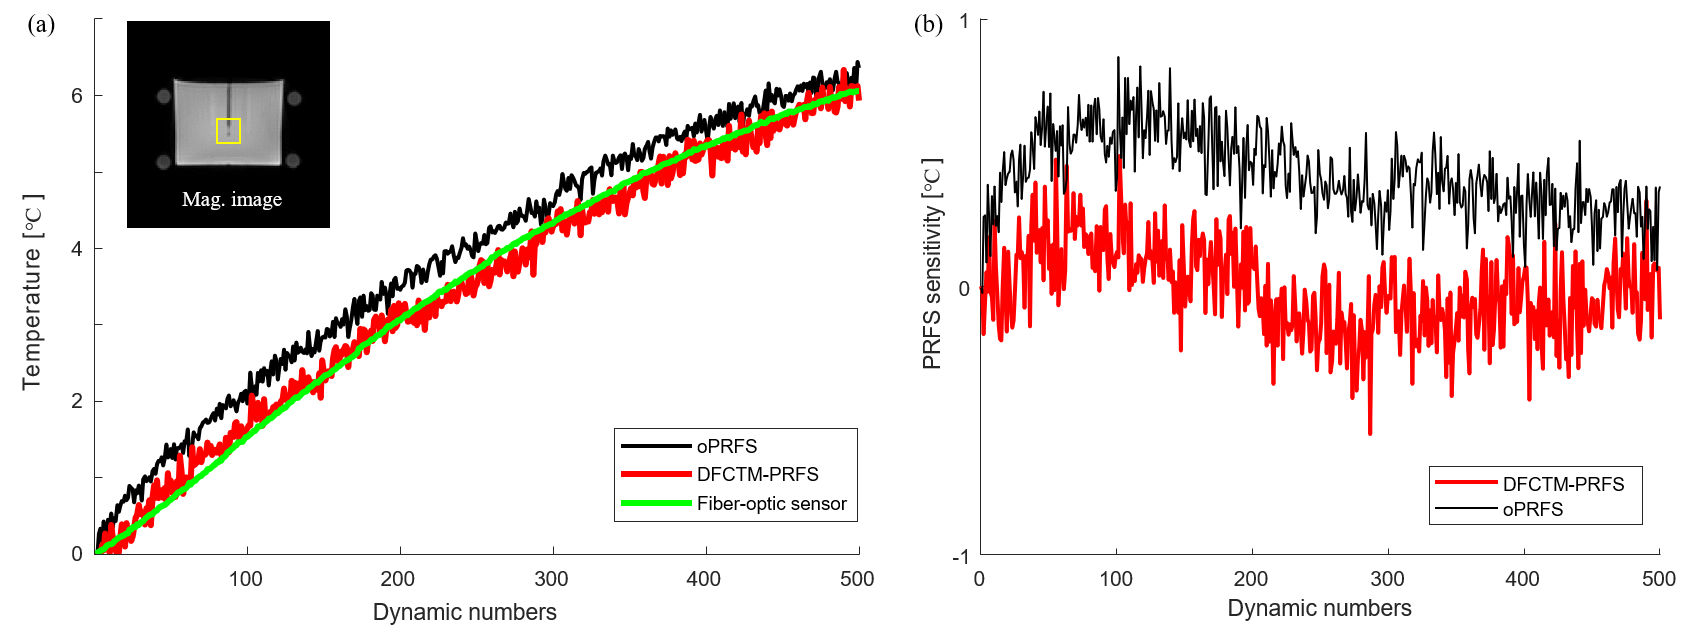
Fig. 3 Averaged temperature reading and the RMSE compared with the fiber optic
sensor readings. (a) The DFCTM temperature changes, which is averaged within the
yellow region of the phantom, are much closer to the fiber optic sensor reading
than the original PRFS (oPRFS). (b) The DFCTM temperatures showed smaller RMSE than
the oPRFS. The RMSE was calculated by subtracting each PRFS from the fiber optic
sensor reading.
DOI: https://doi.org/10.58530/2023/5005