5004
Thermometry of frozen tissue during cryoablation at 1.5T with a novel 3D spiral staircase UTE sequence (SSCUTE) – A feasibility study1MR R&D, Philips Healthcare, Rochester, MN, United States, 2Department of Radiology, Mayo Clinic College of Medicine and Science, Rochester, MN, United States
Synopsis
Keywords: New Trajectories & Spatial Encoding Methods, Thermometry
This study assessed the feasibility of thermometry of frozen tissue during MRI-guided cryoablation at 1.5T using a novel 3D spiral staircase UTE sequence (SSCUTE). MRI data using the SSCUTE sequence were continuously acquired along with temperature measurements during several freeze-thaw cycles in ex-vivo porcine specimens. A calibration curve was obtained using temperature measurements and corresponding MRI data. MRI-estimated temperature maps were generated with high accuracy using the calibration curve on a validation dataset. Our work demonstrated the feasibility of thermometry of frozen tissue using SSCUTE sequence at 1.5T, which could be an essential step in clinical adoption of this technique.Introduction
MRI-guided percutaneous cryoablation is a promising technique for treating lesions in the prostate, liver, and other body sites1-3. Standard T1/T2-weighted sequences are used to visualize the edge of frozen tissue (< 0⁰C), commonly referred to as an iceball6. However, the iceball itself does not represent the lethal ablation margin (< -20⁰C). Therefore, non-invasive thermometry inside the iceball is clinically desired to ensure treatment efficacy. Using ultrashort echo time (UTE) sequences, recent studies have demonstrated thermometry of frozen tissue at 0.5T and 3T7-11. This study investigates the feasibility of thermometry of frozen tissue at 1.5T using a novel 3D spiral staircase UTE sequence.Methods
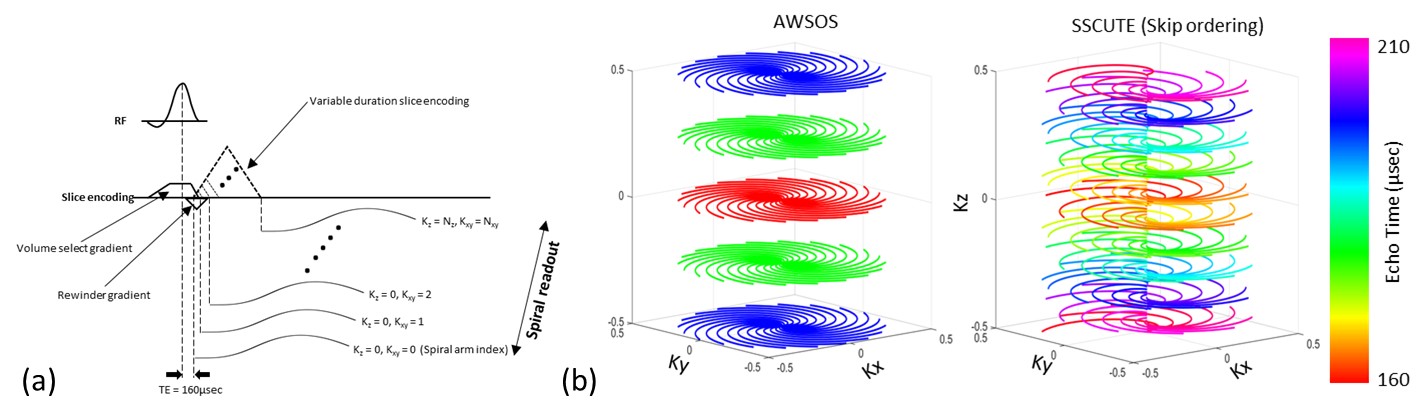
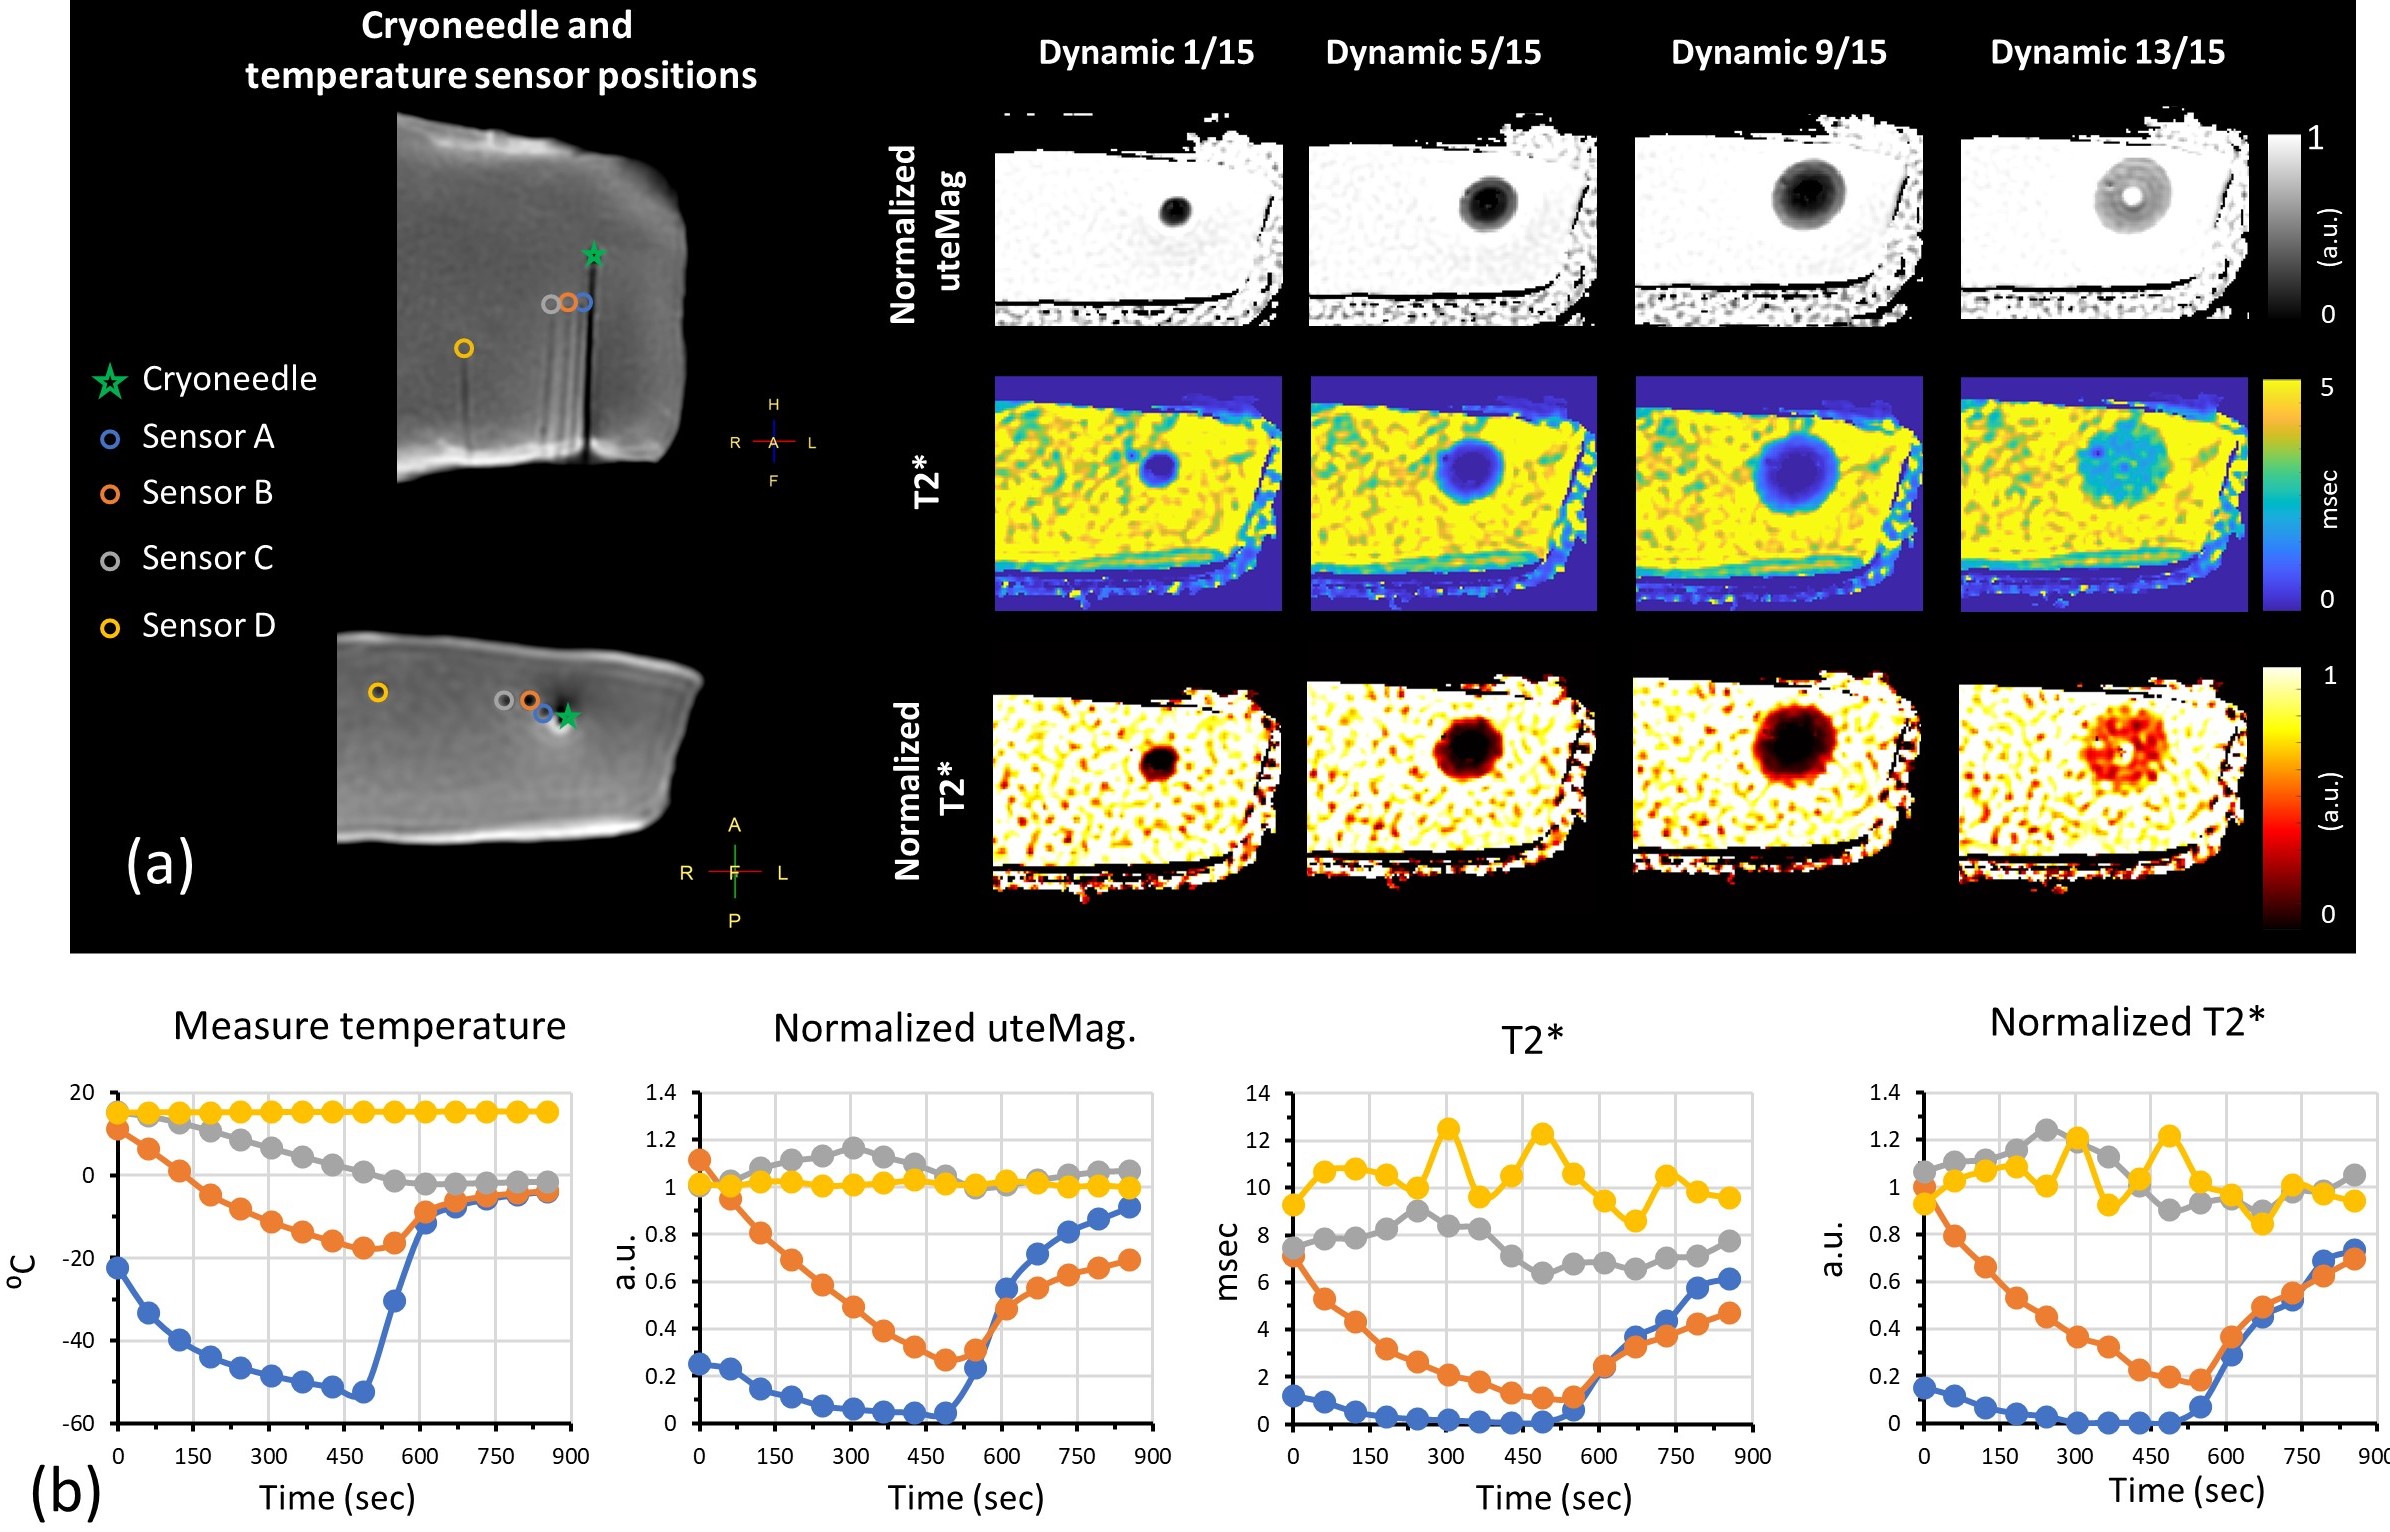
Imaging sequence: The proposed 3D spiral staircase UTE (SSCUTE) is based on a spiral staircase trajectory12 modified to achieve UTE by adapting a variable-duration slice encoding similar to the acquisition weighted stack-of-spiral technique (AWSOS)13. SSCUTE has several advantages: 1) high sampling & SNR efficiency due to spiral readout along the Kxy axis; 2) adaptability to anisotropic FOV and resolution; and 3) an in-coherent through-plane aliasing artifact pattern. The latter is beneficial in minimizing through-plane aliasing artifacts caused by the short RF pulses typical in UTE sequences. Figure 1a shows the pulse sequence diagram of the proposed SSCUTE method, and Figure 1b compares AWSOS and SSCUTE trajectories. Phantom images were acquired to compare the through-plane aliasing artifact pattern of AWSOS and SSCUTE sequences using identical sequence parameters and RF pulse, as detailed below.Cryoablation experiment: Two ex-vivo porcine muscle specimens (A&B) procured from different vendors were used to perform four experiments (two experiments on each specimen). In each experiment, an MR-compatible cryoneedle (Visual-ICE, Boston Scientific, USA) was inserted into the ex-vivo specimens at room temperature. Four fiber-optic sensors (OSENSA, Canada) were inserted at different distances from the tip of the cryoneedle for temperature reference. A baseline dataset was acquired at room temperature before cryoablation. And two freeze-thaw cycles of 15:00 mins were performed, during which MRI data at a clinical 1.5T Ingenia scanner (Philips, The Netherlands) were dynamically acquired with interleaved multi-echo SSCUTE sequence. The sequence parameters are: TE1, TE2, TE3/TR = 160, 220, 600µs/3.4msec (TE as inner loop); Flip angle = 9⁰; Acq. FOV/voxel = 325 x 325 x 140mm3/1.7 x 1.7 x 6mm3; spiral readout duration = 0.68msec; Volume selective excitation; Scan orientation = Axial; Temporal resolution = 60sec. The image reconstruction was performed immediately on the scanner using a gridding and inline temperature map generation algorithms implemented in Recon 2.0 (Philips, The Netherlands). MRI data of the following three methods were correlated with the temperature measurements from the sensors: 1) Magnitude of TE1 normalized to the baseline TE1 magnitude (Normalized uteMag); 2) T2* map computed by the exponential fitting of TE1, TE2, and TE3 data (T2*); and 3) T2* normalized to the baseline T2* (Normalized T2*). A calibration curve was obtained by fitting the data points below -5⁰C to an exponential function. The obtained fit was validated on a separate validation set to estimate temperature, and statistical analysis was performed to determine the accuracy of the results.
Results and Disucssion
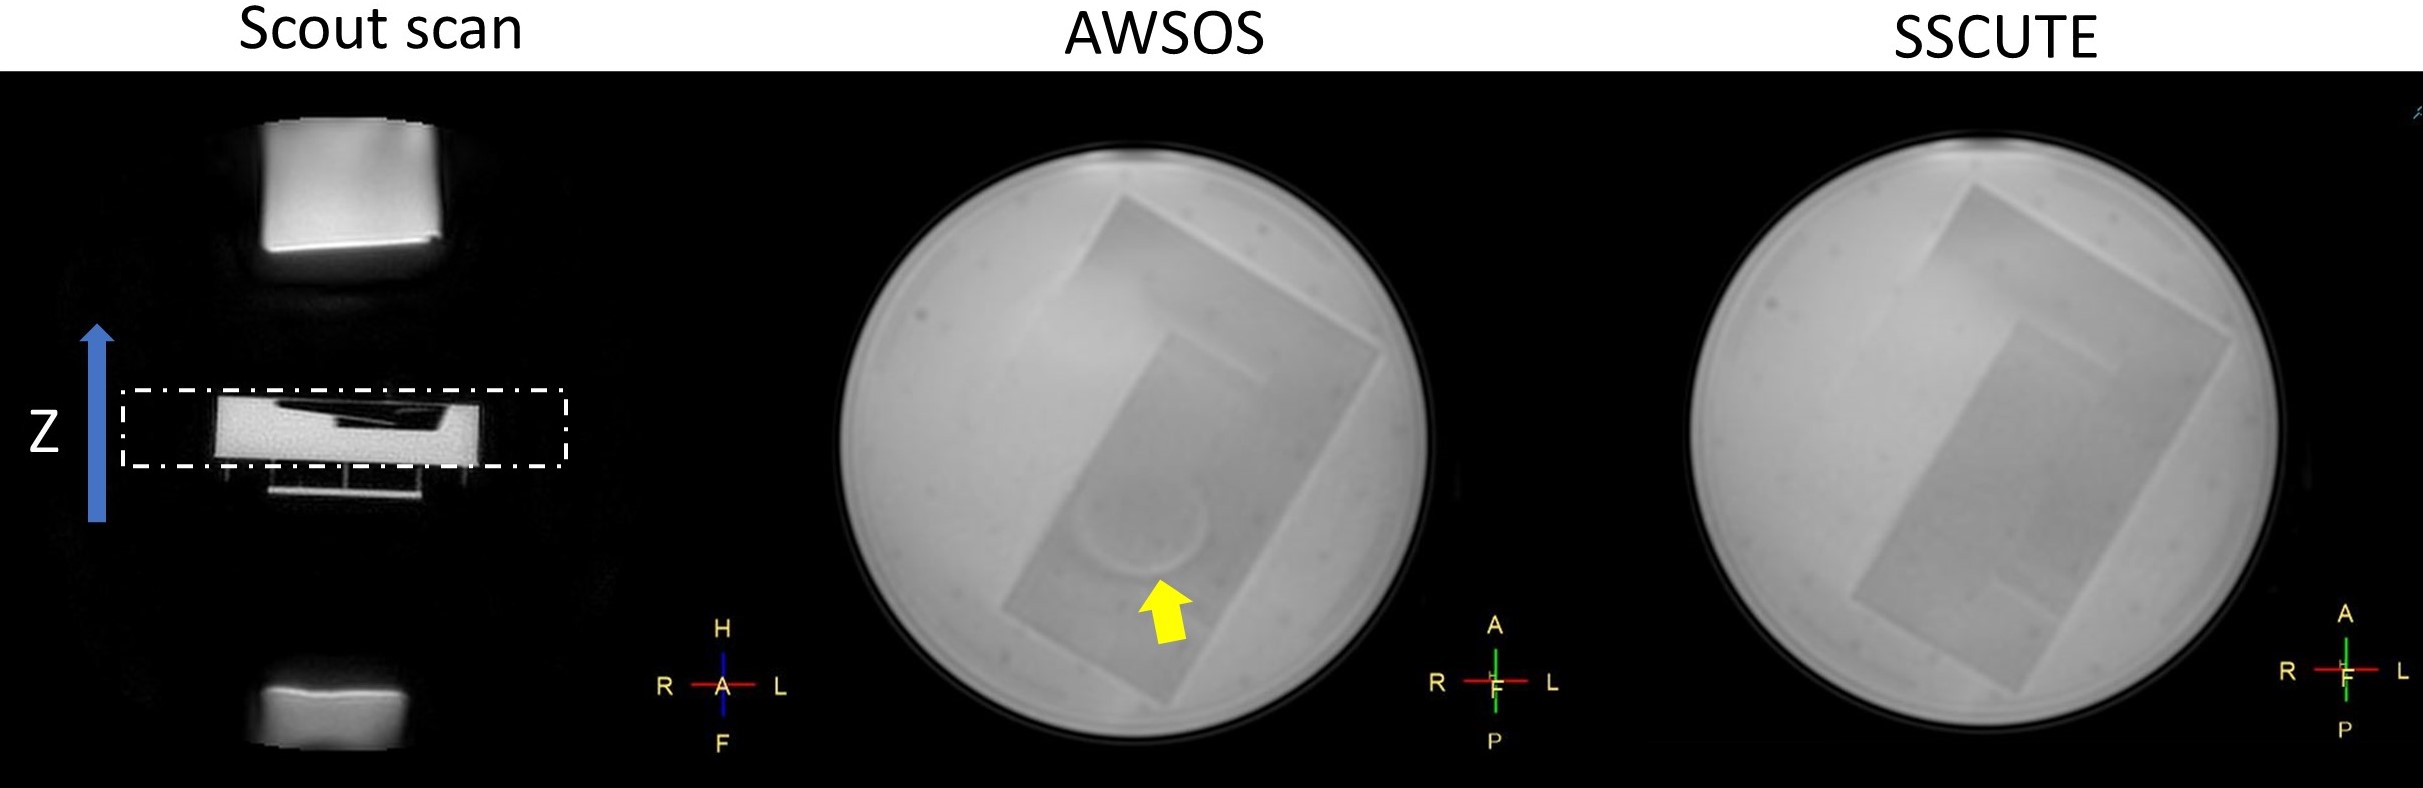
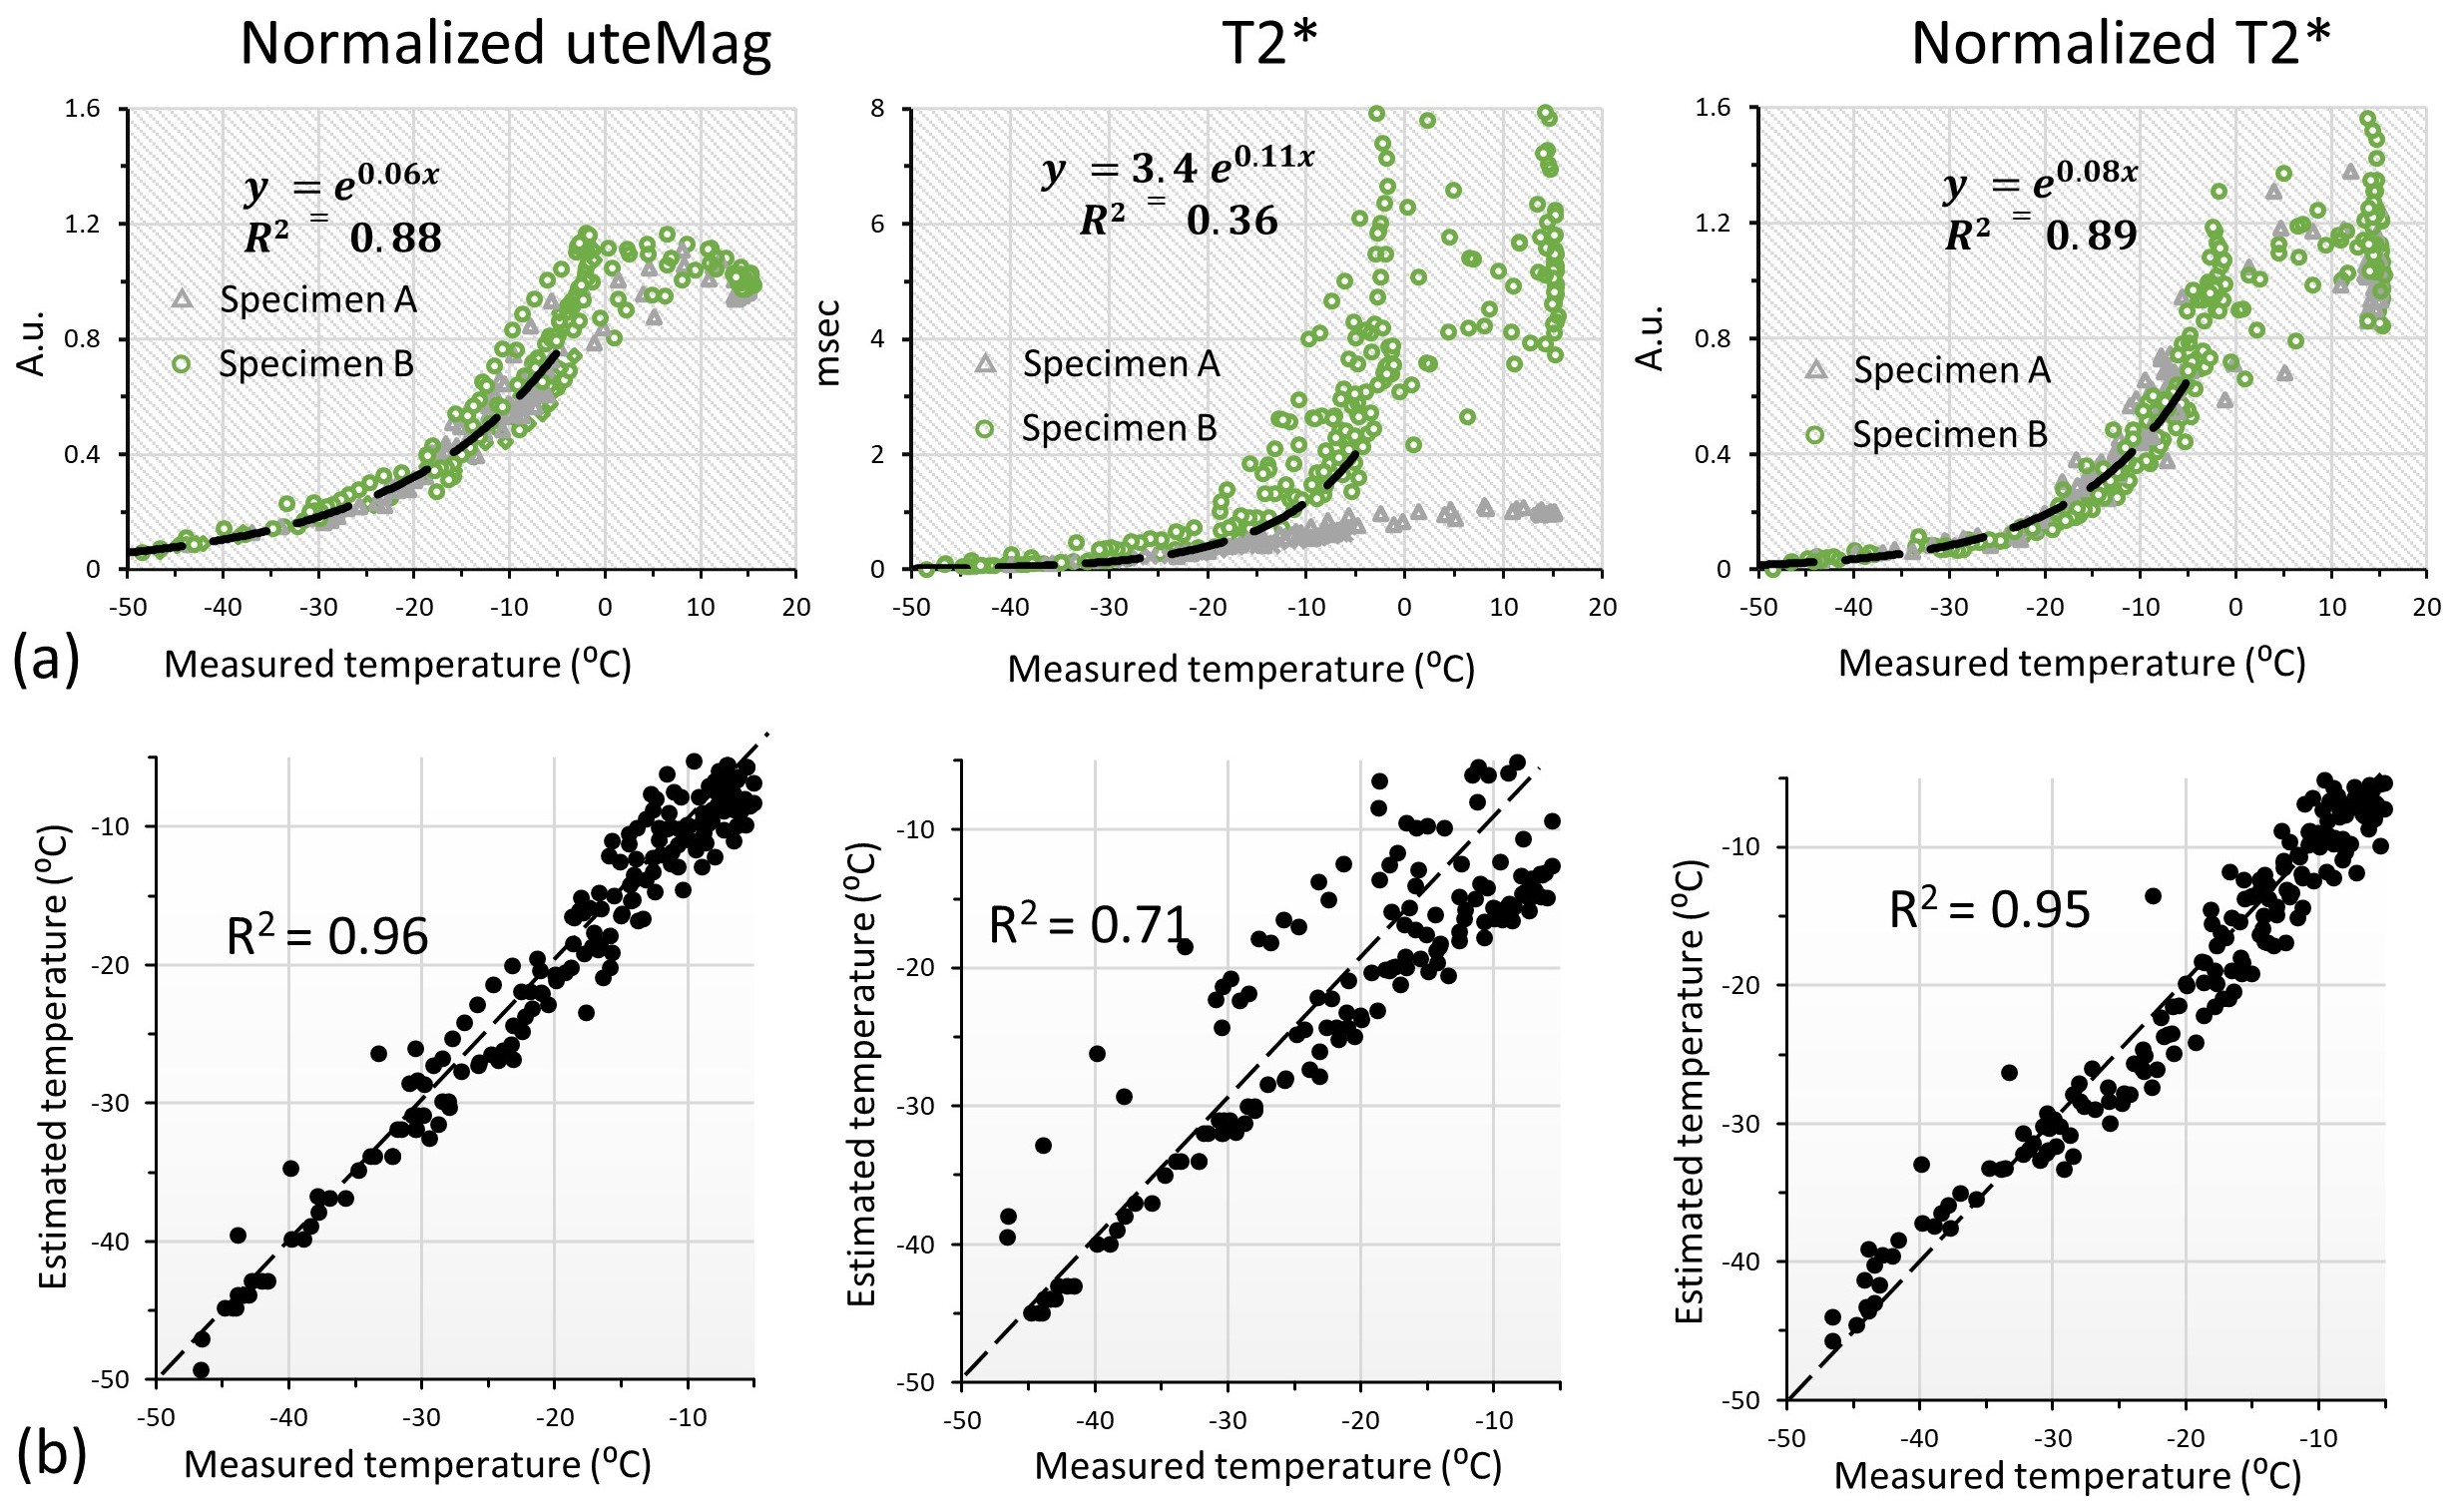
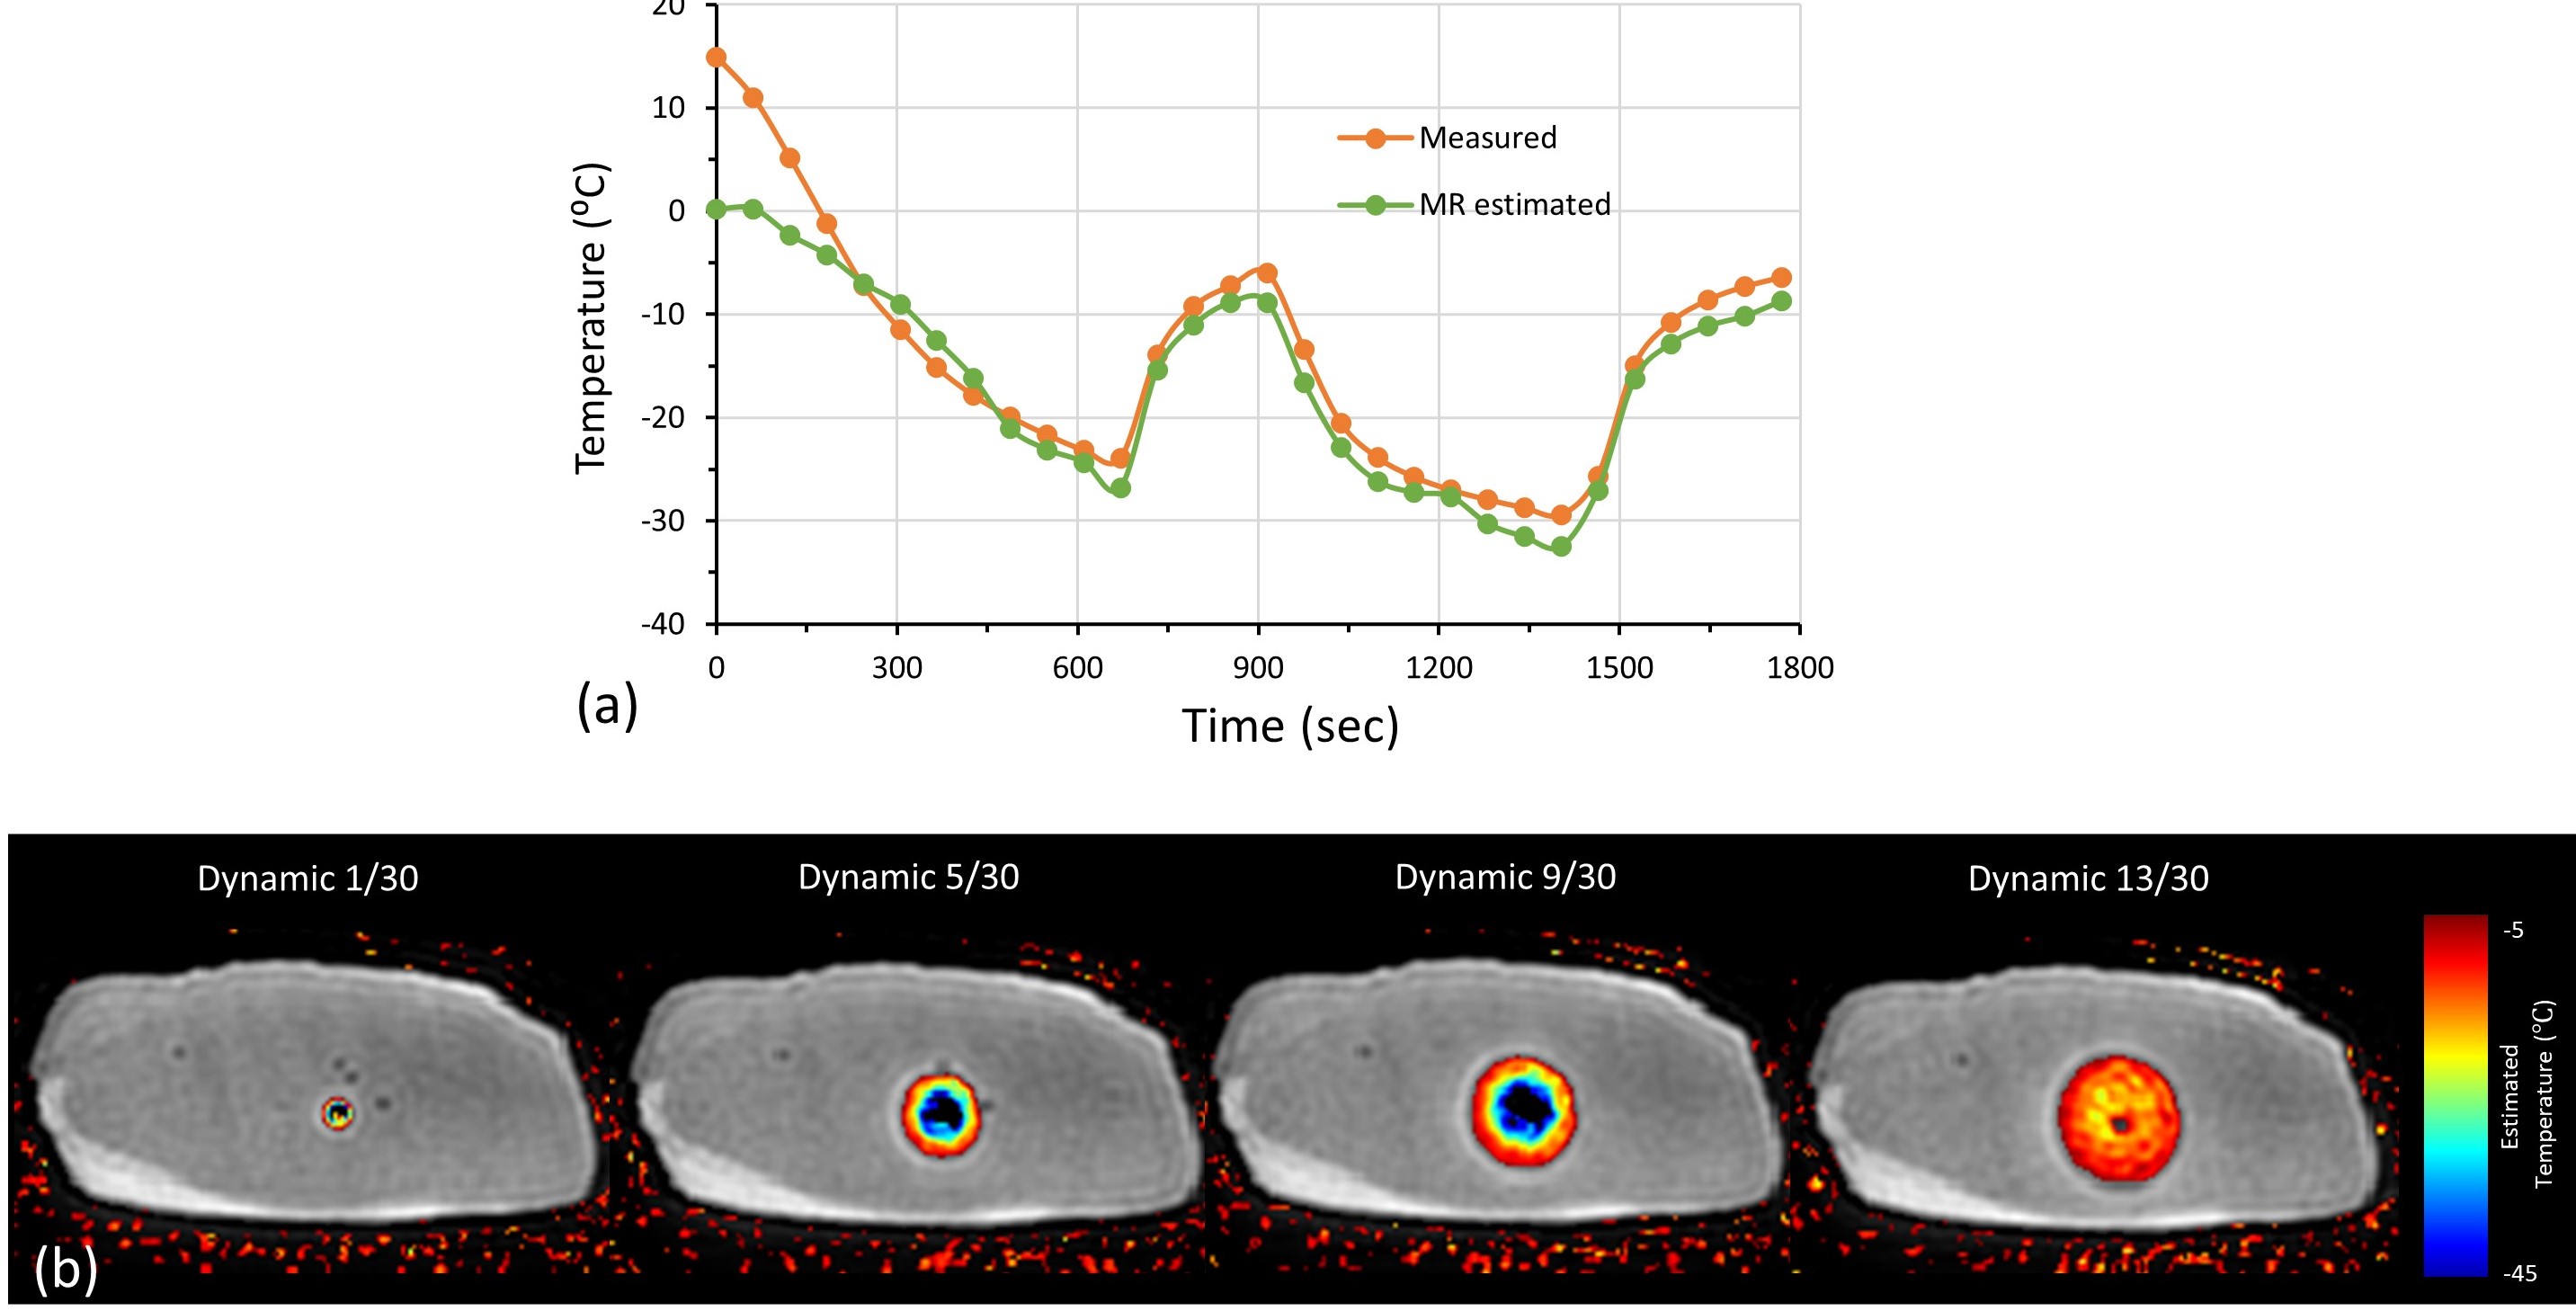
Phantom images obtained with AWSOS and SSCUTE are compared in Figure 2. SSCUTE visibly minimized the through-plane aliasing artifacts caused by the imperfect excitation profile of the short RF pulse used in this study. In the ex-vivo experiments, the average T2* obtained with SSCUTE from the baseline scans in porcine specimens A and B differed substantially (3.57±9.3 vs. 8.29±15.96). Figure 3 shows the MR images obtained with SSCUTE during a freeze-thaw cycle from specimen A along with the temperature measurements from sensors and MRI measurements from ROIs drawn around the sensors. All three methods (Normalized uteMag, T2*, and Normalized T2*) exhibited a similar trend as the temperature measurements in both specimens, while the T2* and Normalized T2* measurements were noisier for temperatures > -10 ⁰C. Figure 4a show plots of MRI measurements as a function of temperature. T2* showed large deviations between the two specimens, even in sub-zero temperatures, which differed from the previous work9. However, Normalized uteMag and Normalized T2* decayed similarly in both specimens, resulting in a calibration curve with a high correlation coefficient (R2 ~0.9). Figure 4b show plots of MRI estimated temperature as a function of the measured temperature. While the Normalized uteMag and Normalized T2* methods exhibited good agreement between the estimated and measured temperature, the Normalized uteMag method may be preferred because it requires only one-third of the scan time required by the Normalized T2* method. A plot of the measured and the MRI estimated temperature, along with overlayed temperature maps using Normalized uteMag, is shown in Figure 5.Conclusion
The feasibility of thermometry of frozen tissue at 1.5T using the SSCUTE sequence is demonstrated. Based on the preliminary results, thermometry with a 20-30 sec temporal resolution can be achieved using the Normalized uteMag method. The accuracy of the proposed method needs to be evaluated invivo on patients.Acknowledgements
No acknowledgement found.References
1. Morrison, P.R., Silverman, S.G., Tuncali, K. and Tatli, S. (2008), MRI-guided cryotherapy. J. Magn. Reson. Imaging, 27: 410-420. https://doi.org/10.1002/jmri.21260
2. Woodrum DA, Kawashima A, Karnes RJ, et al. Magnetic resonance imaging-guided cryoablation of recurrent prostate cancer after radical prostatectomy: initial single institution experience. Urology. 2013;82(4):870-875. doi:10.1016/j.urology.2013.06.011
3. Welch BT, Ehman EC, VanBuren WM, et al. Percutaneous cryoablation of abdominal wall endometriosis: the Mayo Clinic approach. Abdom Radiol (NY). 2020;45(6):1813-1817. doi:10.1007/s00261-019-02379-4
4. Baust, J.G. and Gage, A.A. (2005), The molecular basis of cryosurgery. BJU International, 95: 1187-1191. https://doi.org/10.1111/j.1464-410X.2005.05502.x
5. Gage AA, Baust J. Mechanisms of tissue injury in cryosurgery. Cryobiology. 1998;37(3):171-186. doi:10.1006/cryo.1998.2115
6. Tacke, J., Adam, G., Haage, P., Sellhaus, B., Großkortenhaus, S. and Günther, R.W. (2001), MR-guided percutaneous cryotherapy of the liver: In vivo evaluation with histologic correlation in an animal model. J. Magn. Reson. Imaging, 13: 50-56. https://doi.org/10.1002/1522-2586(200101)13:1<50::AID-JMRI1008>3.0.CO;2-A
7. Butts, K., Sinclair, J., Daniel, B.L., Wansapura, J. and Pauly, J.M. (2001), Temperature quantitation and mapping of frozen tissue. J. Magn. Reson. Imaging, 13: 99-104. https://doi.org/10.1002/1522-2586(200101)13:1<99::AID-JMRI1015>3.0.CO;2-O
8. Wansapura JP, Daniel BL, Vigen KK, Butts K. In vivo MR thermometry of frozen tissue using R2* and signal intensity. Acad Radiol. 2005;12(9):1080-1084. doi:10.1016/j.acra.2005.06.006
9. Kaye EA, Josan S, Lu A, Rosenberg J, Daniel BL, Pauly KB. Consistency of signal intensity and T2* in frozen ex vivo heart muscle, kidney, and liver tissue. J Magn Reson Imaging. 2010 Mar;31(3):719-24. doi: 10.1002/jmri.22029. PMID: 20187218; PMCID: PMC2832094.
10. Overduin, C.G., Fütterer, J.J. and Scheenen, T.W. (2016), 3D MR thermometry of frozen tissue: Feasibility and accuracy during cryoablation at 3T. J. Magn. Reson. Imaging, 44: 1572-1579. https://doi.org/10.1002/jmri.25301
11. Tokuda J, Wang Q, Tuncali K, Seethamraju RT, Tempany CM, Schmidt EJ. Temperature-Sensitive Frozen-Tissue Imaging for Cryoablation Monitoring Using STIR-UTE MRI. Invest Radiol. 2020 May;55(5):310-317. doi: 10.1097/RLI.0000000000000642. PMID: 31977600; PMCID: PMC7145748.
12. Anderson AG 3rd, Wang D, Pipe JG. Controlled aliasing for improved parallel imaging with a 3D spiral staircase trajectory. Magn Reson Med. 2020;84(2):866-872. doi:10.1002/mrm.28154
13. Qian, Y. and Boada, F.E. (2008), Acquisition-weighted stack of spirals for fast high-resolution three-dimensional ultra-short echo time MR imaging. Magn. Reson. Med., 60: 135-145. https://doi.org/10.1002/mrm.21620
Figures