5001
Real-time automatic temperature regulation during in-vivo MRI-guided Laser-induced Thermo-Therapy (MR-LITT)1University of Bordeaux, CNRS, CRMSB, UMR 5536, IHU Liryc, Bordeaux, France, Metropolitan, 2Certis Therapeutics, Pessac, France, 3ALPhANOV, Talence, France
Synopsis
Keywords: Interventional Devices, MR-Guided Interventions
The presented method allows to automatically adjust laser power relying on real-time rapid volumetric MR-thermometry using the proton resonance frequency (PRF) shift technique. The laser output power is regulated every second to force temperature to follow a predefined temperature-time profile using a PID controller, taking MR-temperature data as input. The proposed temperature regulation algorithm is successfully validated in vivo in the skeletal muscle of a pig.Introduction
Laser Induced Thermo-Therapy (LITT) is a minimally invasive procedure that exploits localized heat deposition during several minutes to irreversibly alter pathological tissue. It is clinically applied for the treatment of glioblastoma or epilepsy in the brain1,2 and for cancer3 ablation. A moderate temperature increase (40-43°C) can also be exploited to stimulate the immune response to enhance anti-tumor action4,5 for example. We evaluate here a feedback-control algorithm6 that forces the maximum temperature measured by real-time volumetric MR-thermometry at the targeted region to follow a predefined temperature-time profile, using a PID controller combined with real-time MR-thermometry. The method is implemented on a clinical MRI scanner and evaluated in vivo in the leg of a pig during LITT.Material & Methods
LITT device: A prototype (Alphanov, France) LITT device (976 nm wavelength, 200 µm fiber core diameter) with a distal glass diffuser tip (1.8 mm diameter) of 1 cm length was inserted into a leg muscle of an anesthetized pig (N=2, ~35 kg body mass, protocol approved by ethic committee). The laser unit was interfaced with the Gadgetron7 to update in real-time its output power.Real-time MRI thermometry pipeline: MRI data were collected on a 1.5 T clinical MRI (Avanto, Siemens Healthineers). A stack of 8 slices of MR-temperature images was acquired every second using a multi-slice single-shot echo planar imaging sequence8 (TE=21 ms, TR=1000 ms, FA=70 °, FOV=160 mmx160 mm, 1.4 mmx1.4 mmx3 mm voxel size, GRAPPA acceleration=2, partial Fourier=6/8, bandwidth/pixel=1445 Hz). The stack of slices was positioned perpendicular to the laser probe located into the leg using a 3D MPRAGE sequence (TI=1000 ms, TE=3 ms, TR=2000 ms, FA=15 °, FOV=192 mmx162 mmx240 mm, 1 mm isotropic voxel size). MR images and resulting temperature data were reconstructed and processed on the fly using an in-house developed thermometry pipeline in the Gadgetron environment, including a temporal kalman filter9 to reduce noise on temperature images without introducing latency. Temperature and thermal dose images (CEM43=240 min taken as the threshold) were displayed in real-time (Certis Solution, Certis Therapeutics, France).
Regulation algorithm: The laser power to be applied was calculated and updated according to MR-temperature measurements thanks to a dedicated processing implemented in the thermometry pipeline. The controller is a proportional-integral-derivative (PID) algorithm which is based on the error $$$\xi\left(\vec{r},t\right)$$$ between the target temperature $$$T_t\left(\vec{r},t\right)$$$ and the measured one $$$T_m\left(\vec{r},t\right)$$$ at a time t and a location $$$\vec{r}$$$. To anticipate in vivo temperature evolution regarding the applied power P (W) and thermal absorption α (°C⋅s-1⋅W-1) and diffusivity D (mm2⋅s-1) coefficients, the PID equation is combined to the Bio Heat Transfer Equation10 resulting in:
$$P\left(t\rightarrow t+\Delta t\right)=\frac{1}{\alpha}\left[\frac{\partial T_t\left(t\right)}{\partial t}-D\cdot\nabla^2T_m\left(t\right)+q\left[T_t\left(t\right)-T_m\left(t\right)\right]+\frac{q^2}{4}\int_{0}^{\tau}\left[T_t\left(t\right)-T_m\left(t\right)\right]d\tau\right](1)$$
The parameter tr=2/q was tuned to adapt the response time of the controller so that tr is several times greater than the latency time of the system.
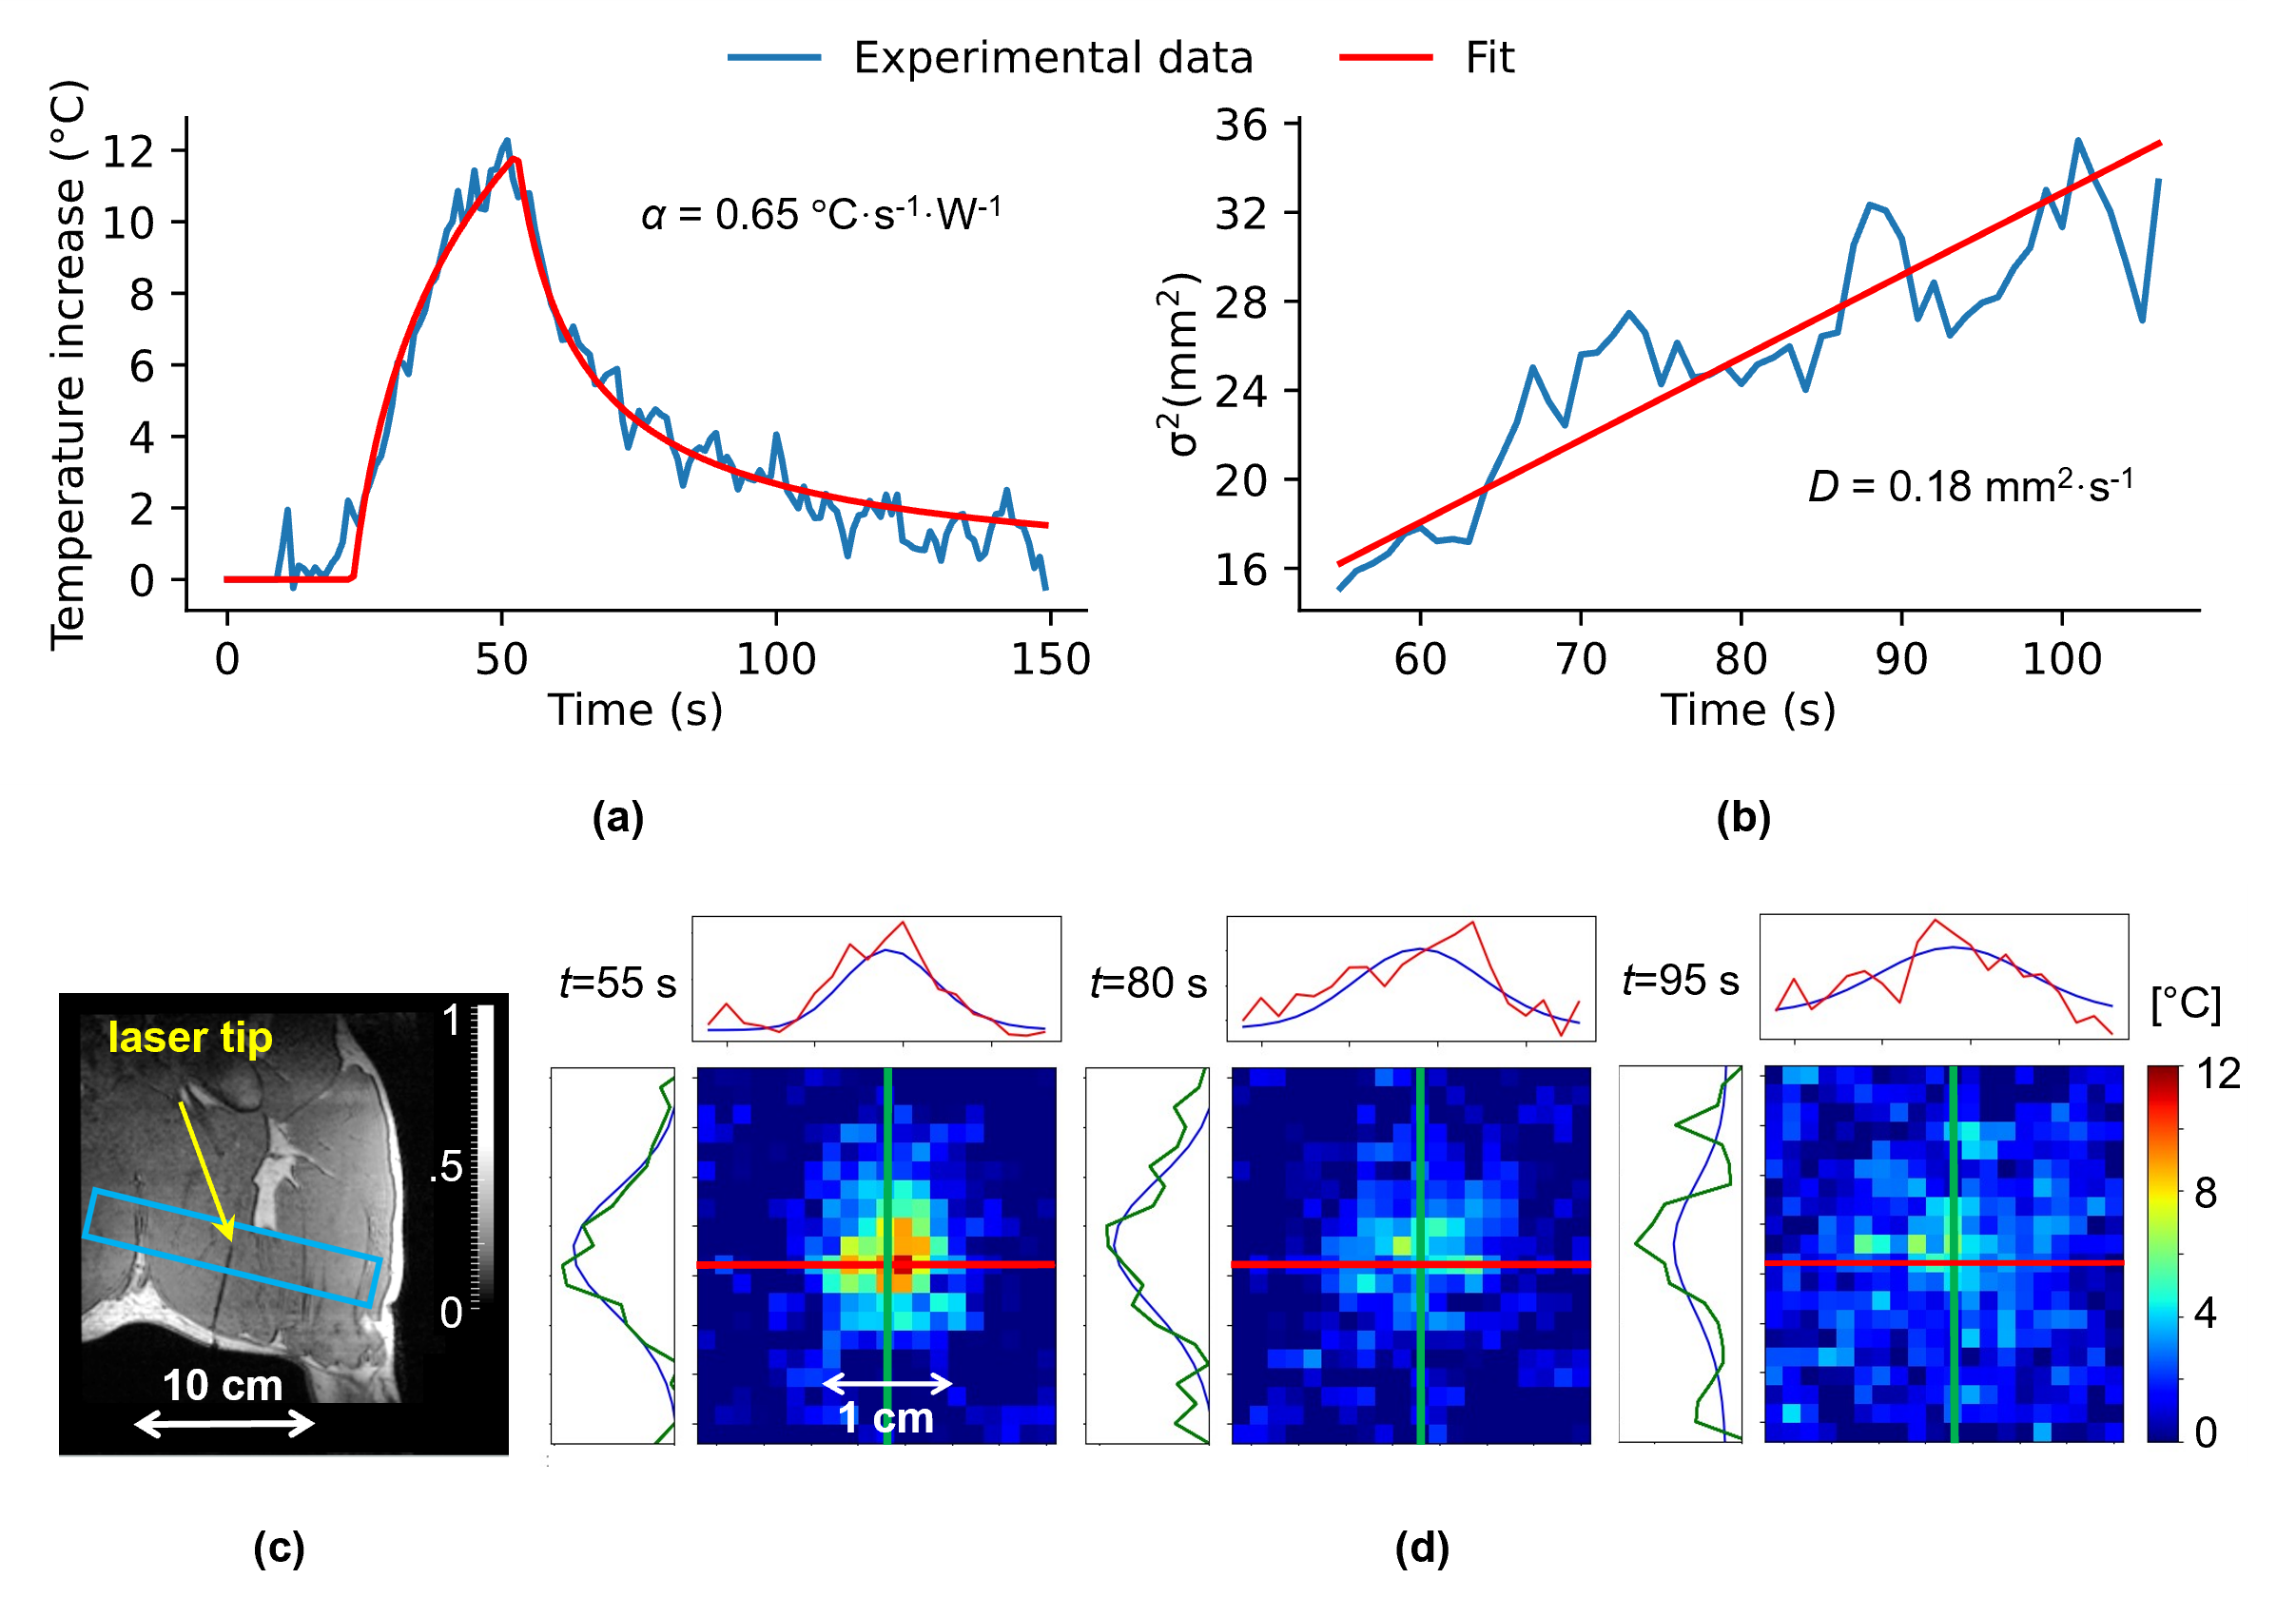
Initial low power test shot: To locate the heated area and estimate thermodynamic parameters, a continuous wave low power laser emission was applied during a few seconds under MR-thermometry. The voxel showing the maximal temperature value was determined and the 3x3x3 voxels ROI used for temperature regulation was automatically centered on this voxel. The thermal absorption and diffusivity coefficients were automatically estimated from these temperature images using a previously described methodology11. The resulting values were used as input in Equation 1.
Results
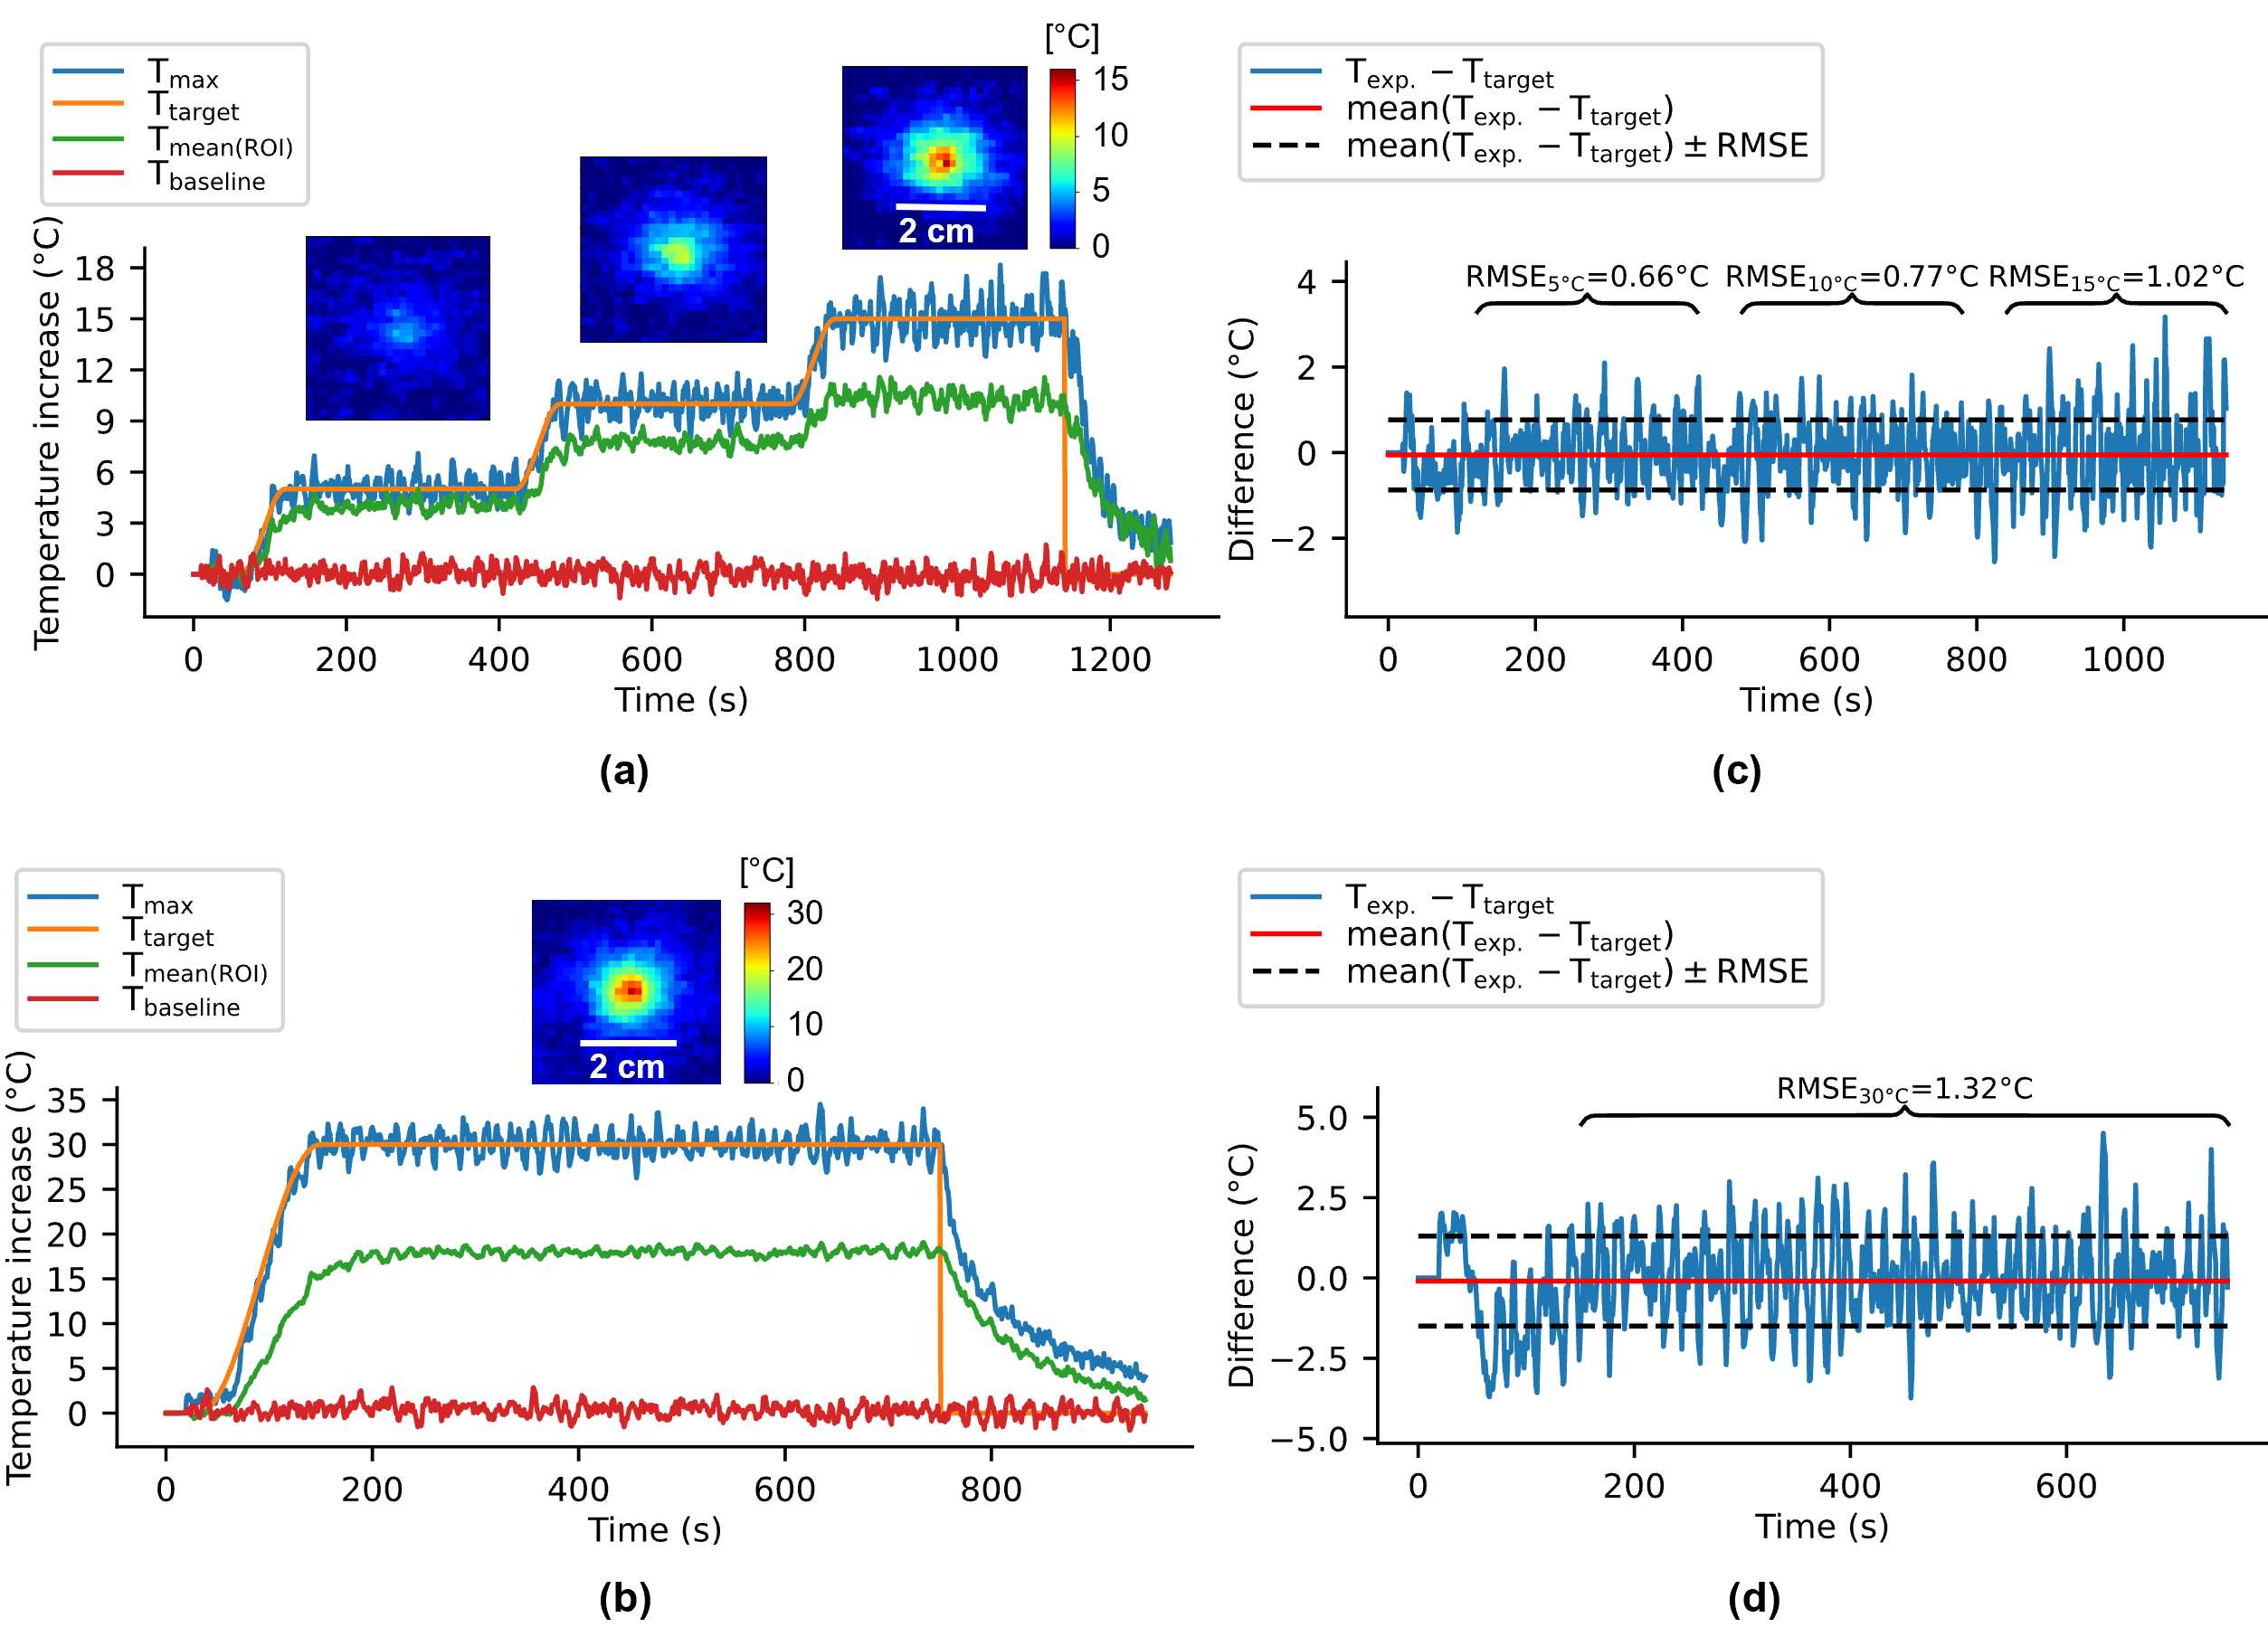
The laser probe and the thermometry stack of slices positions can be visualized in Figure 1c (coronal view). α and D parameters were estimated at α=0.65 °C⋅s-1⋅W-1 and D=0.18 mm2⋅s-1 with an initial test shot (2W during 30s) whose fit results are shown in Figure 1a,b,d.Figure 2 shows two examples of the automatic temperature regulation for a first predefined heating profile with 3 steps of 5°C, 10°C and 15°C (Figure 2a) and a second one if a unique plateaus of 30°C increase (Figure 2b). Corresponding temperature maps are shown on their corresponding plateau, and Figure 2c,d displays the difference between measured and target temperature curves over the laser emission duration for experiments (a) and (b) respectively. Mean differences are ma=-0.052°C and mb=-0.098°C for experiments (a) and (b) respectively and maximum RMSE is 1.4°C showing the good stability of the algorithm for long time heating.
Conclusion & Discussion
The presented automatic temperature controller provides a precise control of in vivo tissue temperature in leg muscle over long heating durations (>15 minutes) for low/medium and high temperatures increases. Such method can be used for various therapeutic strategies such as coagulation necrosis, local drug delivery or in combination with immunotherapy, where different heating protocols are required.Acknowledgements
Stéphane Bloquet, Emilie Escurier and Virgine Loyer are gratefully acknowledged for their assistance during animal experiment. This study was conducted in the framework of the University of Bordeaux's IdEx "Investments for the Future" program RRI "IMPACT" that received financial support from the French government. This work was partly funded by research grants from Agence Nationale de la Recherche (projects CARCOI (ANR-19-CE19-0008-02) and IHU-LIRYC (ANR-10-IAHU04-LIRYC)).
References
1. Diaz, R. et al. Laser Interstitial Thermal Therapy: Lighting the Way to a New Treatment Option in Neurosurgery. Neurosurgery 79, S3–S7 (2016).
2. Karampelas, I. & Sloan, A. E. Laser-Induced Interstitial Thermotherapy of Gliomas. Prog. Neurol. Surg. 32, 14–26 (2018).
3. Schena, E., Saccomandi, P. & Fong, Y. Laser Ablation for Cancer: Past, Present and Future. JFB 8, 19 (2017).
4. Skitzki, J. J., Repasky, E. A. & Evans, S. S. Hyperthermia as an immunotherapy strategy for cancer. Curr. Opin. Investig. Drugs 10, 550–8 (2009).
5. Hildebrandt, B. et al. The cellular and molecular basis of hyperthermia. Crit. Rev. Oncol. Hematol. 43, 33–56 (2002).
6. Desclides, M. et al. Real-time automatic temperature regulation during MRI-guided Laser Interstitial Thermal Therapy (MR-LITT). Int. Soc. Mag. Reson. Med. (2022).
7. Hansen, M. S. & Sørensen, T. S. Gadgetron: An open source framework for medical image reconstruction: Gadgetron. Magn. Reson. Med. 69, 1768–1776 (2013).
8. Ozenne, V. et al. Improved cardiac magnetic resonance thermometry and dosimetry for monitoring lesionformation during catheter ablation. Magn. Reson. Med. 77, 673–683 (2017).
9. Kalman, R. E. A New Approach to Linear Filtering and Prediction Problems. Journal of Basic Engineering 82, 35–45 (1960).
10. Pennes, H. H. Analysis of Tissue and Arterial Blood Temperatures in the Resting Human Forearm. J. Appl. Physiol. 30 (1948).
11. Quesson, B., Vimeux, F.,
Salomir, R., de Zwart, J. A. & Moonen, C. T. W. Automatic control of
hyperthermic therapy based on real-time Fourier analysis of MR temperature
maps. Magn. Reson. Med. 47, 1065–1072 (2002).
Figures