4996
Optimization of EPI based PRF thermometry at 0.5 T
Chad T Harris1, Curtis N Wiens1, Diego F Martinez2, Andrew T Curtis1, and Blaine A Chronik2
1Research and Development, Synaptive Medical, Toronto, ON, Canada, 2The xMR Labs, Department of Physics and Astronomy, Western University, London, ON, Canada
1Research and Development, Synaptive Medical, Toronto, ON, Canada, 2The xMR Labs, Department of Physics and Astronomy, Western University, London, ON, Canada
Synopsis
Keywords: Data Acquisition, Thermometry
Echo planar imaging (EPI) is well-suited for temperature mapping in the mid-field (0.5T) thanks to longer T2* values that can be leveraged without prohibitively slow update rates. In this work, we optimize EPI based PRF thermometry acquisitions for mid-field MRI. Digital simulations and in-vivo temperature stabilities were computed over echo times ranging from 50ms – 100ms. The optimal mean temperature uncertainty over the entire acquisition volume was measured to be approximately 1⁰C demonstrating that EPI based thermometry provides clinically viable sensitivity at 0.5T with sufficient image resolution and extremely fast update rates (1.3-2 s).Introduction
MR imaging in the mid-field (0.5T) offers several benefits: compact design facilitating simpler siting, low susceptibility-based geometric distortion, and reduced heating with or without the presence of implants. Lower field strengths do cause challenges for MR thermometry, an application critical for monitoring interventional thermal procedures. Reduced SNR from lower polarization is compounded by decreased sensitivity to temperature induced resonance shifts. As a result, accurate PRF thermometry with fast update rates using conventional gradient echo imaging in the mid-field is difficult. Echo planar imaging (EPI) is well-suited for temperature mapping in the mid-field thanks to longer T2* values that can be leveraged without prohibitively slow update rates. The purpose of this work was to optimize EPI based PRF thermometry acquisitions at 0.5T.Methods
An EPI protocol was used for all simulations and in-vivo acquisitions, using parameters in Table 1. For cases where minimum TR was used, the excitation flip angle was set to the Ernst angle for gray matter (T1=715 ms) [1].Simulations
SNR was computed over a range of echo times (20 ms – 140 ms) for gray matter, assuming full recovery (TR = 5000 ms; flip angle = 90⁰; SNR0 = 30) for three representative T2* values (70 ms, 80 ms, and 90 ms). SNR was converted to temperature uncertainty using:$$$\sigma_T=\frac{1}{\gamma \alpha B_0 SNR \cdot TE}$$$, where $$$\alpha$$$ = -0.01 ppm/°C[2].
Next, for echo times ranging from 47 ms – 140 ms, SNR was computed with minimum TR using the same SNR0 and T2* values as before. These values were similarly converted to temperature uncertainty and compared to the full recovery case.
Since update rate is a metric of interest for thermometry, temperature uncertainties were further converted to temperature precision efficiency values defined as: $$$P_T=\frac{1}{\sigma_T\sqrt{TR}}$$$. This value should be maximized for best results.
Finally, to explore the minimum TR parameter space, SNR was computed for white and gray matter over a range of parameters (25 ≤ SNR0 ≤ 35; 70 ms ≤ T2* ≤ 90 ms; T1wm = 490 ms; T1gm = 715 ms) for TEs ranging from 50 ms – 100 ms and compared to in-vivo measurements.
In-vivo Acquisitions
Imaging was performed on two healthy volunteers with informed consent in compliance with health and safety protocols. All imaging was acquired on a head-specific 0.5T MR system (Synaptive Medical, Toronto, Ontario) equipped with an 8-channel head coil. For each volunteer, a set of 6 EPI time series were acquired at different TEs ranging from 50ms to 100ms. Imaging parameters for all acquisitions are shown in Table 1.
Temperature Map Reconstruction
The phase difference of each image was calculated with respect to the first time point. A first order polynomial fit of a reference region on the boundary of the brain was used to remove baseline phase changes [2]. Finally, voxel-wise standard deviations over the time series were computed on the phase and magnitude images to calculate temperature uncertainties and temporal SNR respectively.
Results
Simulation results comparing the temperature uncertainty and acquisition efficiency of fully recovered signal to minimum TR signal are shown in Figure 1.Figure 2 displays the temperature uncertainty for the first subject on a representative slice over all echo times.
Figure 3 compares the mean values of SNR and temperature uncertainty of the in-vivo acquisitions to theory. As one can see in the figure, the measurements agree very well with the theoretical predictions.
Discussion
The temperature uncertainties measured with EPI are within clinically acceptable thresholds for MR based thermometry (< 2⁰C), with an excellent update rate of ~1.3-2 seconds for 13 slices covering 3.9 cm. The fast update rate of EPI can further be traded off for more slab coverage or reduced temperature uncertainty.The longer T2* (70-90ms) observed in the mid-field results in temperature uncertainties and efficiency curves that do not show strong TE dependence for TEs around the optimal TE. This was observed both in simulations (Figure 1) and in-vivo (Figure 3). This implies that the penalty for using the wrong target T2* or not hitting the optimal TE is relatively small.
An optimal TE equal to T2* applies in situations where the flip angle and TR remain constant over varying echo time. However, for a time-optimized stack of interleaved slices, the TR will inevitably increase as TE increases. To account for the changing TR, we computed a temperature precision efficiency value, which peaked at a TE lower than T2* for our parameters.
The analysis performed is highly dependent on TR which is primarily dictated by the number of slices required by the application. In applications where the number of slices and the TR differ considerably from the results shown, simulations should be repeated as the trend could significantly deviate. We intend to fully characterize this relationship in future work.
Conclusions
EPI based thermometry with clinically viable sensitivity and temporal resolution is feasible at 0.5T. Mean temperature uncertainties over the entire brain were measured to be ~1⁰C, lying within clinically acceptable thresholds for monitoring interventional thermal procedures.Acknowledgements
No acknowledgement found.References
1. A.E. Campbell-Washburn, et al. Image contrast at 0.55T. ISMRM 2019, #1214.
2. V. Rieke, et al. Referenceless PRF shift thermometry. MRM, 51:1223-1231, 2004.
Figures
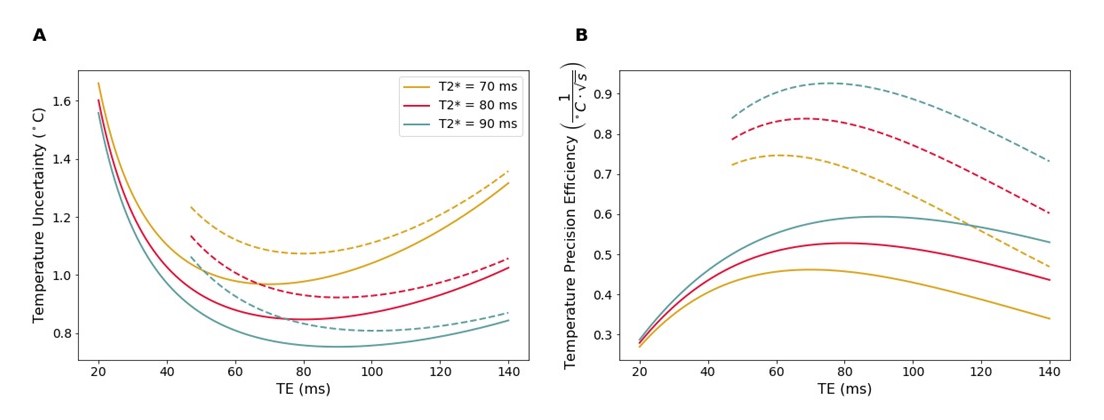
Figure 1. A)
Temperature uncertainty of a 2D EPI, 13 slice stack vs TE for fully
recovered signal (solid lines) and min TR (dotted lines). Longer
T2* results in lower uncertainty and a shallower trough in
the curve. Reducing TR increases uncertainty, with an even shallower trough. B) Temperature precision efficiency for the curves in A. Min TR sequences are more efficient than full recovery. Also, whereas
the peak of the full recovery curves occur at TE = T2*, the peak for min TR occur at lower TE values (61.2 ms, 68.6 ms,
and 75.6 ms for T2* = 70 ms, 80 ms, and 90 ms respectively).
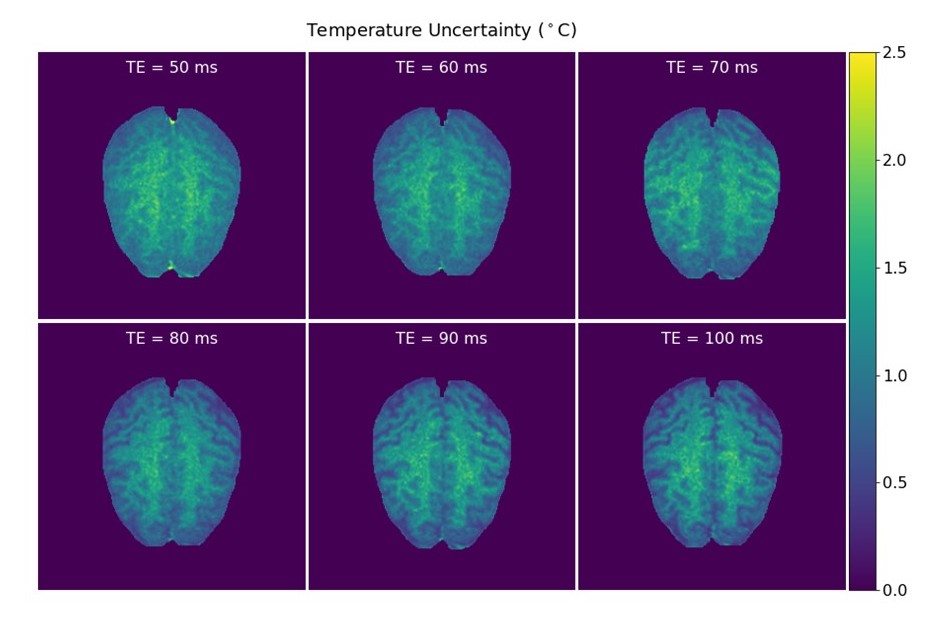
Figure 2. Temperature
uncertainty for an example slice for subject 1 over all echo times. The average
temperature over the entire stack was less than 1.2⁰C for all echo times. It is
interesting to note that the uncertainty is higher in the white matter of the
brain compared to the gray matter. This is expected based on our analysis since
the T2* of white matter is typically shorter than that of gray matter.
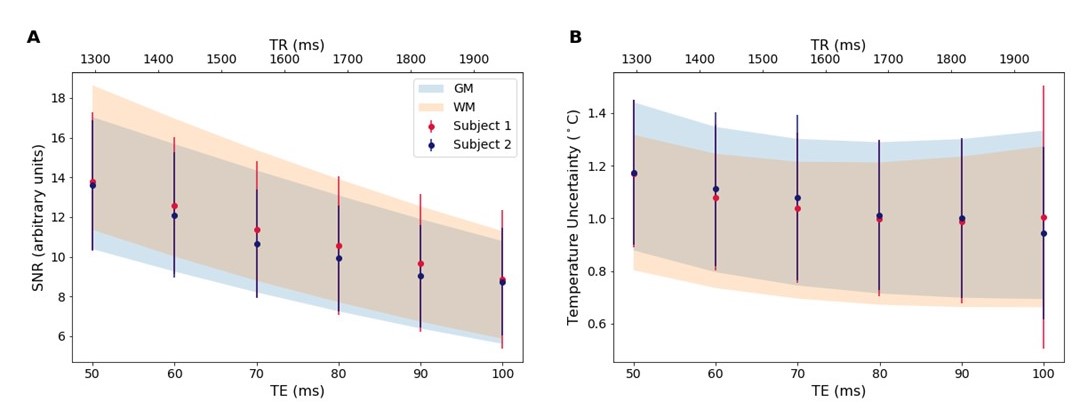
Figure 3. Comparison
of average SNR (A) and temperature uncertainty (B) over the acquired volume for
each subject with theoretical predictions for white and gray matter plotted vs
TE (bottom axis) and TR (top axis). The measured values agree well with theory.
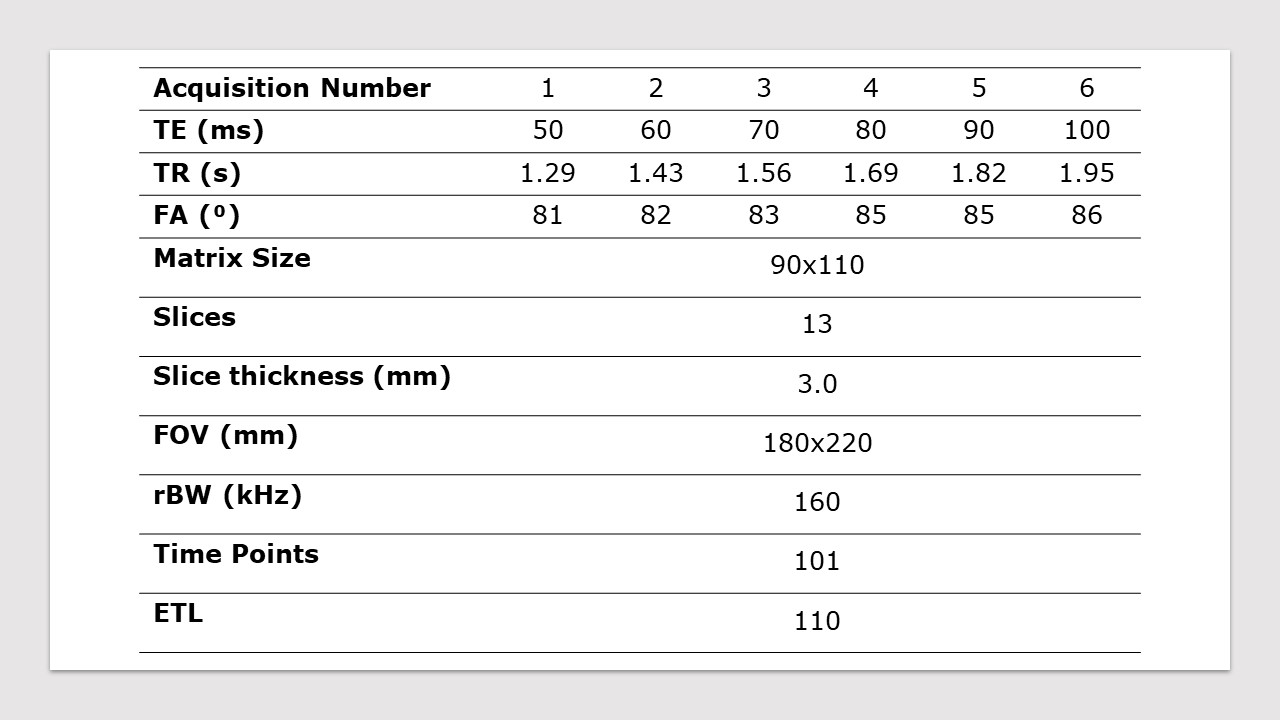
Table 1: In-vivo and
simulation acquisition parameters.
DOI: https://doi.org/10.58530/2023/4996