4995
Evaluating Various Phase Drift Correction Methods in PRFS-based Thermometry in the Pelvic Region of Free-Breathing Volunteers1Institute for Diagnostic and Interventional Radiology, Hannover Medical School, Hannover, Germany, 2STIMULATE-Solution Centre for Image Guided Local Therapies, Magdeburg, Germany
Synopsis
Keywords: System Imperfections: Measurement & Correction, Thermometry, Proton Resonance Frequency Shift, Phase Drift
Proton Resonance Frequency Shift Thermometry relies on a homogeneous B0-field as the B0-field significantly influences the resonance frequency. A multitude of phase drift correction methods have been proposed. The temperature accuracy and computing time of reference-less phase estimation, prospective, and fat-based phase correction have been evaluated in a manually segmented dorsal muscle ROI in the pelvic region of free-breathing volunteers. The evaluated phase drift correction methods correct phase drift comparably regarding temperature accuracy. Fat-based and prospective phase correction are almost ten times faster than reference-less phase estimation but require a reliable baseline acquisition.Introduction
Proton Resonance Frequency Shift thermometry (PRFS-T) is a promising technique for temperature monitoring during MR-guided thermal ablation due to the hydrogen nuclei’s temperature-dependent resonance frequency in aqueous tissue1. The phase difference between an image and either a baseline image or a mathematical approximation of the background phase yields a temperature estimate1,2. However, minor distortions of the main magnetic field (B0) will yield incorrect temperature estimations due to the strong dependence of the resonance frequency on B03. Thus, the temporal deviation of B0 is commonly referred to as phase drift. Phase drift is known to be more pronounced during acquisitions with extensive gradient usage3, e.g., during MR-guided interventions. Various phase drift correction methods have been proposed. A clinically viable phase drift correction must accurately and swiftly correct B0 deviations. Therefore, the computing time and temperature accuracy of reference-less phase estimation (RPE)4, fat-based phase correction (fat-based PC)5, and weighted Prospective Phase Correction (PPC)6 have been evaluated in the pelvic region of free-breathing volunteers and compared to the uncorrected thermometry data to assess the performance.Methods
A Siemens 1.5T Magnetom Avanto was used to image the pelvic region of five free-breathing human volunteers utilizing a gradient-recalled multi-echo 3D Stack-of-Stars sequence with an isotropic spatial resolution of 2.5 mm3. Total acquisition time was approximately 10:40 min with a two-minute baseline and a temporal resolution of 18.5 s afterward. Images were reconstructed retrospectively on a Linux server (2x Intel Xeon Silver 4210R, 128 GB RAM, 2x NVIDIA Quadro RTX6000). The temperature calculations accounted for increased phase sensitivity as TE nears T2* by weighting with TE1.PPC assumes the k-space center’s phase drift to represent the global phase drift and linearity in time and TE. The time dependency of the baseline’s k-space center’s phase’s slope is determined by a weighted least squares fit (weighting with magnitude and TE). The phase drift can be extrapolated to future points, and the phase corrected accordingly.
The fat-based PC determines the mean phase drift in tissue with fat content >80% for each image and adjusts the phase accordingly. The fat masks were calculated using the Dixon-RAVE7. RPE used an iteratively reweighted least squares algorithm to fit a polynomial to the background phase and was extended to three dimensions. The polynomial order was chosen by minimizing the standard deviation of the baseline’s temperature change for each volunteer separately2. The median temperature change in manually segmented ROI of dorsal muscle in the pelvic region over time was compared. Statistical testing was performed using a Kruskal-Wallis test followed by a Conover post-hoc test should the data vary statistically significantly (p<0.05). The computing time was averaged by dividing the number of acquired images by the time used in correcting the total data.
Results
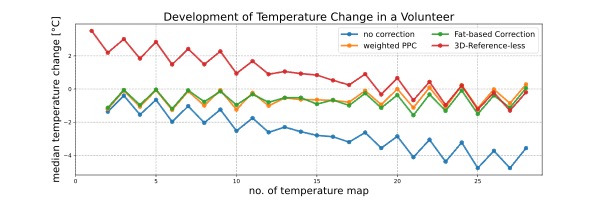
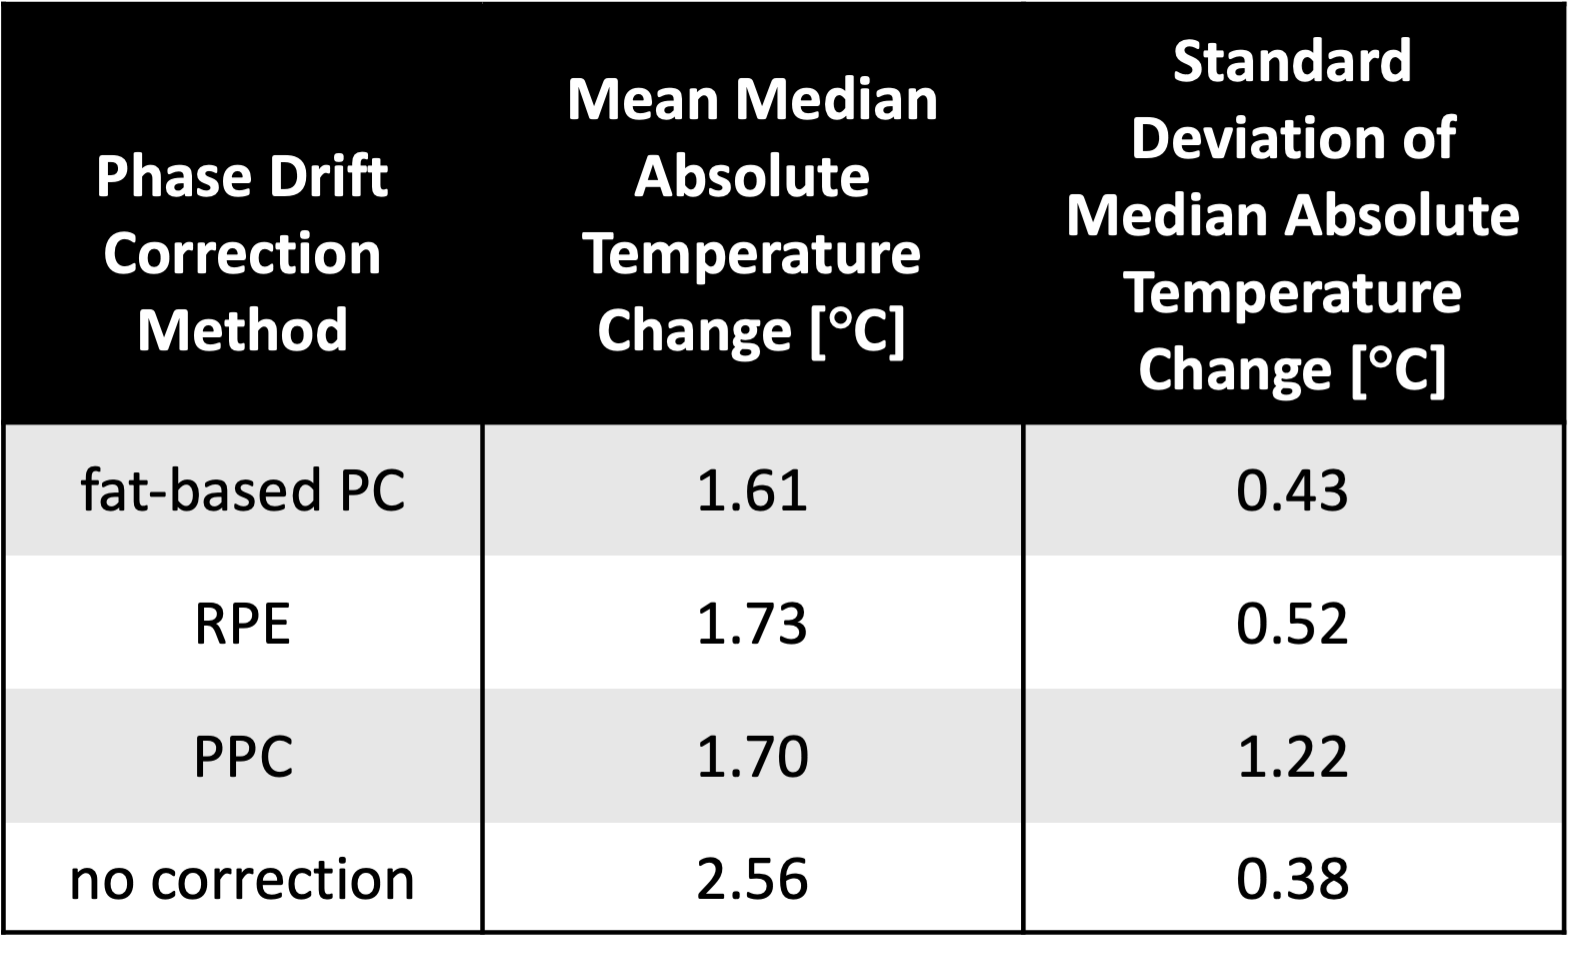
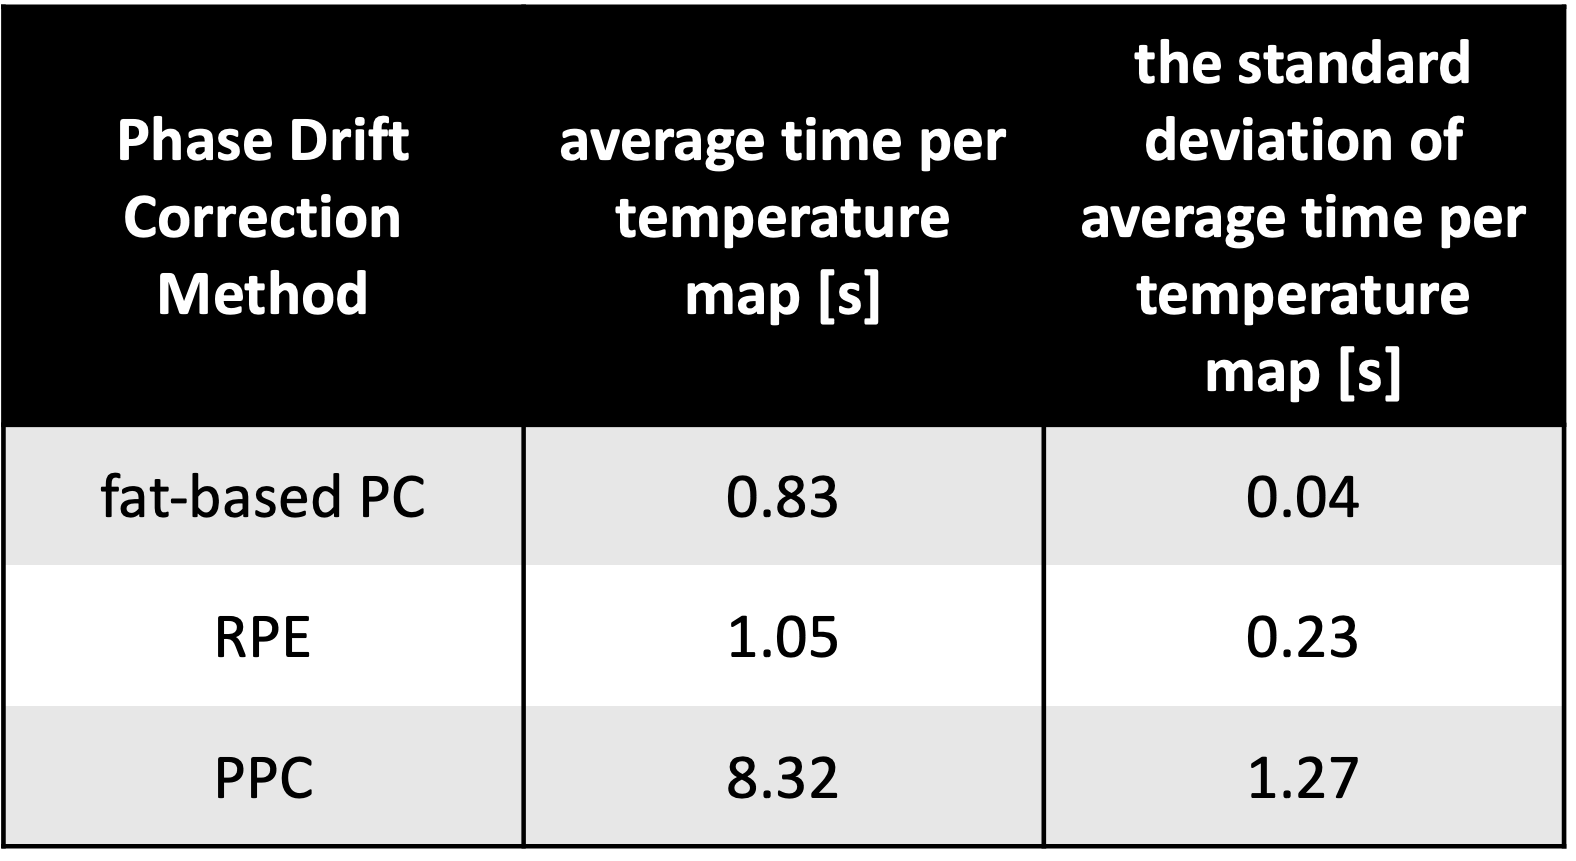
Without phase drift correction, PRFS-T estimated an average median absolute temperature change (mean ± standard deviation) of (2.56 ± 0.38) °C during the 10:40 min of acquisition. Corrected estimations yielded an average median absolute temperature change of (1.73 ± 0.52) °C for RPE, (1.70 ± 1.22) °C for PPC, and (1.61 ± 0.43) °C for fat-based PC. Figure 1 shows the evolution of estimated temperature over time for a representative volunteer. The RPE tends to overestimate the temperature initially, whereas fat-based PC tends to fluctuate minorly over time, and the PPC’S poor results during one acquisition tarnish its temperature accuracy statistics. The ideal order for RPE was second-degree polynomials for two volunteers and sixth-degree polynomials for the other volunteers. The Kruskal-Wallis test did not indicate any significant difference between the correction methods (p>0.08). The computing time for calculating and applying the drift corrections to a phase image of four echoes (mean ± standard deviation) was (8.32 ± 1.27) s for RPE, (1.05 ± 0.23) s for PPC, and (0.83 ± 0.04) s for fat-based PC.Discussion
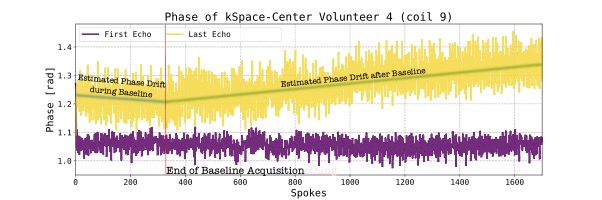
The evaluated methods improved PRFS-T except for PPC in one volunteer, where the phase drift did not initially increase linearly in time, cf. figure 2. Thus, it is necessary to investigate if the assumption of linearity in time and TE always holds for phase drift. The threshold for statistical significance of the Kruskal-Wallis test was set to p<0.05 due to the limited sample size of five volunteers. Nonetheless, the correction methods did not vary statistically significantly, and future studies with larger sample sizes should be conducted. Moreover, implementing a motion and susceptibility correction algorithm8 could be beneficial as the bowel appears to impact the temperature accuracy, and such correction would potentially improve the temperature maps’ homogeneities. Finally, the computing times of the methods differ fundamentally. PPC and fat-based PC compute an image per second, which could be sufficient for real-time PRFS-T. RPE takes over eight seconds to correct phase images. The extended computing of RPE is caused by the necessity to calculate the coefficients for images separately, which is also an inherent strength as RPE does not require a stable baseline acquisition2.Conclusion
All evaluated methods have improved PRFS-T. PPC and fat-based PC appear to be promising approaches for real-time PRFS-T. However, RPE requires too much computing time to envision real-time feasibility. Further testing and improvements are required, especially in regions of significant susceptibility changes and movement.Acknowledgements
No acknowledgement found.References
[1]: Bruno Madore. “MR Thermometry”. In: Advances in Magnetic Resonance Technology and Applications. Vol. 1. Elsevier, 2020, pp. 885–905.
[2]: Viola Rieke, Karl K. Vigen, et al. “Referenceless PRF shift thermometry”. In: Magnetic Resonance in Medicine 51.6 (2004), pp. 1223–1231.
[3]: AbdEl-Monem El-Sharkawy, Michael Schär, et al. “Monitoring and correcting spatiotemporal variations of the MR scanner’s static magnetic field”. In: MagneticResonance Materials in Physics, Biology and Medicine 19.5 (Nov. 2006), pp. 223–236.
[4]: William A. Grissom, Michael Lustig, et al. “Reweighted l1 referenceless PRF shiftThermometry”. en. In: Magnetic Resonance in Medicine 64.4 (June 2010), pp. 1068–1077.
[5]: Viola Rieke, MR Thermometry. In: Kahn, T., Busse, H. (eds) Interventional Magnetic Resonance Imaging. Medical Radiology. Springer, 2011, pp. 271-288.
[6]: Bryant T. Svedin, Allison Payne, et al. “Respiration artifact correction in three-dimensional proton resonance frequency MR thermometry using phase navigators:3D PRF Respiration Correction”. In: Magnetic Resonance in Medicine 76.1(July 2016), pp. 206–213.
[7]: Thomas Benkert, Li Feng, et al. “Free-breathing volumetric fat/water separation bycombining radial sampling, compressed sensing, and parallel imaging: Dixon RAdialVolumetric Encoding”. In: Magnetic Resonance in Medicine 78.2 (Aug. 2017), pp. 565–576.
[8]: Mingming Wu, Hendrik T. Mulder, et al. “Correction of motion-induced susceptibility artifacts and B0 drift during proton resonance frequency shift-based MR thermometry in the pelvis with background field removal methods”. In: Magnetic Resonance in Medicine 84.5 (2020), pp. 2495–2511.
Figures