4994
Deep Learning based drift field correction for MR Thermometry in the upper leg at 7T1Department of Radiology, University Medical Center Utrecht, Utrecht, Netherlands, 2Computational Imaging Group for MR diagnostics & therapy, Center for Image Sciences, University Medical Center Utrecht, Utrecht, Netherlands, 3Tesla Dynamic Coils BV, Zaltbommel, Netherlands, 4Department of Radiotherapy, University Medical Center Utrecht, Utrecht, Netherlands, 5Biomedical Image Analysis, Dept. Biomedical Engineering, Eindhoven University of Technology, Eindhoven, Netherlands
Synopsis
Keywords: Safety, Thermometry
PRFS-based MR Thermometry (MRT) bears strong potential for RF safety assessment. However, PRFS-MRT is impaired by external sources of frequency shift. It is hypothesized that deep learning will be able to separate the PRFS signal from these other sources of frequency shift. This study has tested this concept on drift field correction for MRT in the human thigh at 7T. A convolutional neural network is trained using synthetic phase difference images based on measured drift fields and simulated temperature distributions. Results show that the proposed deep-learning approach is able to correctly predict both simulated and measured temperature rise distributions.INTRODUCTION
One of the main safety concerns in UHF-MRI is local heating of the subject due to RF exposure. Local heating is constrained by limiting the peak local Specific Absorption Rate (SAR). Power constraints to achieve this are obtained by numerical simulations. However, MRI enables the measurement of temperature distributions within the imaging subject using MR Thermometry (MRT). This could facilitate validation of models and provide insight into temperatures actually being reached during MRI. One of the most accurate MRT methods exploits the local frequency shift of water spins proportional to temperature (proton resonance frequency shift, PRFS1,2). However, the PRFS is nevertheless hindered by external sources of frequency shift which have to be compensated3-5 (e.g., B0 field drift, breathing, cardiac pulsation, motion etc.). It is expected that the spatial patterns of these disturbing factors are distinctly different from the RF heating patterns and can therefore be separated by deep learning.In the last few years, deep learning approaches and convolutional neural networks (CNNs) have been successfully exploited in several medical image analysis applications such as denoising, reconstruction, segmentation, etc. Recently, a deep learning–based approach for subject‐specific SAR estimation was also presented6. In this study we test whether we can use deep learning to separate the drift field from the PRFS induced phase shifts for MRT in the human thigh at 7T.
MATERIAL AND METHODS
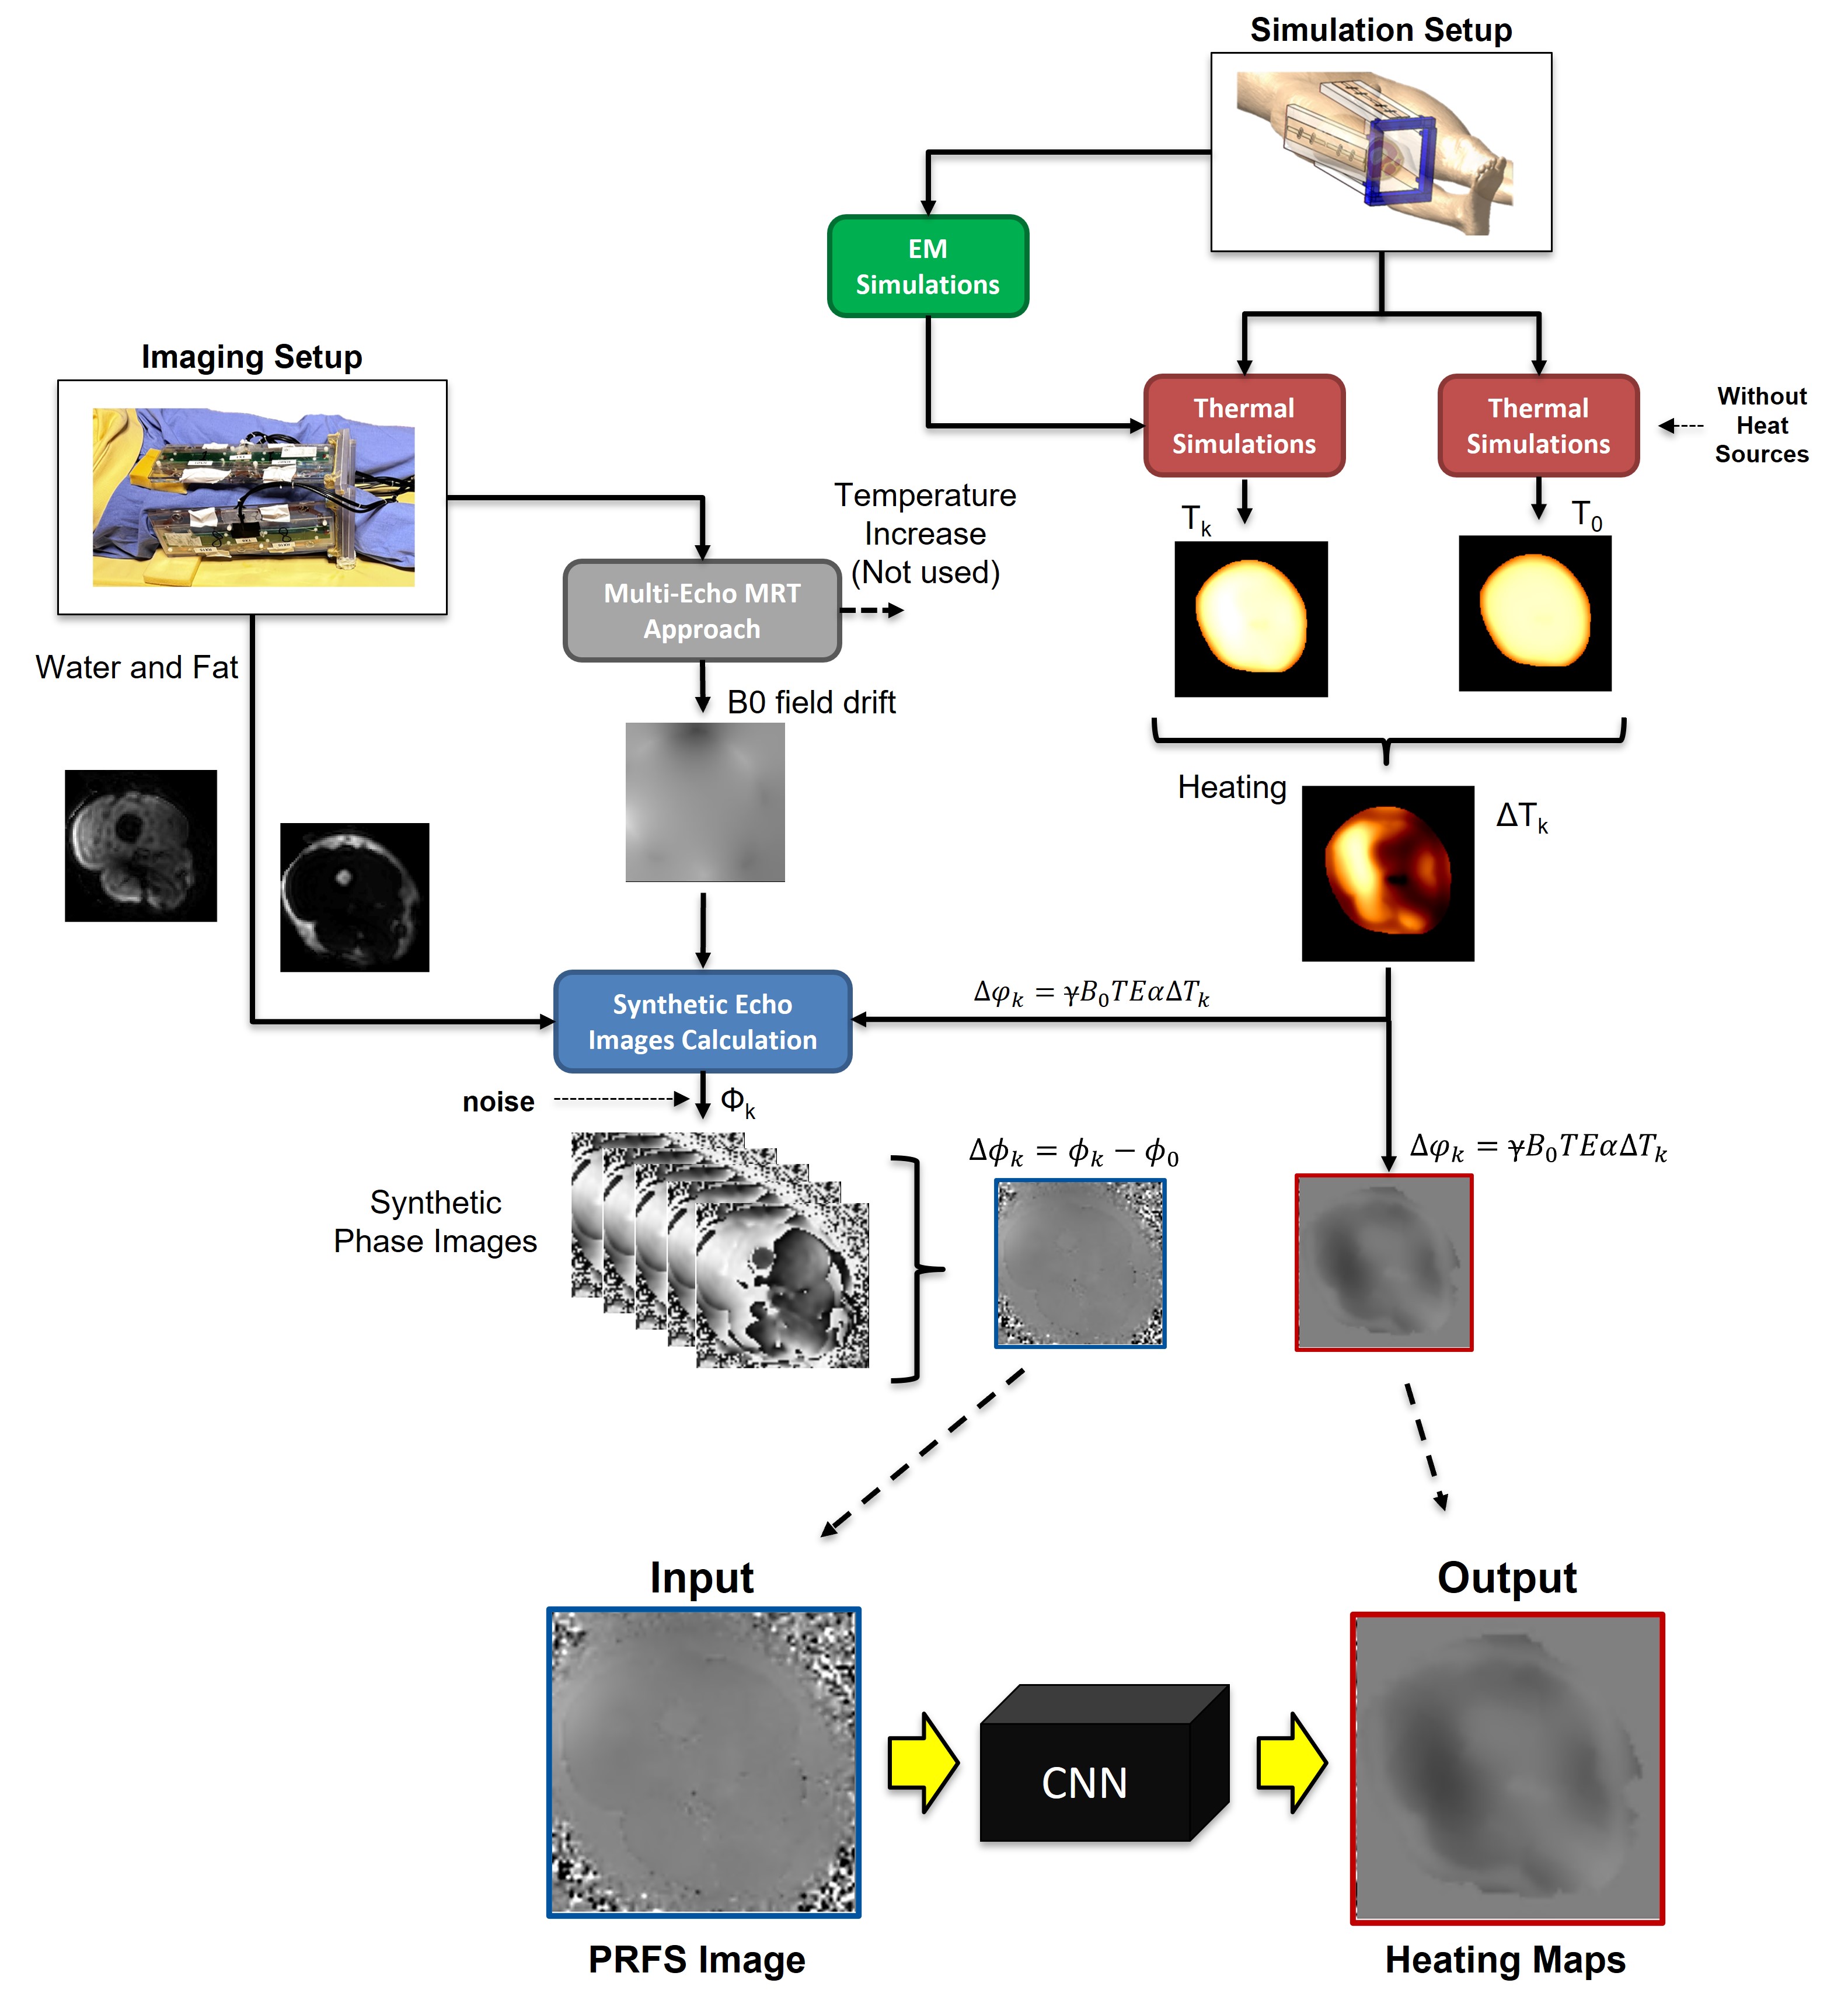
In order to train the CNN, we need paired sets of MRT phase images and corresponding ground-truth temperature distributions. Since particularly ground-truth temperature distributions are hard to obtain, a synthetic PRFS images dataset was built according to the water/fat separated gradient echo equation7,8 which requires Water and Fat images, estimated B0 field drift9 and simulated RF heating map (Figure 1). Then, we added white Gaussian noise to synthesized images (SNR 40dB).Image Acquisition
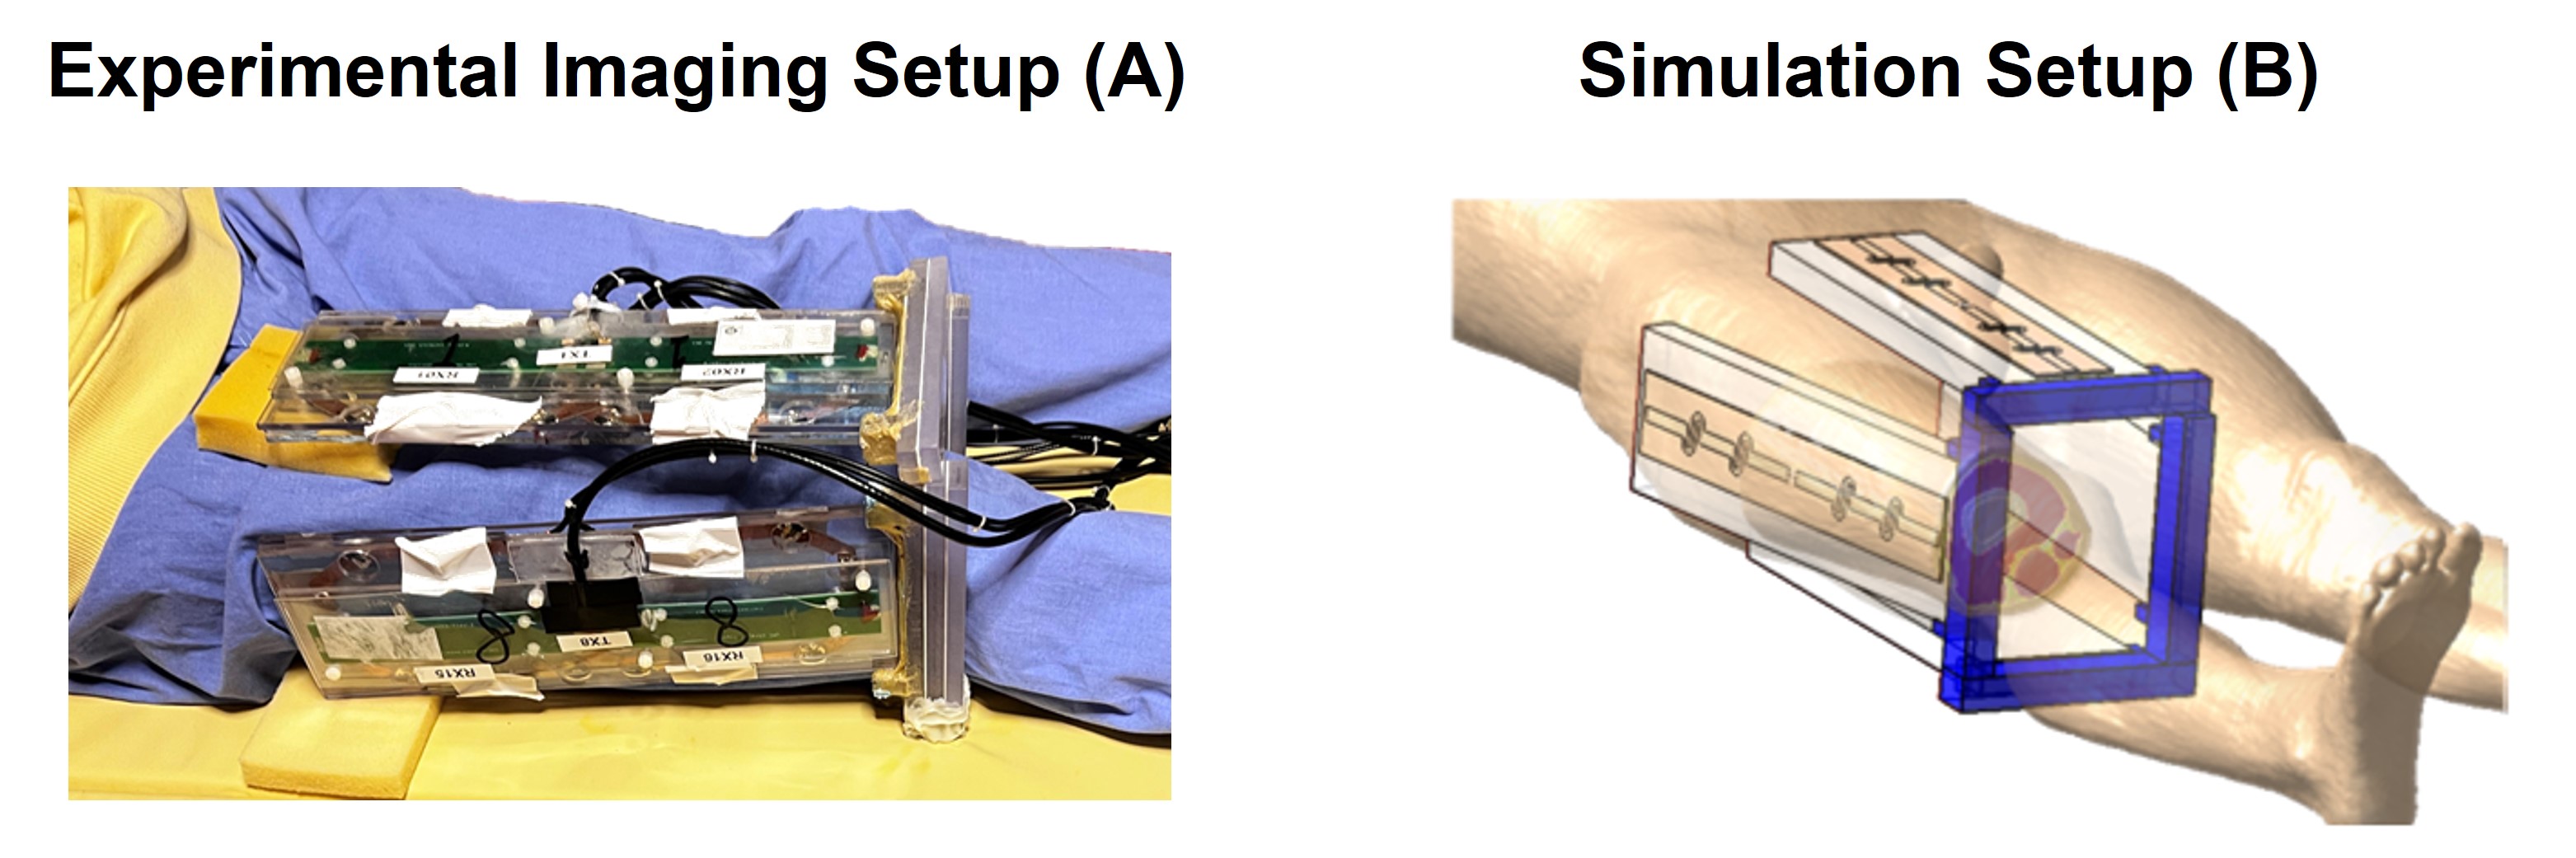
Eighteen sets of thigh images of healthy volunteers (age 22-42, BMI 18.4-24.9) were acquired with 4 fractionated dipole antennas9 (Figure 2A) on a 7T system (Achieva, Philips Healthcare, Best, NL). Water and Fat images and B0 field drift10 were obtained: Spoiled 13-echo gradient echo MRT scans (TE1 13.48 ms, TEspacing 0.66 ms, TR 30 ms, 2.1x2.1x8 mm3 resolution, 170x170x8 mm3 FOV, flip angle 11°, single-shot, cardiac triggered) were acquired for 300 dynamics (296-399 seconds).
EM and Thermal Simulations
Electromagnetic and thermal simulations (Sim4Life, ZMT, Zurich, CH) were performed on the Duke model11. The right thigh was replaced by a patient-specific model (Figure 2B). Power and phase settings were numerically optimized to match measured and simulated |B1+|.
Training and In-Silico Validation
The synthetic dataset was used to train a CNN (Unet)12 to map the relation between the raw PRFS image and heating map (minimizing the mean squared error between true and predicted heating maps).
The built dataset was split in training set and validation set. The CNN was trained with around 20.000 data samples (synthetic PRFS images and simulated heating maps) obtained from 11 thigh image sets with data augmentation (e.g., flip, rescale, stretch, rotate). The synthetic data samples from the remaining thigh image sets were used for in-silico validation.
In-Vivo Validation
A heating scan, constituting a 10 kHz off-resonance block pulse to acquire an average power of 5.3W per channel was performed and a multi-echo MR thermometry approach10 was used for in-vivo validation.
RESULTS AND DISCUSSION
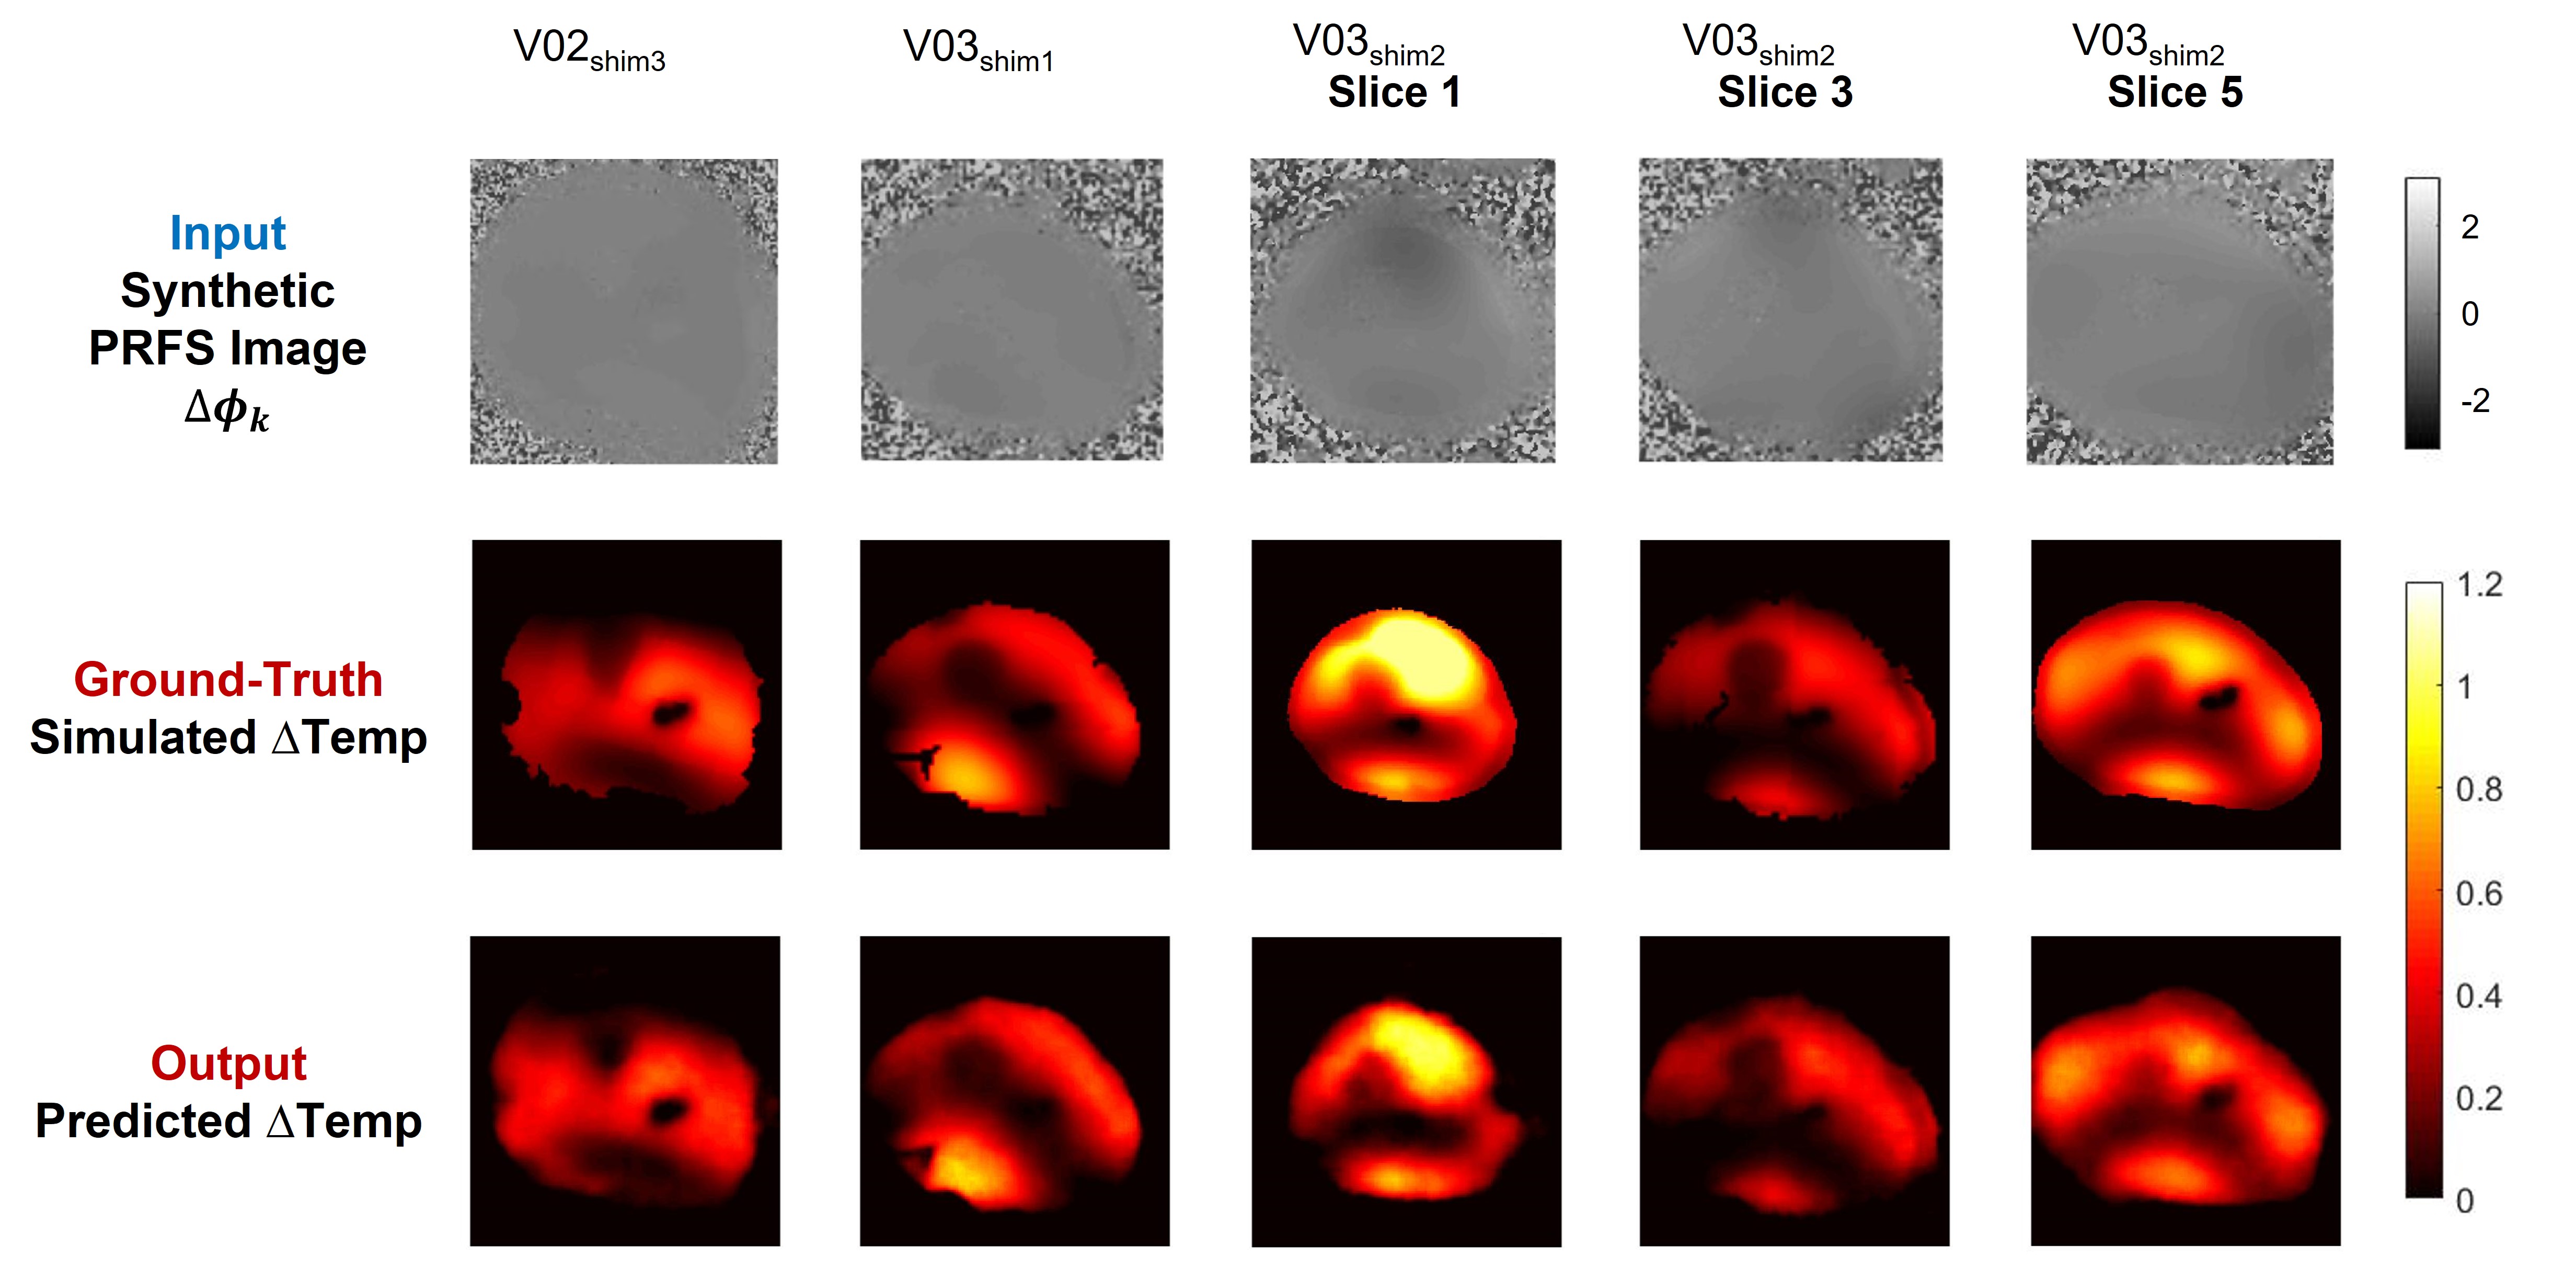
The CNN12 was implemented in TensorFlow and trained for about 20 hours on a GPU (NVIDIA Tesla P100-PCIe-16GB).Figures 3 presents the ground-truth (simulated) heating maps and the predicted heating maps for five in-silico validation tests. All in-silico validation tests show a good qualitative and quantitative match between simulated heating maps and the predicted heating maps by the CNN with the corresponding synthetic PRFS image.
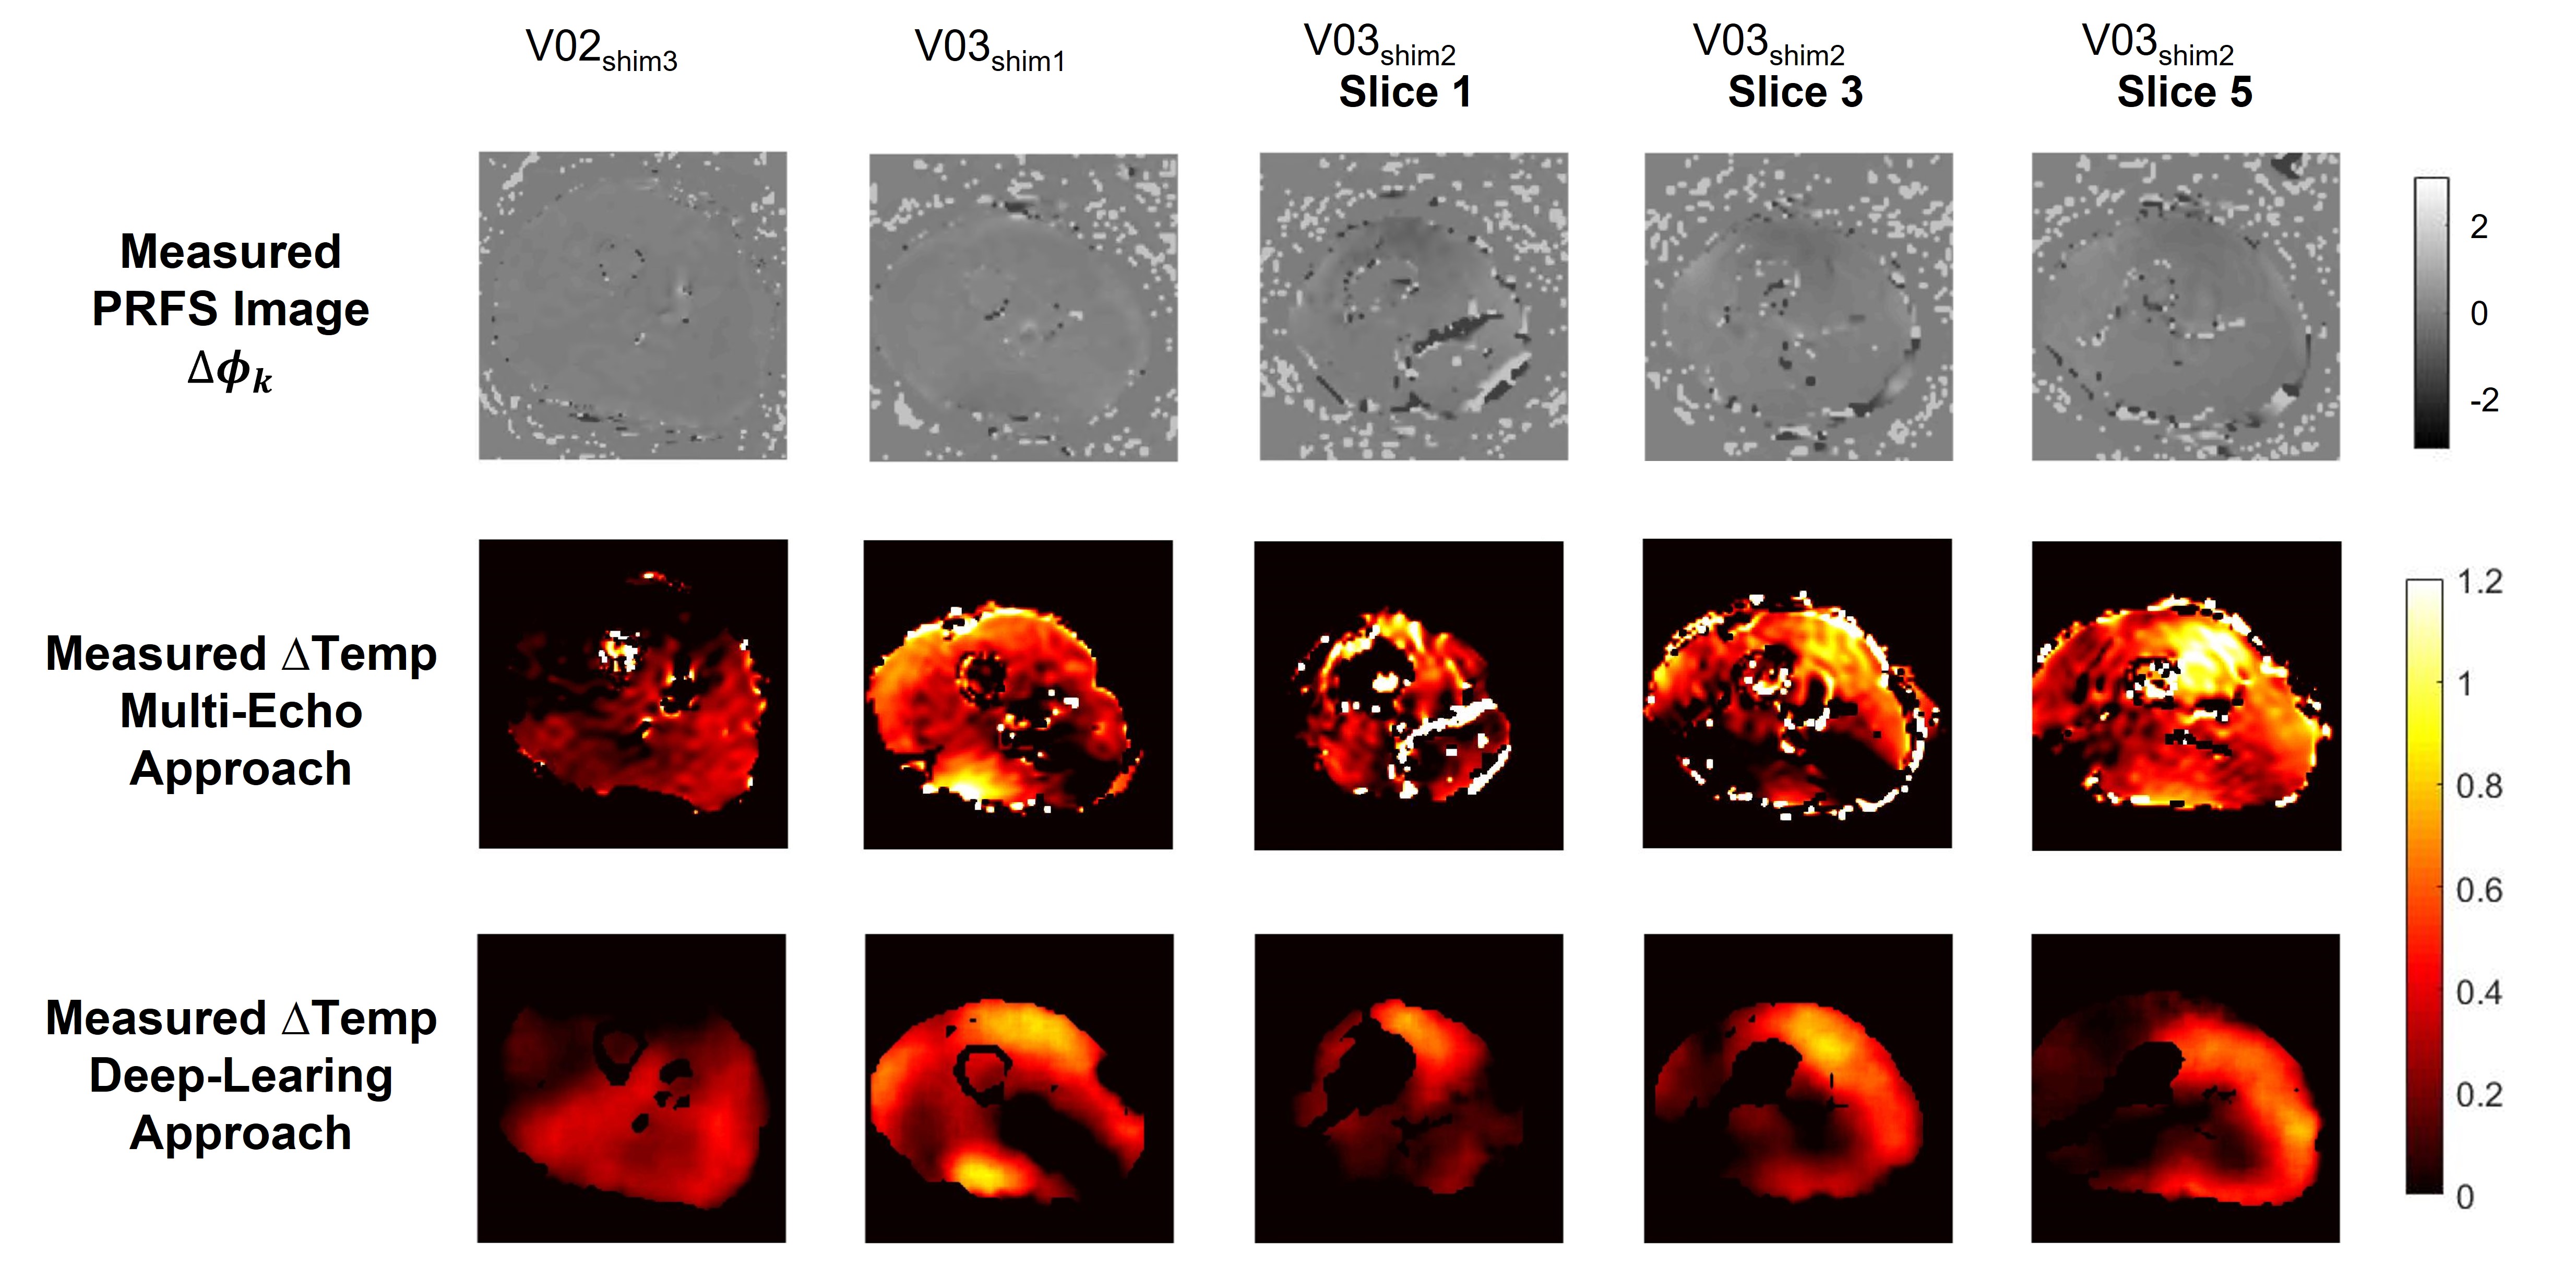
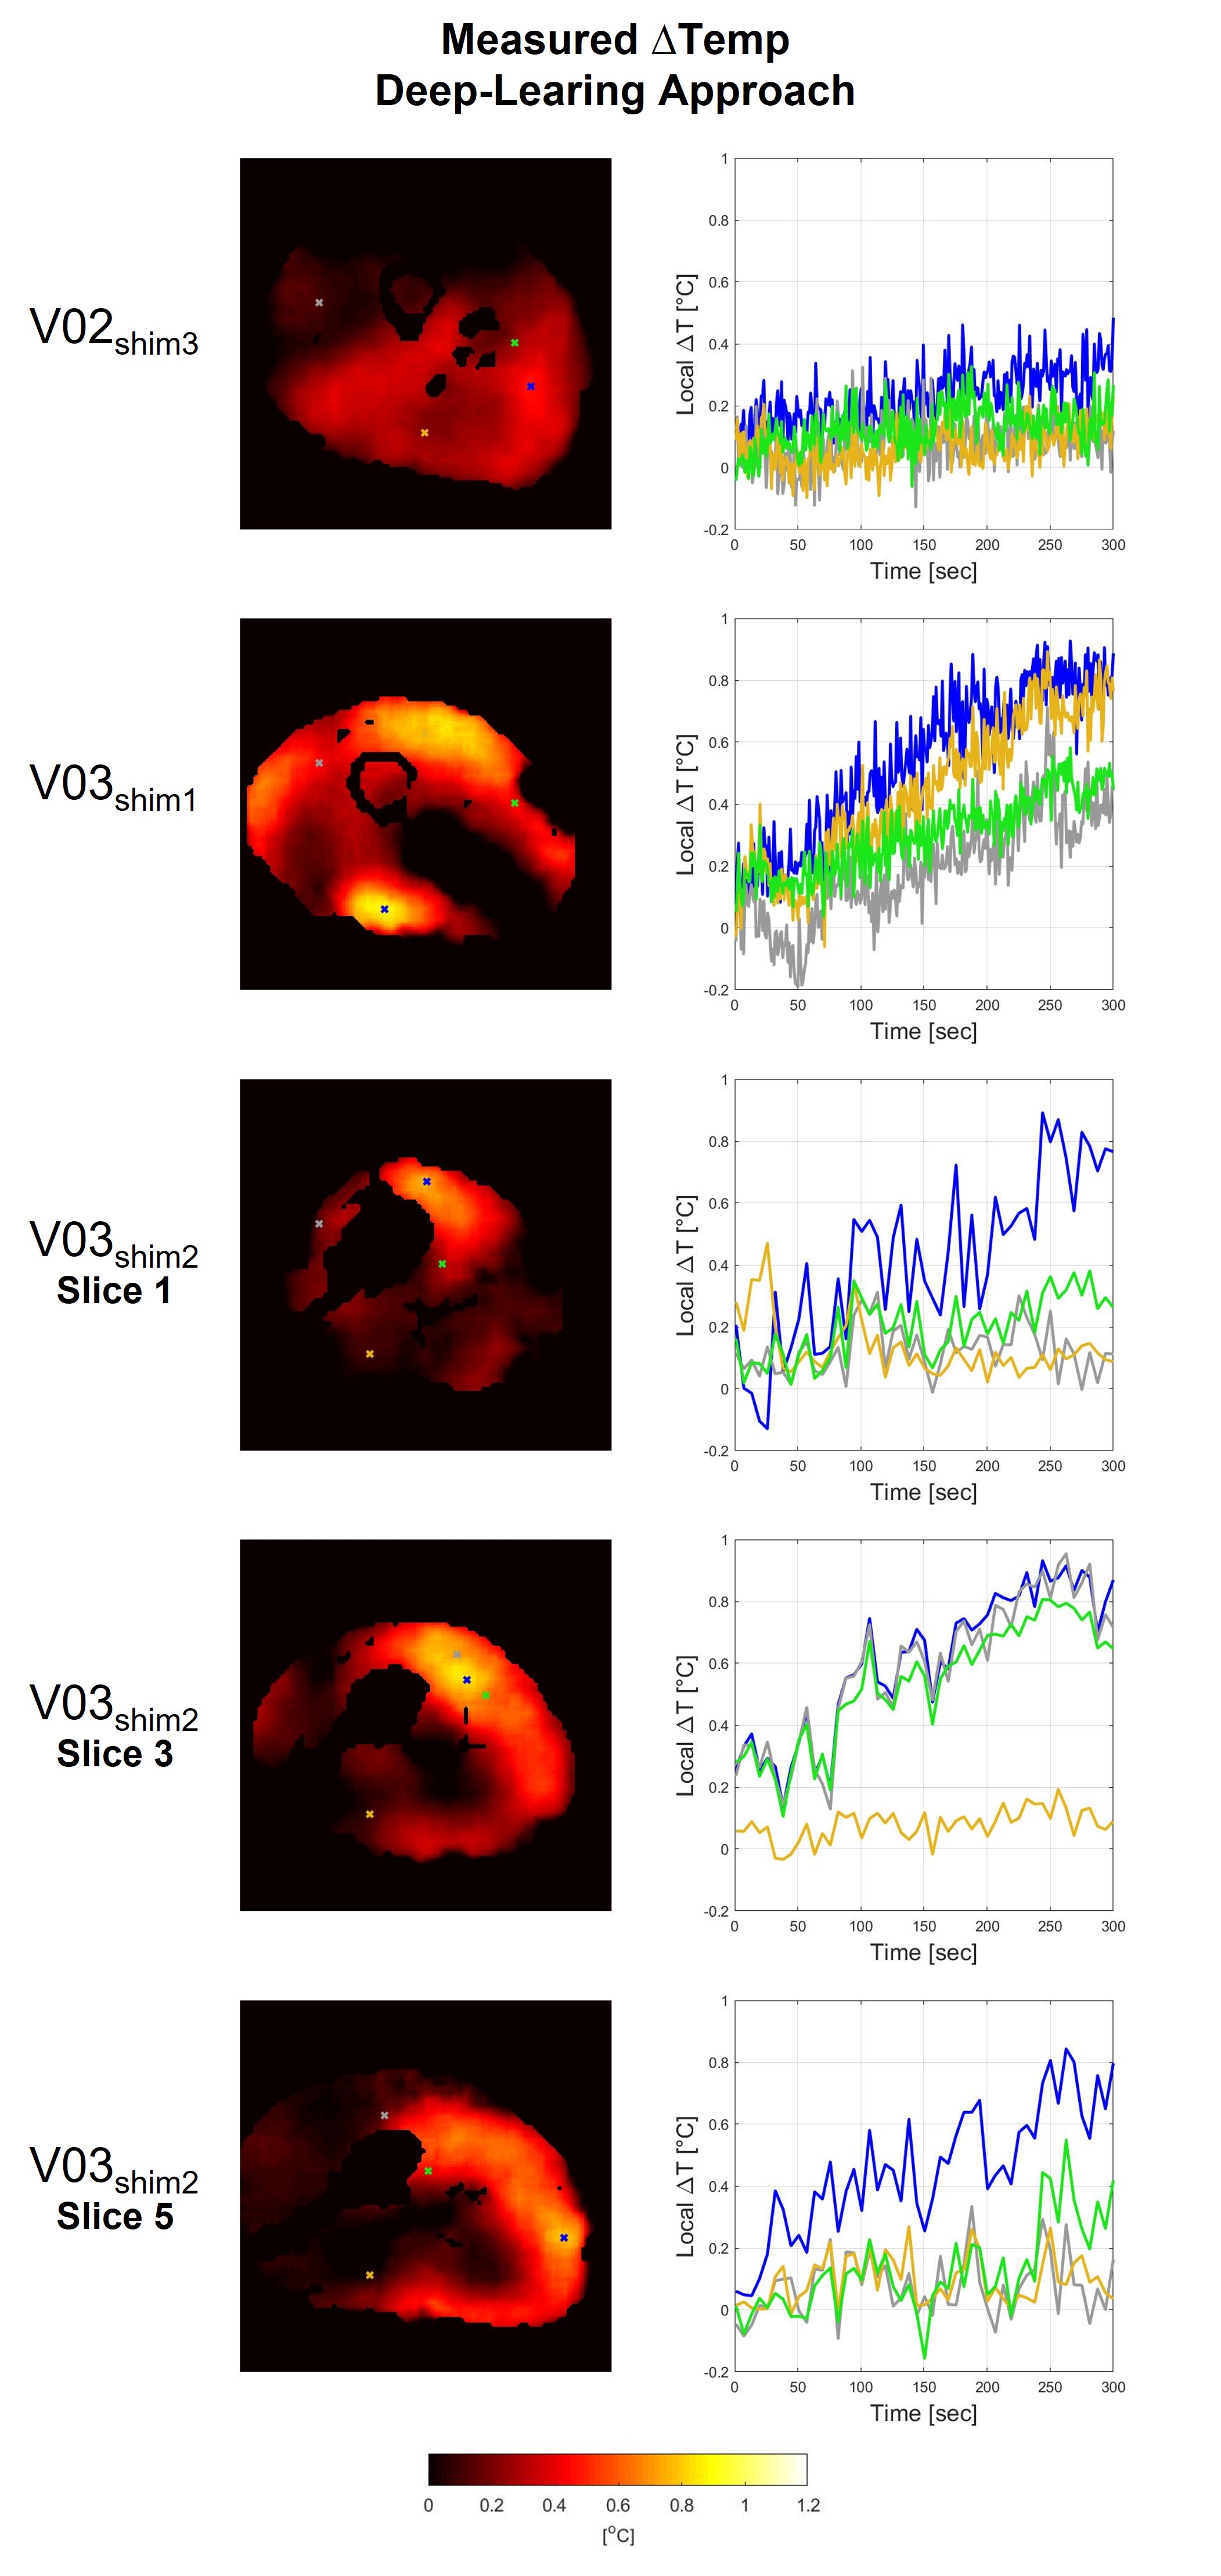
Figure 4 shows the measured heating maps (after the heating scan) using the multi-echo approach and the presented deep-learning approach. For these five in-vivo validation tests, the temperature rise prediction was performed for all subsequent dynamics in the acquisition, which enables the depiction of the temperature rise over time. For visualization, the corresponding time series for four indicated voxel locations are reported in Figure 5.
The in-vivo validation tests also show a very good qualitative and quantitative match between measured heating maps by the multi-echo MR thermometry approach and the predicted heating maps by the CNN using the acquired PRFS images during the heating scan. A physiological increase in temperature is also observed in all in-vivo validation tests (Figure 5). These results confirm the ability of the proposed deep-learning method to recognize the phase shift due to heating and to filter out frequency shift due to B0 field drift.
CONCLUSION
This study demonstrates the capability of the proposed deep-learning approach to separate the PRFS signal from the drift field for MRT in the human thigh at 7T. Both for synthetic data and measured data the trained network is able to correctly predict the temperature distribution based on a gradient echo phase difference image as input. Future work will investigate extending this procedure for other sources of frequency shift (e.g., B0 field drift, breathing, cardiac pulsation, etc.).Acknowledgements
No acknowledgement found.References
1 Hindman JC. Proton resonance shift of water in the gas and liquid states. J Chem Phys. 1966;44:4582-4592.
2 Quesson B, de Zwart JA, Moonen CTW. Magnetic resonance temperature imaging for guidance of thermotherapy. J Magn Reson Imaging. 2000;12:525-533.
3 Simonis, F. F., Petersen, E. T., Lagendijk, J. J., & van den Berg, C. A. (2016). Feasibility of measuring thermoregulation during RF heating of the human calf muscle using MR based methods. Magnetic resonance in medicine, 75(4), 1743-1751.
4 Salomir R, Viallon M, Kickhefel A, et al. Reference-free PRFS MR-thermometry using near-harmonic 2-D reconstruction of the background phase. IEEE Trans Med Imaging. 2012;31:287-301.
5 Le Ster C, Mauconduit F,Mirkes C, Vignaud A, Boulant N. Measuringradiofrequency field- induced temperature variationsin brain MRI exams with motion compensated MRthermometry and field monitoring. Magn Reson Med. 2022;87:1390– 1400. doi:10.1002/mrm.29058.
6 Meliadò EF, Raaijmakers AJE, Sbrizzi A, et al. A deep learning method for image‐based subject‐specific local SAR assessment. Magn Reson Med. 2020;83:695‐711.
7 Grissom, W. A., Rieke, V., Santos, J., Swaminathan, A., Pauly, J., Pauly, K. B., & McConnell, M. (2010). Hybrid referenceless and multi-baseline subtraction thermometry for monitoring thermal therapies in the heart. Journal of Cardiovascular Magnetic Resonance, 12(1), 1-2.
8 Poorman, M. E., Braškutė, I., Bartels, L. W., & Grissom, W. A. (2019). Multi‐echo MR thermometry using iterative separation of baseline water and fat images. Magnetic resonance in medicine, 81(4), 2385-2398.
9 Raaijmakers AJE, Italiaander M, Voogt IJ, Luijten PR, Hoogduin JM, et al. The fractionated dipole antenna: A new antenna for body imaging at 7 Tesla. Magn Reson Med. 2016;75:1366–1374.
10 Kikken MWI, Steensma BR, van den Berg CAT, and Raaijmakers AJE. High-precision MR thermometry of RF heating in the upper thigh at 7T using a multi-echo water-fat separation model. Proceedings of the ISMRM 31st Annual Meeting, London, 07-15 May 2022.
11 Christ A, Kainz W, Hahn EG, et al. The Virtual Family—development of surface‐based anatomical models of two adults and two children for dosimetric simulations. Phys Med Biol. 2010;55:N23–N38.
12 O. Ronneberger, P. Fischer, T. Brox, U-Net: Convolutional Networks for Biomedical Image Segmentation, Medical Image Computing and Computer-Assisted Intervention – MICCAI 2015 pp 234-241.
Figures