4988
A dual-flip angle bSSFP imaging method for proton resonance frequency-based thermometry1Korea Institute of Science and Technology, Seoul, Korea, Republic of, 2Korea Advanced Institute of Science and Technology, Daejeon, Korea, Republic of
Synopsis
Keywords: Thermometry, Thermometry
Proton resonance frequency thermometry estimates temperature change by detecting the frequency change which is proportional to that of the temperature. In this study, we propose a dual- flip angle bSSFP thermometry method that generates a high intensity signal and linear phase to the frequency shift. Two steady states of the proposed method have phase dependency on the off-resonance frequency and the phase difference between the steady states has a linear relation with the off-resonance frequency. The linear phase relation makes it possible to measure temperature change. And the acquired high intensity signal benefits temperature monitoring and guidance for thermal therapy.INTRODUCTION
Magnetic resonance (MR) thermometry is a promising technique for monitoring and guiding thermal therapy that is a relatively less invasive medical treatment. MR thermometry estimates temperature change by measuring temperature sensitive MR parameters. The proton resonance frequency (PRF)-based thermometry is one of the preferred methods that estimates temperature change from the resonance frequency change.1-3A balanced SSFP (bSSFP) sequence is advantageous in terms of signal-to-noise ratio (SNR) and fast imaging time. However, the nonlinear phase response to the frequency shift is obstacles to be overcome. In this study, we propose a dual-flip angle bSSFP (dFA-bSSFP) method that generates a high intensity signal and linear phase to the frequency shift.
METHODS
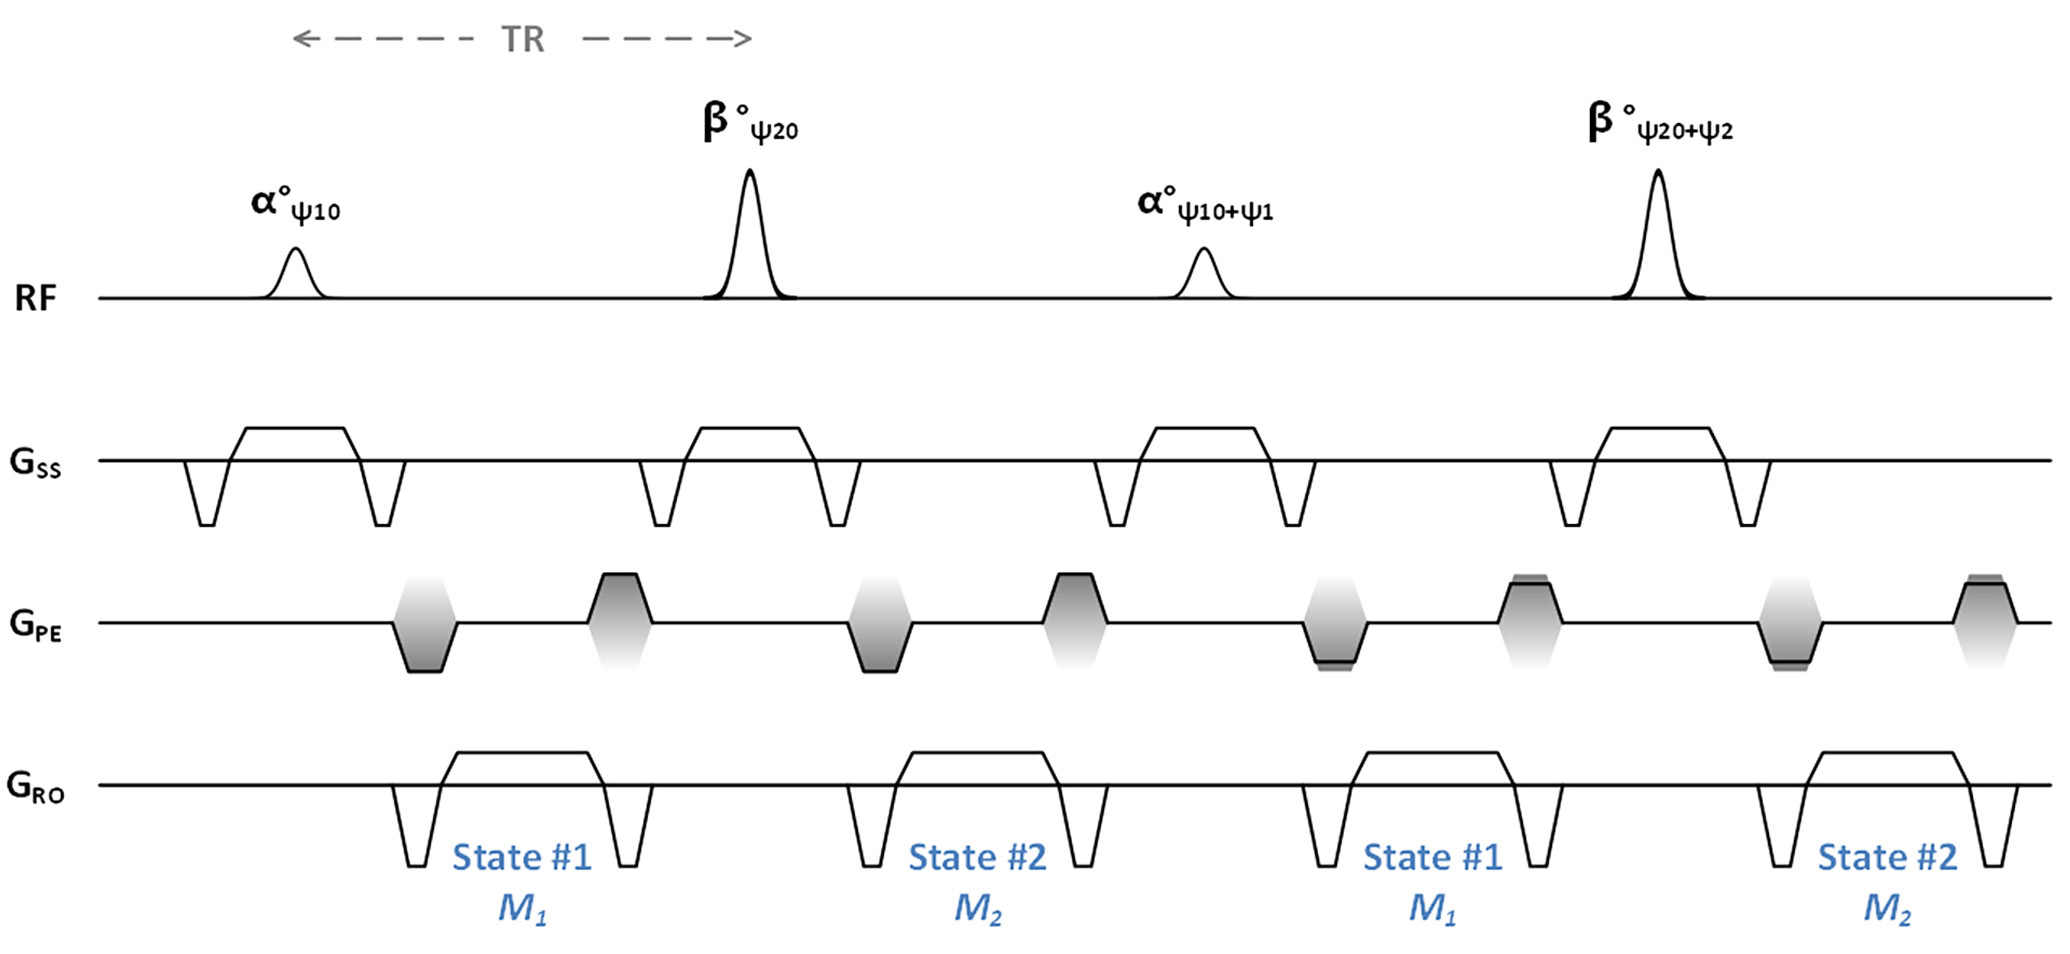
In the bSSFP sequence, the signal acquired at TE=TR/2 does not have a linear relation between the phase of the transverse magnetization and the off-resonance frequency. However, dFA-bSSFP produces an off-resonance frequency-dependent phase and the two steady states have different phase profiles.4With the assumption $$$E_1\approx1$$$, $$$E_2\approx1$$$, the dFA-bSSFP signals with 180° phase cycling are approximately represented as follows:
$$M_{1,xy}\propto\sin\alpha\cdot\left(1+\cos\beta\right)\cdot\exp\left(-i\theta\right)-\left(1+\cos\alpha\right)\cdot\sin\beta$$
$$M_{2,xy}\propto\left(1+\cos\alpha\right)\cdot\sin\beta\cdot\exp\left(-i\theta\right)+\sin\alpha\cdot\left(1+\cos\beta\right)$$
where $$$\theta$$$ is the phase evolution per TR, i.e., $$$\theta=\Delta f\times TR$$$ when $$$\Delta f$$$ is the off-resonance frequency and $$$M_{1,xy}$$$, $$$M_{2,xy}$$$ are transverse components of the steady states generated after RF pulses with flip angle $$$\alpha$$$ and $$$\beta$$$, respectively. The phase difference between the two steady states is formulated as follows:
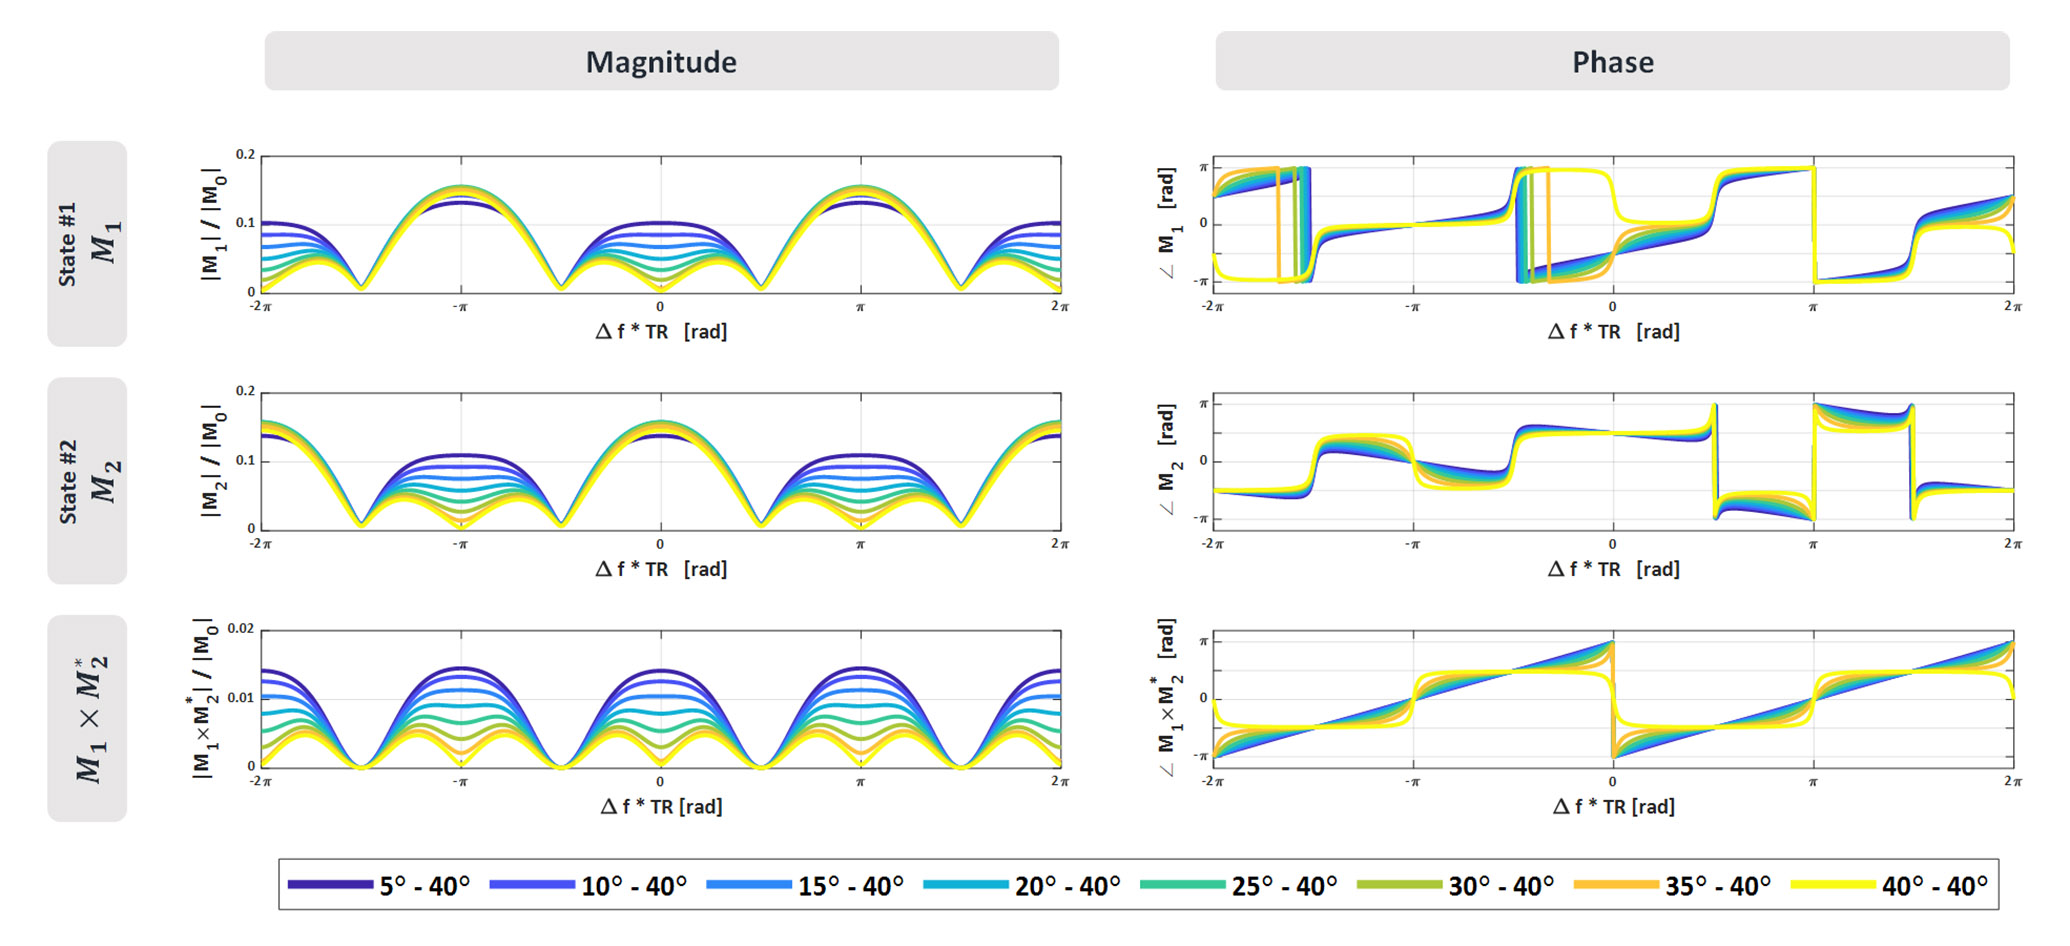
$$\angle M_{1,xy}\times M_{2,xy}^{*}=\angle\left\{\sin^{2}\alpha\cdot\left(1+\cos\beta\right)^{2}\cdot\exp\left(-i\theta\right)-\left(1+\cos\alpha\right)^{2}\cdot\sin^{2}\beta\cdot\exp\left(i\theta\right)\right\}$$
When $$$\alpha\ll\beta<90^{\circ}$$$, the phase difference is represented as a linear function of $$$\Delta f$$$ as follows:
$$since~~~\sin^{2}\alpha\cdot\left(1+\cos\beta\right)^{2}\ll\left(1+\cos\alpha\right)^{2}\cdot\sin^{2}\beta ~,$$
$$\angle M_{1,xy}\times M_{2,xy}^{*}=\angle-\left(1+\cos\alpha\right)^{2}\cdot\sin^{2}\beta\cdot\exp\left(i\theta\right)=\theta=\Delta f \times TR$$
Figure 2 shows the magnitude and phase profile of the two steady states, $$$M_{1,xy}$$$ and $$$M_{2,xy}$$$, and $$$M_{1,xy}\times M_{2,xy}^{*}$$$. It can be seen that the phase difference between the two steady states has a linear relationship with the off-resonance frequency, as the difference between the two flip angles, $$$\alpha$$$ and $$$\beta$$$, increases. This linear phase behavior makes it possible to measure the proton resonance frequency shift caused by temperature change.
RESULTS
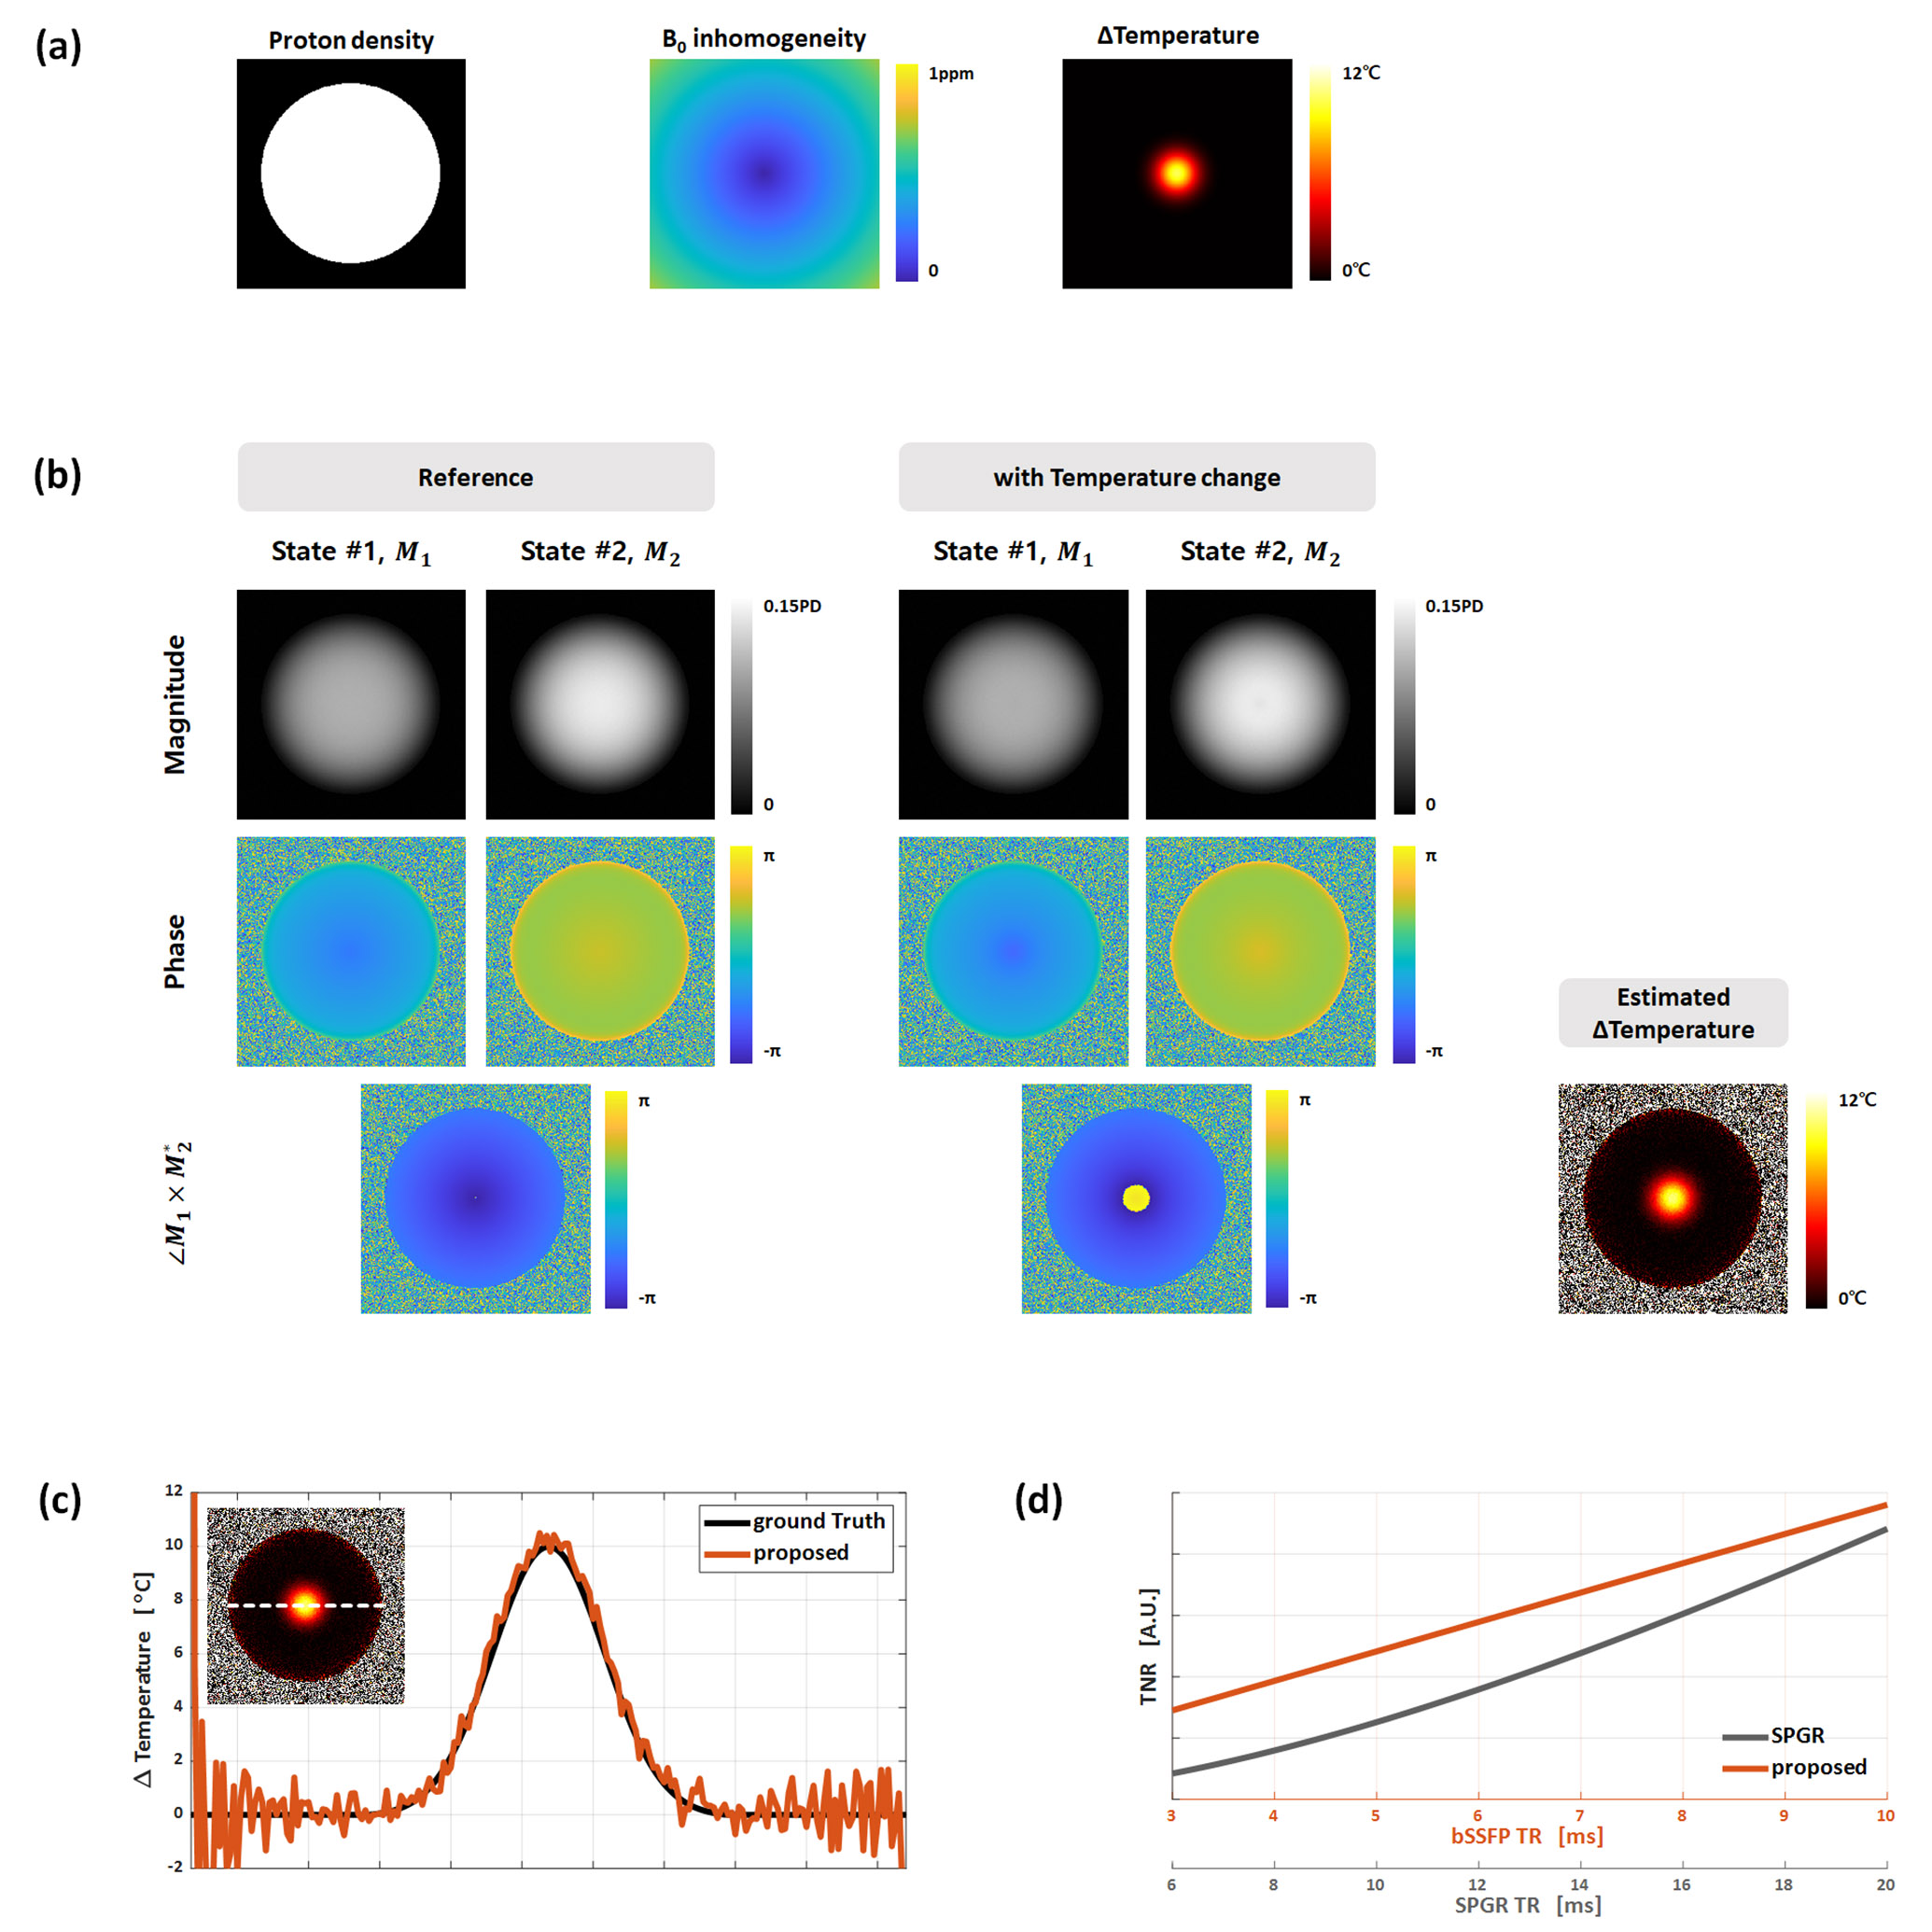
SimulationA homogeneous numerical phantom is generated to verify the proposed MR thermometry method. It is assumed that a point heat is applied to the center of the object. The temperature change is given as a Gaussian distribution in the spatial domain following the bioheat equation5 that explains heat dissipation. In addition, field inhomogeneity and noise are introduced as shown in Figure 3(a). The computer simulation shows that the proposed temperature estimation technique with dFA-bSSFP effectively captures the frequency change caused by temperature change. And the temperature-to-noise (TNR) ratio considering the phase accumulation and SNR of the acquired signal is calculated for the proposed method and the conventional spoiled gradient echo (SPGR). For a fair comparison, the TR of SPGR is set to twice that of dFA-bSSFP in order to have the same total acquisition time. The TE of the SPGR is assumed to be 2ms smaller than SPGR TR. As shown in Figure 3(d), The proposed method provides better TNR under short TR condition which is generally used for the bSSFP acquisition.
MRI experiment
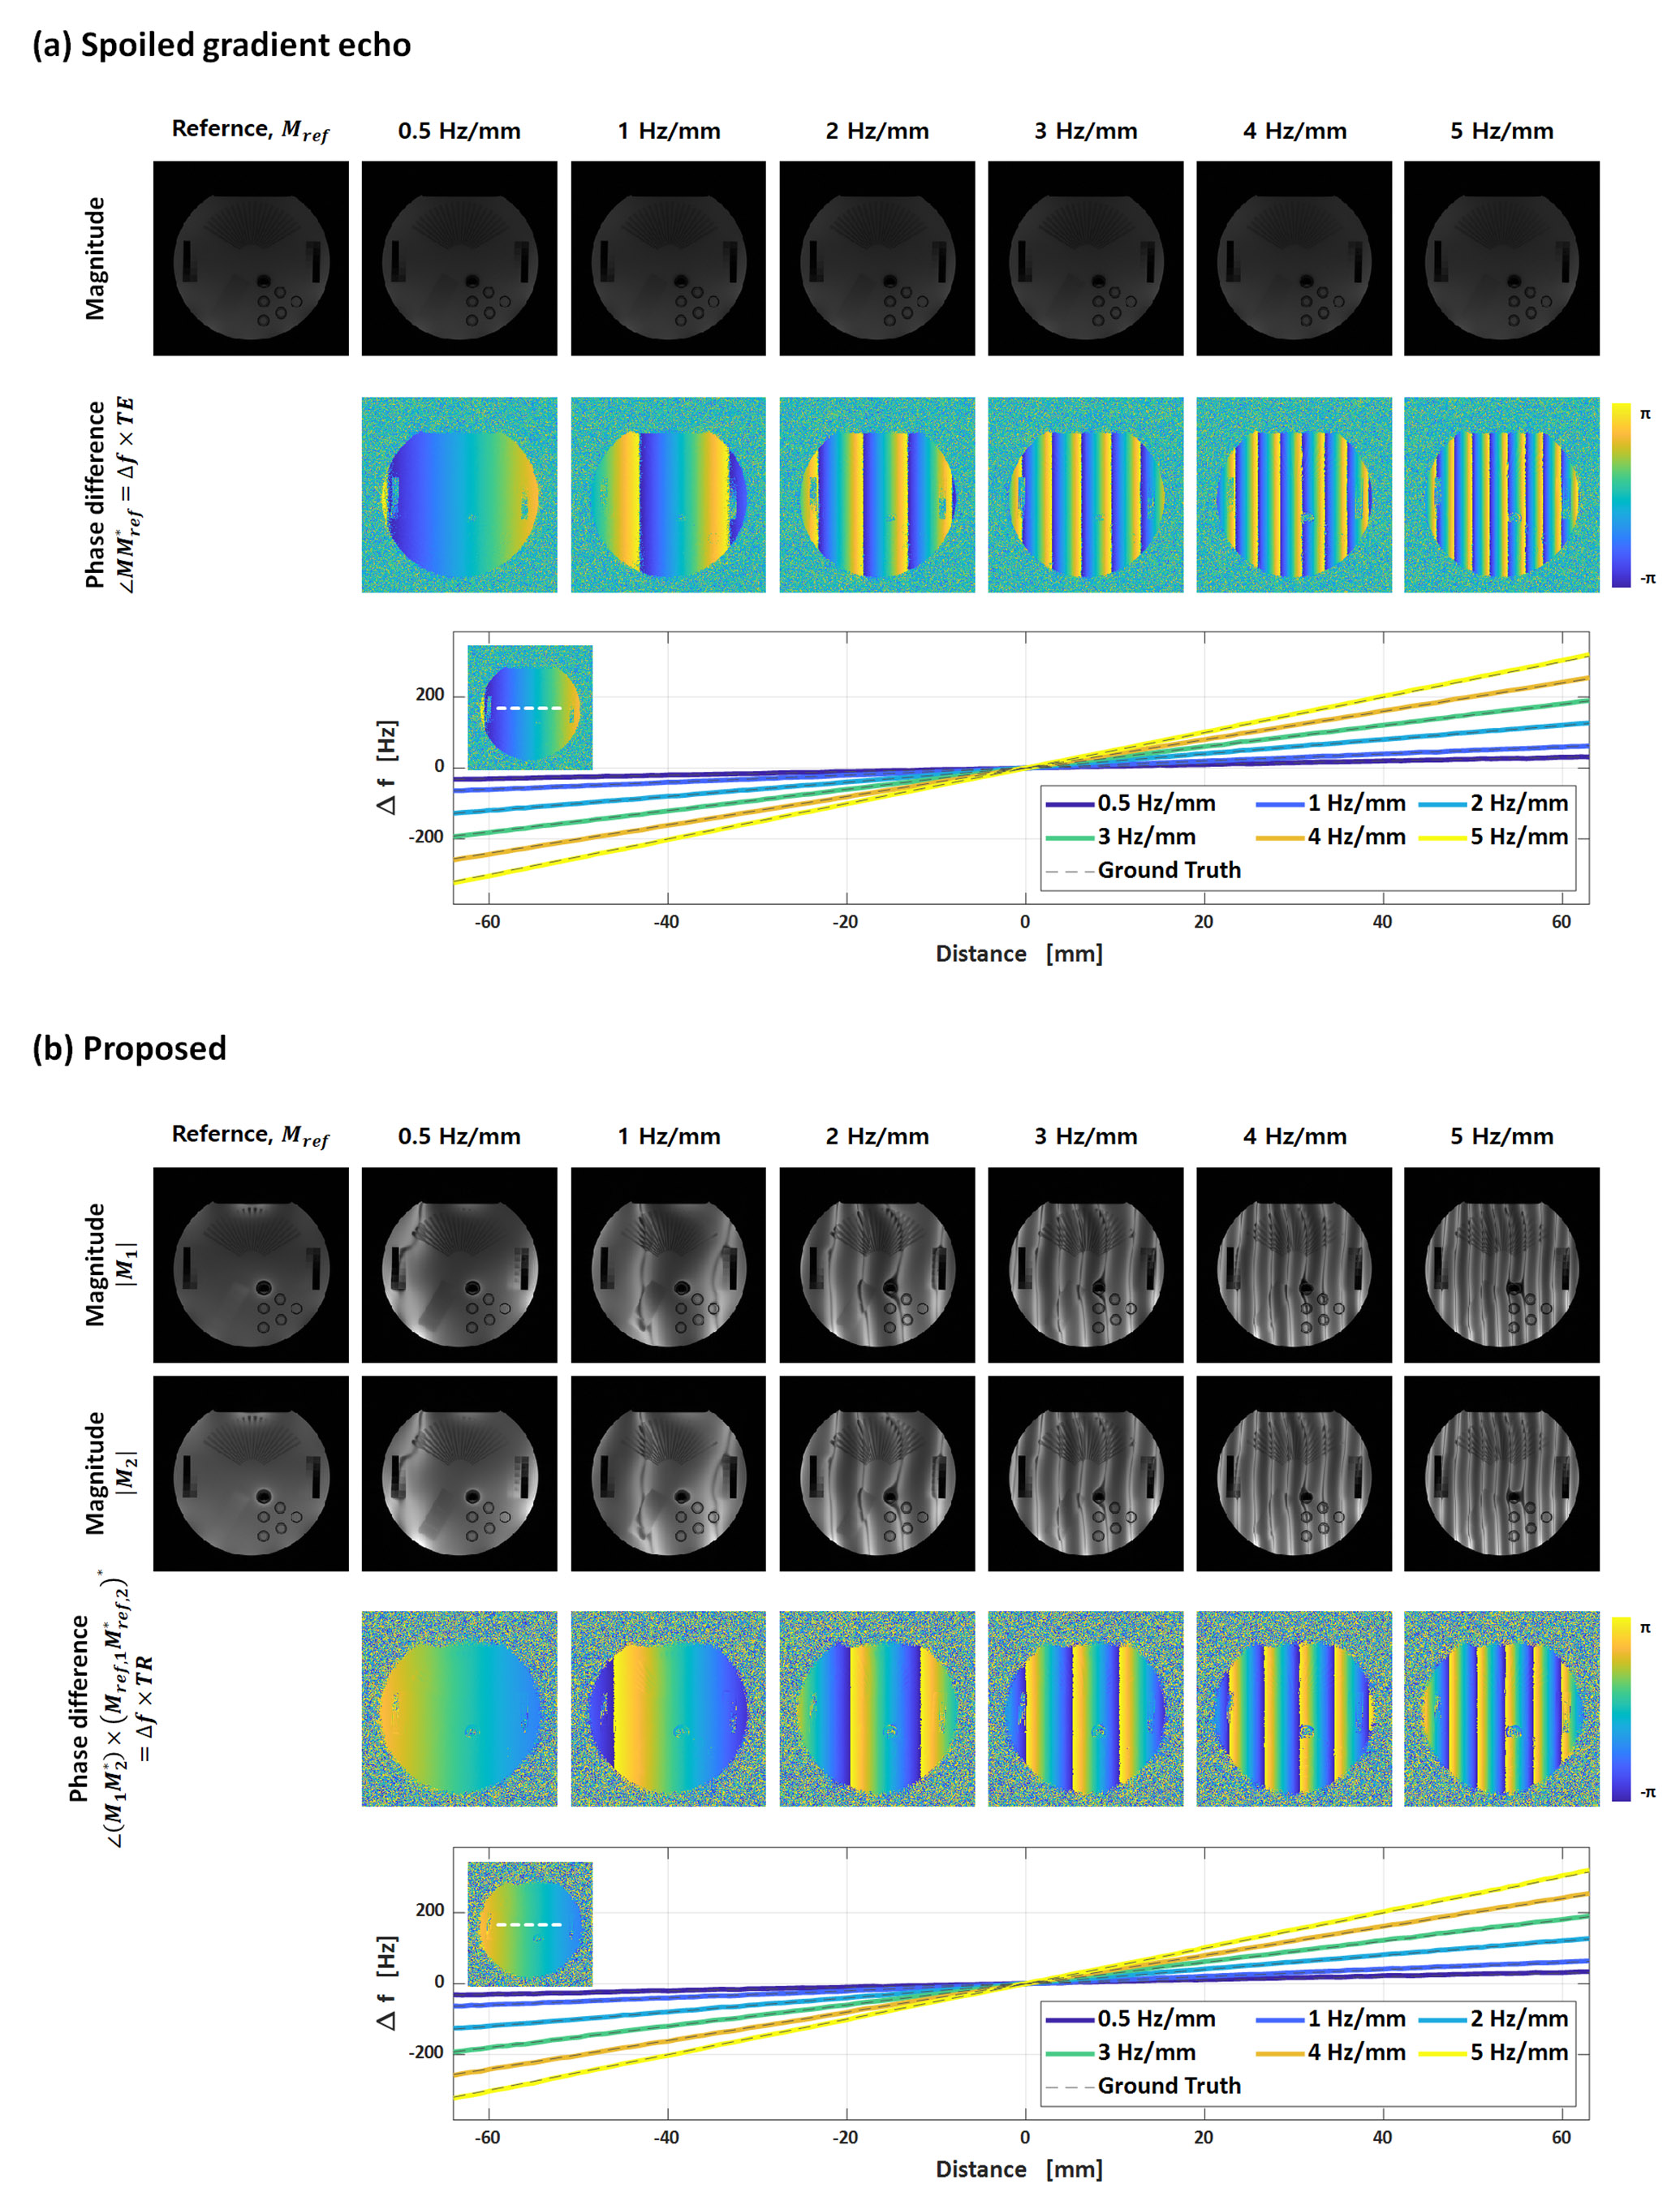
MRI experiments on a phantom was performed on 3T MRI scanner (Siemens Magnetom Verio). For the proposed dFA-bSSFP, flip angle [α,β]=[5°,40°], phase cycling angle [ψ1, ψ1]=[180°, 180°], TR=5.4ms, and TE=2.7ms are used. For the conventional SPGR method, flip angle of 15°, TR=11ms, and TE=8.5ms are used. The frequency shift from temperature change was substituted by a change in local field strength for experimental convenience. The spatial gradient field was applied to generate the local field change, which was a linear field along the horizontal direction in the acquired images. After one baseline image was acquired, six images were obtained with spatial field variations from 0.5Hz/pixel to 5Hz/pixel. The phantom experiments with a spatial gradient field are shown in Figure 4. The estimated frequency shift using the proposed is coincident with the applied gradient field. When it comes to the signal intensity, the acquired signal with the proposed method outperforms that with conventional SPGR as shown in Figure 3. The high SNR signal benefits guidance for thermal therapy as well as temperature monitoring.
DISCUSSION
We proposed the dFA-bSSFP for thermometry based on PRF imaging. Two steady states generated by the proposed dFA-bSSFP have phase dependency on the off-resonance frequency and the phase difference between the steady states has a linear relation with the off-resonance frequency. Therefore, the temperature change could be measured from the phase information of the proposed dFA-bSSFP that is linearly proportional to the frequency shift. And the acquired high intensity signal benefits temperature monitoring and guidance for thermal therapy.Acknowledgements
This work was supported by KIST Institutional Program (Grant 2E31602, Grant 2E31613, and Grant 2E31571).References
1. Hindman J. Proton Resonance Shift of Water in the Gas and Liquid States. J Chem Phys. 1966;44(12):4582-4592.
2. Némethy G, Scheraga H. Structure of Water and Hydrophobic Bonding in Proteins. I. A Model for the Thermodynamic Properties of Liquid Water. J Chem Phys. 1962;36(12):3382-3400.
3. McDannold N. Quantitative MRI-based temperature mapping based on the proton resonant frequency shift: Review of validation studies. International Journal of Hyperthermia. 2005;21(6):533-546.
4. Kim J, Seo H, So S et al. A multicontrast imaging method using steady‐state free precession with alternating RF flip angles. Magnetic resonance in medicine. 2018; 80.4: 1341-1351.
5. Pennes H. Analysis of Tissue and Arterial Blood Temperatures in the Resting Human Forearm. J Appl Physiol. 1998;85(1):5-34.
Figures