4983
Ultrahigh Field CMR for the Assessment of Cardiac Function – Scan Rescan Reproducibility and Shim Limitations1Chair of Molecular and Cellular Imaging, Comprehensive Heart Failure Center (CHFC), University Hospital Würzburg, Würzburg, Germany, 2Department of Nuclear Medicine, University Hospital Würzburg, Würzburg, Germany
Synopsis
Keywords: Myocardium, High-Field MRI
In this study we aim to analyze blood tissue contrast (BTC), SNR, and reproducibility in measurements of cardiac function at 7T. Furthermore, we assess shim quality and its impact on image quality as well as T2*. Measurements are performed in n=7 healthy volunteers using a 7T system. Diastolic BTC and SNR in scan1 and scan2 were 2.14±0.24 and 2.22±0.33 as well as 96±35 and 105±29, respectively. Reproducibility assessed via intra class correlation coefficient was found to be excellent for ejection fraction (0.93), myocardial mass (0.99), stroke volume (0.91), end-systolic volume (0.94), and end-diastolic volume (0.93).Itroduction
Cardiac magnetic resonance (CMR) imaging at 1.5 and 3T is an established technique and the gold standard for the assessment of cardiac function and ventricular mass in clinical routine1. While CMR studies in humans at 7T have shown general feasibility of cardiac function2-6 and increased SNR7, it has not been demonstrated that these metrics can be consistently derived with reasonable accuracy. In this study we thus aim to analyze blood tissue contrast (BTC), SNR, and reproducibility in measurements of cardiac function at 7T. Furthermore, we assess shim quality and its impact on image quality as well as T2*.Methods
All experiments were approved by the local ethics committee and written informed consent was given by each volunteer prior to MRI measurements. Data was acquired in n=7 volunteers (n=6 female) with body weight: 51-91kg and height: 161-185cm.All MRI measurements are performed using a 7T MAGNETOM™ Terra system (Siemens Healthineers, Erlangen) and a novel cardiac transceiver array (Rapid Biomedical, Rimpar)8 comprising an anterior and a posterior component. The array was used in pTX mode with phase and amplitude settings as provided by the vendor.
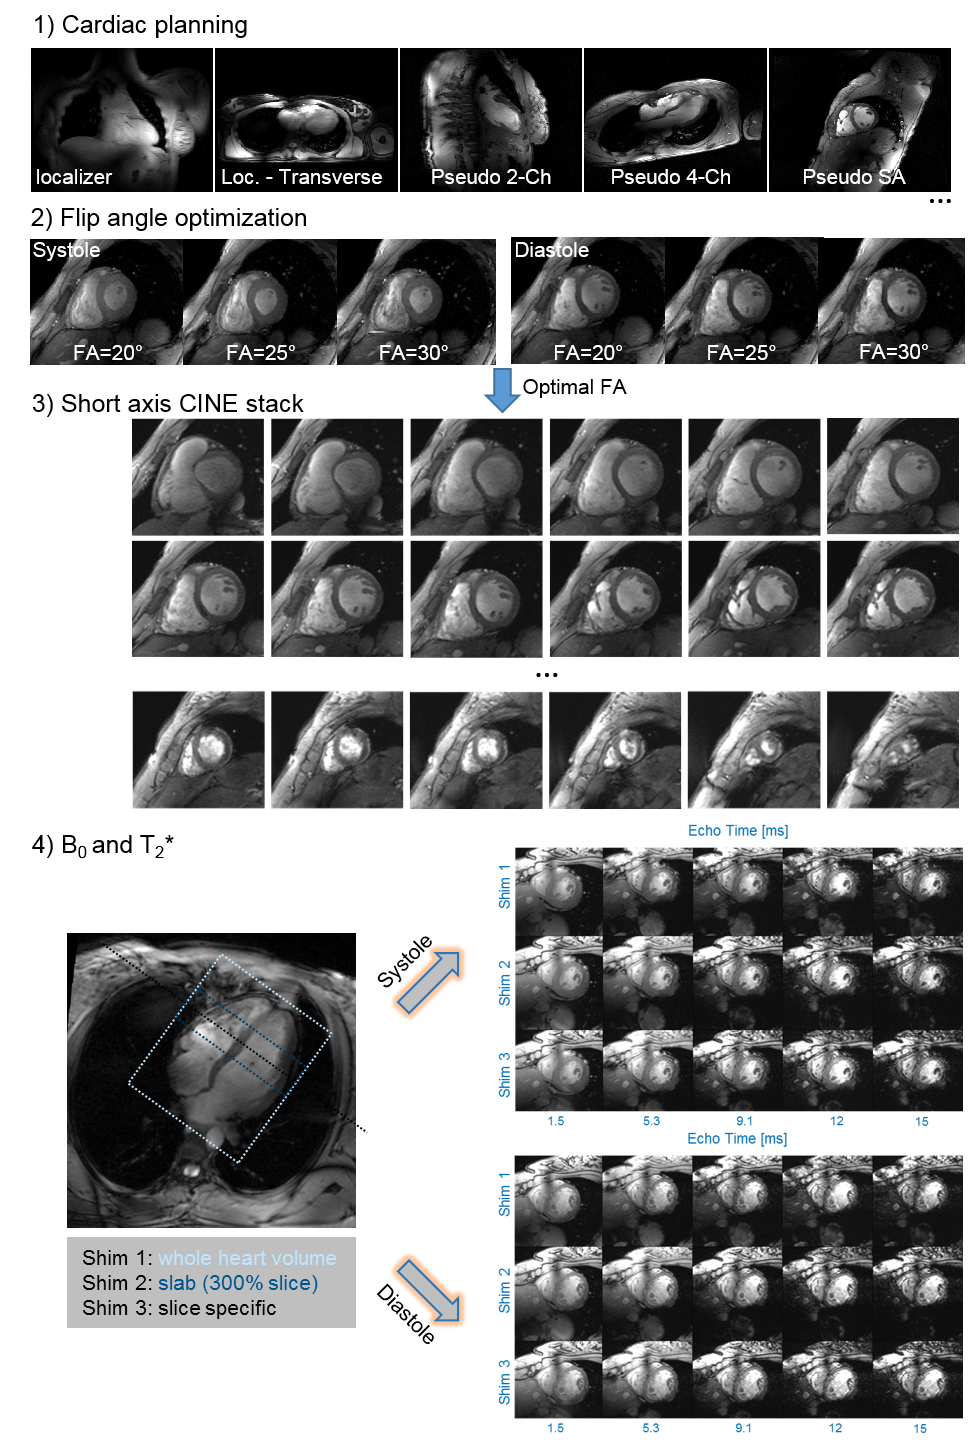
The MRI protocol is illustrated in Figure 1. After completion of the measurement protocol, the patient table was moved to home position, the anterior array removed and volunteers were asked to leave the patient table for a duration of ~5 minutes. Afterwards, volunteers were asked to lay down on the patient table again and all hardware was reconnected. Steps 1-3 of the MRI protocol were performed again (due to time constraints B0/T2* was acquired in only n=6 volunteers (n=5 female).
Sequence parameters for cine acquisition were: TE/TR: 0.7/~45ms, echo-spacing: 7ms, bandwidth: 915Hz/Px, FOV: 400x378mm2, interpolated in-plane resolution: 0.7x0.7mm2, 30 cardiac phases. Sequence parameters for the multi-echo gradient echo sequence were TE: [1.5, …, 15]ms, TR: 328ms, FA: 40°, bandwidth: 1955Hz/Px, FOV: 360x300 mm2, interpolated in-plane resolution: 0.7x0.7 mm2.
Cardiac function for scan1 and scan2 were evaluated three days apart by the same observer using Medis Suite MR (Medis, Leiden). SNR9 and blood tissue contrast based on respective Medis contours as well as data analysis with respect to B0 (ROMEO10 software) and T2* was done using Matlab (Mathworks, Natick).
Results
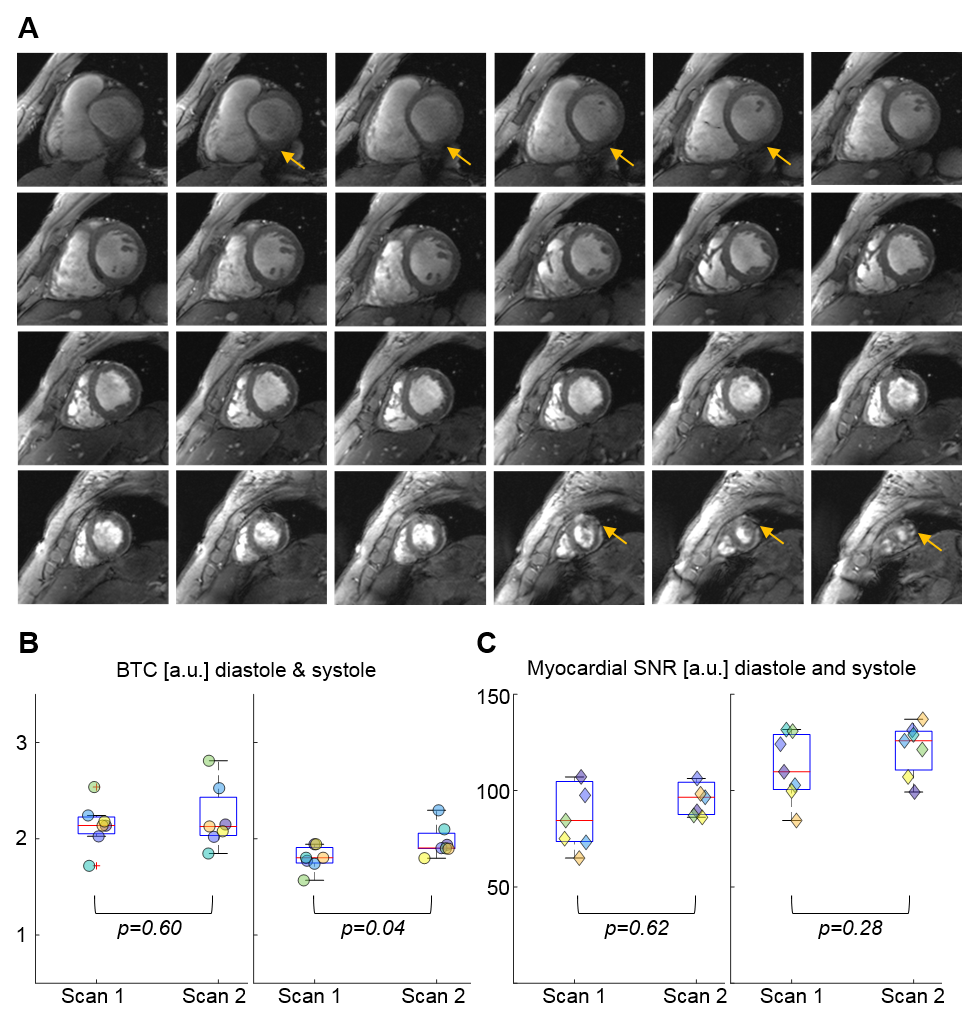
The average flip angle selected as optimal for subsequent CINE scans was 21±3°. Short axis cine data as depicted in Figure 1 & Figure 2A showed good BTC. The observed increase in blood pool signal from base to apex was present in all scans.Average BTC values of the LV for scan1 and scan2 are listed in Table 1 and individual values for all scans are plotted in Figure 2B. Overall BTC was consistent between scans. While there was a statistically significant difference in systolic BTC between scan1 and scan2, the mean difference was only 0.22. Myocardial SNR is plotted in Figure 2C. No significant differences were found between scan1 and scan2.
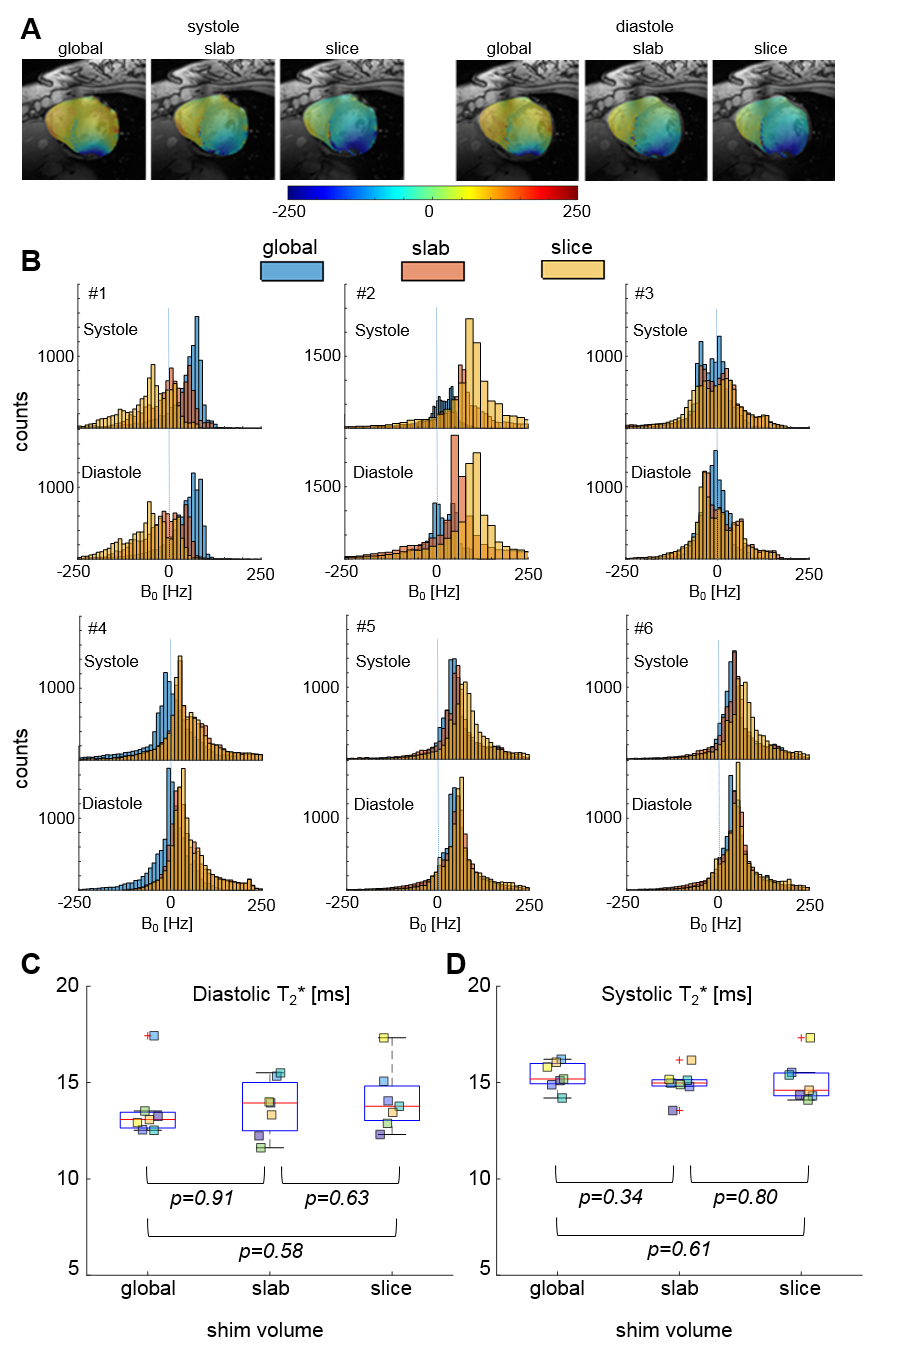
Figure 3A shows representative B0 maps of a single volunteer for the three different shim volumes applied. Shimming based on a slab volume appears to reduce peak B0 values, improving B0 homogeneity in the left ventricle. Similar observations were made for the slice volume, but less consistently. The different shim volumes had no significant impact on mean T2* values (Figure 3B-C). However, with p=1.5*10-3 (paired t-test), overall T2* was found to be significantly lower in diastole (13.8±1.55ms) than in systole (15.1±0.9ms).
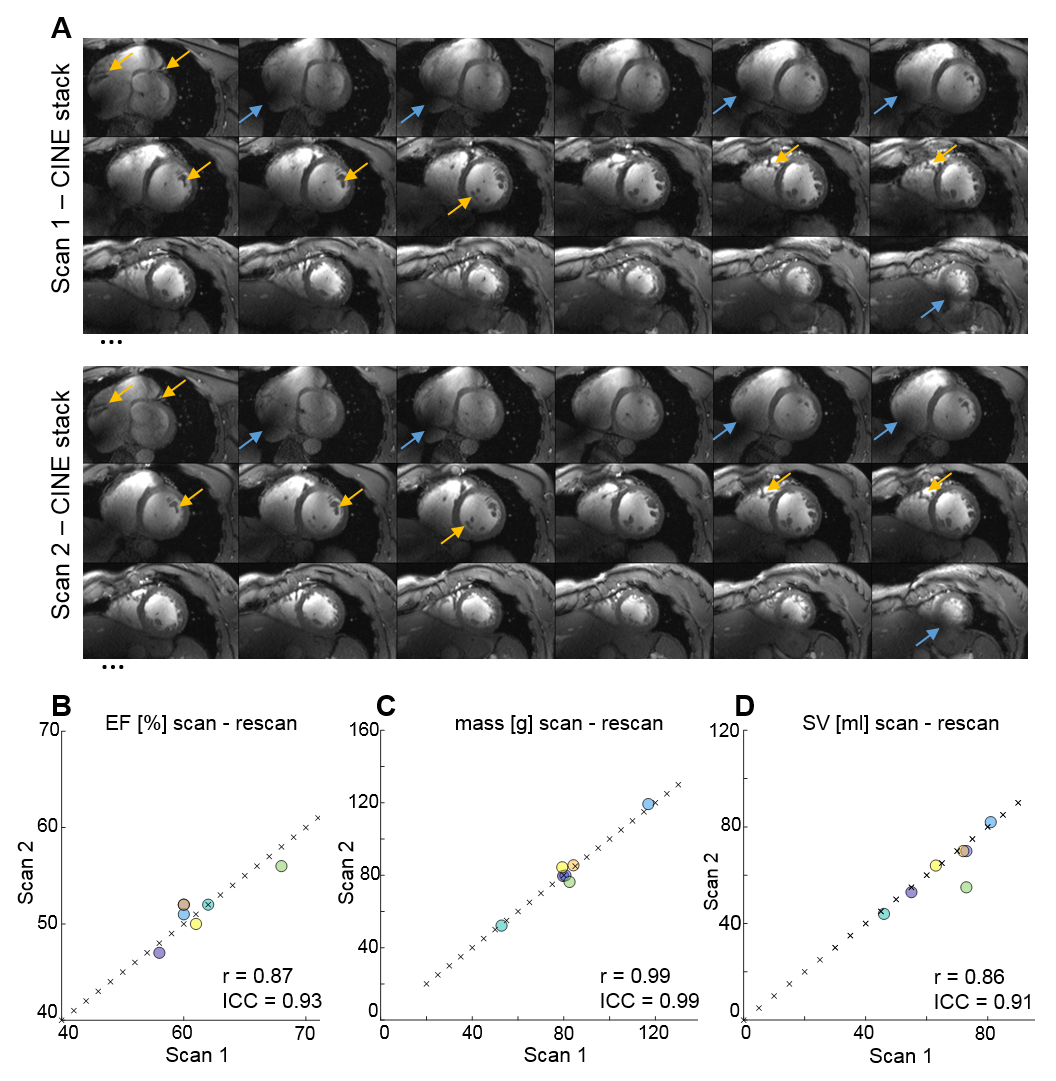
Figure 4a depicts representative SA CINE images of both scans for one volunteer. Anatomical details in both acquisitions are very similar (yellow arrows), while slight differences in B1 distribution (blue arrows) are present after repositioning the volunteer and the coil prior to the second scan. Correlation plots (Figure 4B-D) as well as Pearson correlation coefficients, and ICCs (Table 1) demonstrate excellent agreement between metrics of cardiac function for all volunteers. No significant differences were found between metrics derived from scan1 and scan2.
Discussion
In this study we show that 7T CMR using a novel transceiver array provides CINE images with consistent BTC and SNR. Compared to literature reports at 1.5T (1.5±0.4 at end-diastole and 1.4±0.3 at systole), we demonstrate markedly improved BTC (2.14 ± 0.24 at end-diastole, 1.80 ± 0.13 at systole).11 As indicated by ICCs>0.9,12 metrics of cardiac function showed excellent agreement between scan and rescan, despite minor B0 and B1 related artifacts. With n=7 the current data set is rather small and more measurements will be required to demonstrate that our results are valid for a broad spectrum of volunteers and patients. Our results regarding B0 shimming and the measurement of T2* suggest that the shimming volume ought to be a slab around the measured slice. Further measurements will be required to assess the optimal thickness of this slab. Diastolic and systolic T2* values (ratio=1.09) are comparable to septal diastolic (13.7±1.1 ms) and systolic (15.0±2.1) T2* values (ratio=1.12) reported at 7T13, indicating that T2* analysis does not have to be limited to the septum.Conclusion
We demonstrate that 7T CMR enables high reproducibility in the assessment of cardiac function and ventricular mass in subsequent measurements.Acknowledgements
LM Schreiber receives research support by Siemens Healthineers. The position of D. Lohr is partially funded by this research support.References
1. Ponikowski P, Voors AA, Anker SD, Bueno H, Cleland JGF, Coats AJS, Falk V, González-Juanatey JR, Harjola V-P, Jankowska EA, Jessup M, Linde C, Nihoyannopoulos P, Parissis JT, Pieske B, Riley JP, Rosano GMC, Ruilope LM, Ruschitzka F, Rutten FH, van der Meer P, Group ESD. 2016 esc guidelines for the diagnosis and treatment of acute and chronic heart failure: The task force for the diagnosis and treatment of acute and chronic heart failure of the european society of cardiology (esc)developed with the special contribution of the heart failure association (hfa) of the esc. European Heart Journal. 2016;37:2129-2200
2. Stäb D, Al Najjar A, O'Brien K, Strugnell W, Richer J, Rieger J, Niendorf T, Barth M. Cardiac magnetic resonance imaging at 7 tesla. JoVE. 2019:e55853
3. Reiter T, Lohr D, Hock M, Ankenbrand MJ, Stefanescu MR, Kosmala A, Kaspar M, Juchem C, Terekhov M, Schreiber LM. On the way to routine cardiac mri at 7 tesla - a pilot study on consecutive 84 examinations. PloS one. 2021;16:e0252797
4. Ibrahim EH, Arpinar VE, Muftuler LT, Stojanovska J, Nencka AS, Koch KM. Cardiac functional magnetic resonance imaging at 7t: Image quality optimization and ultra-high field capabilities. World journal of radiology. 2020;12:231-246
5. Prothmann M, von Knobelsdorff-Brenkenhoff F, Töpper A, Dieringer MA, Shahid E, Graessl A, Rieger J, Lysiak D, Thalhammer C, Huelnhagen T, Kellman P, Niendorf T, Schulz-Menger J. High spatial resolution cardiovascular magnetic resonance at 7.0 tesla in patients with hypertrophic cardiomyopathy – first experiences: Lesson learned from 7.0 tesla. PloS one. 2016;11:e0148066
6. von Knobelsdorff-Brenkenhoff F, Frauenrath T, Prothmann M, Dieringer MA, Hezel F, Renz W, Kretschel K, Niendorf T, Schulz-Menger J. Cardiac chamber quantification using magnetic resonance imaging at 7 tesla—a pilot study. European Radiology. 2010;20:2844-2852
7. Niendorf T, Schulz-Menger J, Paul K, Huelnhagen T, Ferrari VA, Hodge R. High field cardiac magnetic resonance imaging. Circulation: Cardiovascular Imaging. 2017;10:e005460
8. Terekhov M, Lohr D, Reiter T, Elabyad IA, Hock M, Schreiber LM. New commercial 8tx/16rx array for Clinical 7T Cardiac mri: Initial experience. Proc. of the 29th Annual Meeting of ISMRM. 2021:1584
9. Constantinides CD, Atalar E, McVeigh ER. Signal-to-noise measurements in magnitude images from nmr phased arrays. Magnetic resonance in medicine. 1997;38:852-857
10. Dymerska B, Eckstein K, Bachrata B, Siow B, Trattnig S, Shmueli K, Robinson SD. Phase unwrapping with a rapid opensource minimum spanning tree algorithm (romeo). Magnetic resonance in medicine. 2021;85:2294-2308
11.T hiele H, Nagel E, Paetsch I, Schnackenburg B, Bornstedt A, Kouwenhoven M, Wahl A, Schuler G, Fleck E. Functional cardiac mr imaging with steady-state free precession (ssfp) significantly improves endocardial border delineation without contrast agents. Journal of Magnetic Resonance Imaging. 2001;14:362-367
12. Koo TK, Li MY. A guideline of selecting and reporting intraclass correlation coefficients for reliability research. Journal of Chiropractic Medicine. 2016;15:155-163
13. Huelnhagen T, Ku M-C, Reimann HM, Serradas Duarte T, Pohlmann A, Flemming B, Seeliger E, Eichhorn C, A. Ferrari V, Prothmann M, Schulz-Menger J, Niendorf T. Myocardial effective transverse relaxation time t2* is elevated in hypertrophic cardiomyopathy: A 7.0 t magnetic resonance imaging study. Scientific Reports. 2018;8:3974
Figures