4971
Quantification and evaluation of cardiac motion correction methods for hybrid PET/MRI1Lawson Imaging, Lawson Health Research Institute, London, ON, Canada, 2Medical Biophysics, Western University, London, ON, Canada, 3Siemens Healthcare Limited, Oakville, ON, Canada, 4Medical Imaging, Western University, London, ON, Canada, 5Physics and Astronomy, Western University, London, ON, Canada
Synopsis
Keywords: Heart, Cardiovascular
Different motion correction methods for cardiac imaging were compared with no motion correction and free-motion images on a hybrid PET/MRI platform. These data were acquired in eight large animals five days after induction of myocardial infarction. PET/MRI images were acquired under different conditions of cardiac and respiratory motion: BodyCompass™, XD-GRASP, ECG gated. Upon completion of in vivo imaging, the animal was immediately euthanized within the scanner, and motion-free images were acquired. Initial quantitative evaluation of the cardiac images showed variation in mean and standard deviation values between the region of interest and different motion correction methods.Introduction
Accounting for motion during image acquisition is critical for accurate quantitative and qualitative analysis. This is particularly true for cardiovascular imaging studies, where respiratory and cardiac motion makes accurate quantitative measurements challenging. There are many intrinsic and extrinsic motion correction methods available for both PET and MRI modalities. Motion correction strategies for simultaneous PET/MRI are particularly appealing since they allow correction and fusion of PET and MRI data acquired at the same time. Using a simultaneous PET/MRI system, this study compares different motion correction methods in both cardiac PET and MRI images.Methods
We evaluated two MR-based motion correction methods: 1) BodyCompass™, which uses motion vector fields derived from a self-gated, stack-of-stars radial volumetric interpolated breath-hold examination (StarVIBE) sequence1 and 2) XD-GRASP, which uses a Golden-angle RAdial Sparse Parallel (GRASP) reconstruction with compressed sensing2,3. For simultaneously acquired PET images, 1) motion-vector corrected (BodyCompass™) and 2) electrocardiogram (ECG) gated PET images were compared. Both motion-corrected MRI and PET images were compared with no motion-corrected images and motion-free images from post-mortem scans.The animal protocol was approved by the Animal Care Committee of Western University. A total of eight female canines were imaged in a 3T Biograph mMR (Siemens Healthcare) PET/MRI scanner. A myocardial infarction (MI) was induced by temporarily placing a snare ligature around the left anterior descending coronary artery during left thoracotomy for 3 hours then removed later. Five days after the surgery, animals were imaged again at two timepoints with injections of Gadovist (0.12mmol/kg bolus) and 18F-FEPPA or 18F-FDG (10MBq/kg bolus). Respiration and ECG were recorded during the imaging session. After all motion images were acquired, the animal was euthanized within the scanner and immediately imaged which provided motion-free cardiac PET/MRI images without respiratory and cardiac motion.
The cardiac PET/MRI protocol consisted of a breath hold Dixon-based attenuation correction map; breath-hold T1 maps, T2 maps, and cine images spanning the left ventricle; 3D T1-weighted images (pre- and post-Gd); BodyCompass™, and a radial volumetric encoding (RAVE) sequence1. For this study, only relevant sequences are described. 3D post-Gd images were acquired using a fast low angle shot inversion recovery sequence with ECG signal and navigator echo for cardiac and respiratory gating, 0.625x0.625x0.900mm3, echo time (TE)= 1.18ms, repetition time (TR)= 509.29ms, inversion time= 370ms, flip angle= 20°, and pixel bandwidth (pBW)= 700Hz. BodyCompass™ images were acquired using a StarVIBE sequence with 1.172x1.172x3.000mm3, number of spokes= 2048, TE= 1.80ms, TR= 4.00ms, flip angle= 10°, and pBW= 545Hz. XD-GRASP images were acquired using a RAVE sequence with 1.172x1.172x3.000mm3, number of spokes= 2048, TE= 1.80ms, TR= 4.00ms, flip angle= 13°, and pBW= 545Hz. During all MRI imaging, list-mode PET data were acquired simultaneously.
BodyCompass™ motion correction was automatically processed in the scanner for both PET and MRI images. XD-GRASP motion correction was post-processed using a performance-optimized GRASP C++ reconstruction algorithm2 through the Yarra Framework(v0.97)4 on a high-performance workstation.
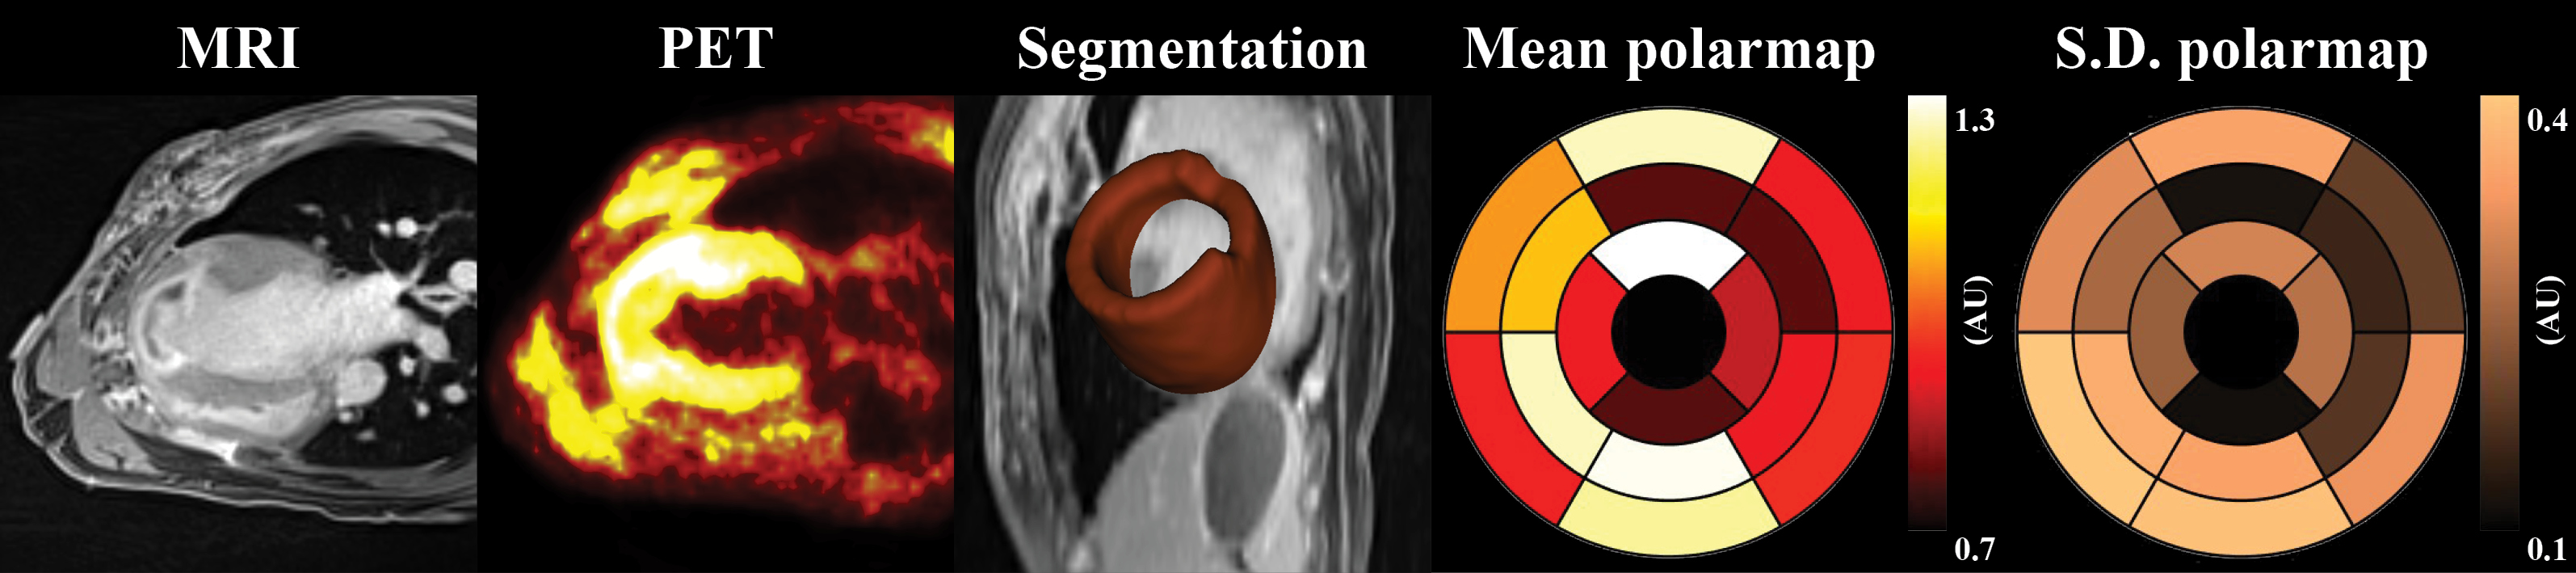
Figure 1 illustrates the process of quantifying left-ventricle (LV) cardiac segmentation. Initially, individual segmentation was performed with Carimas (v2.1)5 then further sliced into 17 regions of interest (ROI). The normalized mean and standard deviation (S.D.) of each ROI were quantified using an in-house developed tool in 3D Slicer (v5.0.2). Bull’s eye LV polar maps were generated using MATLAB (R2022a).
Results
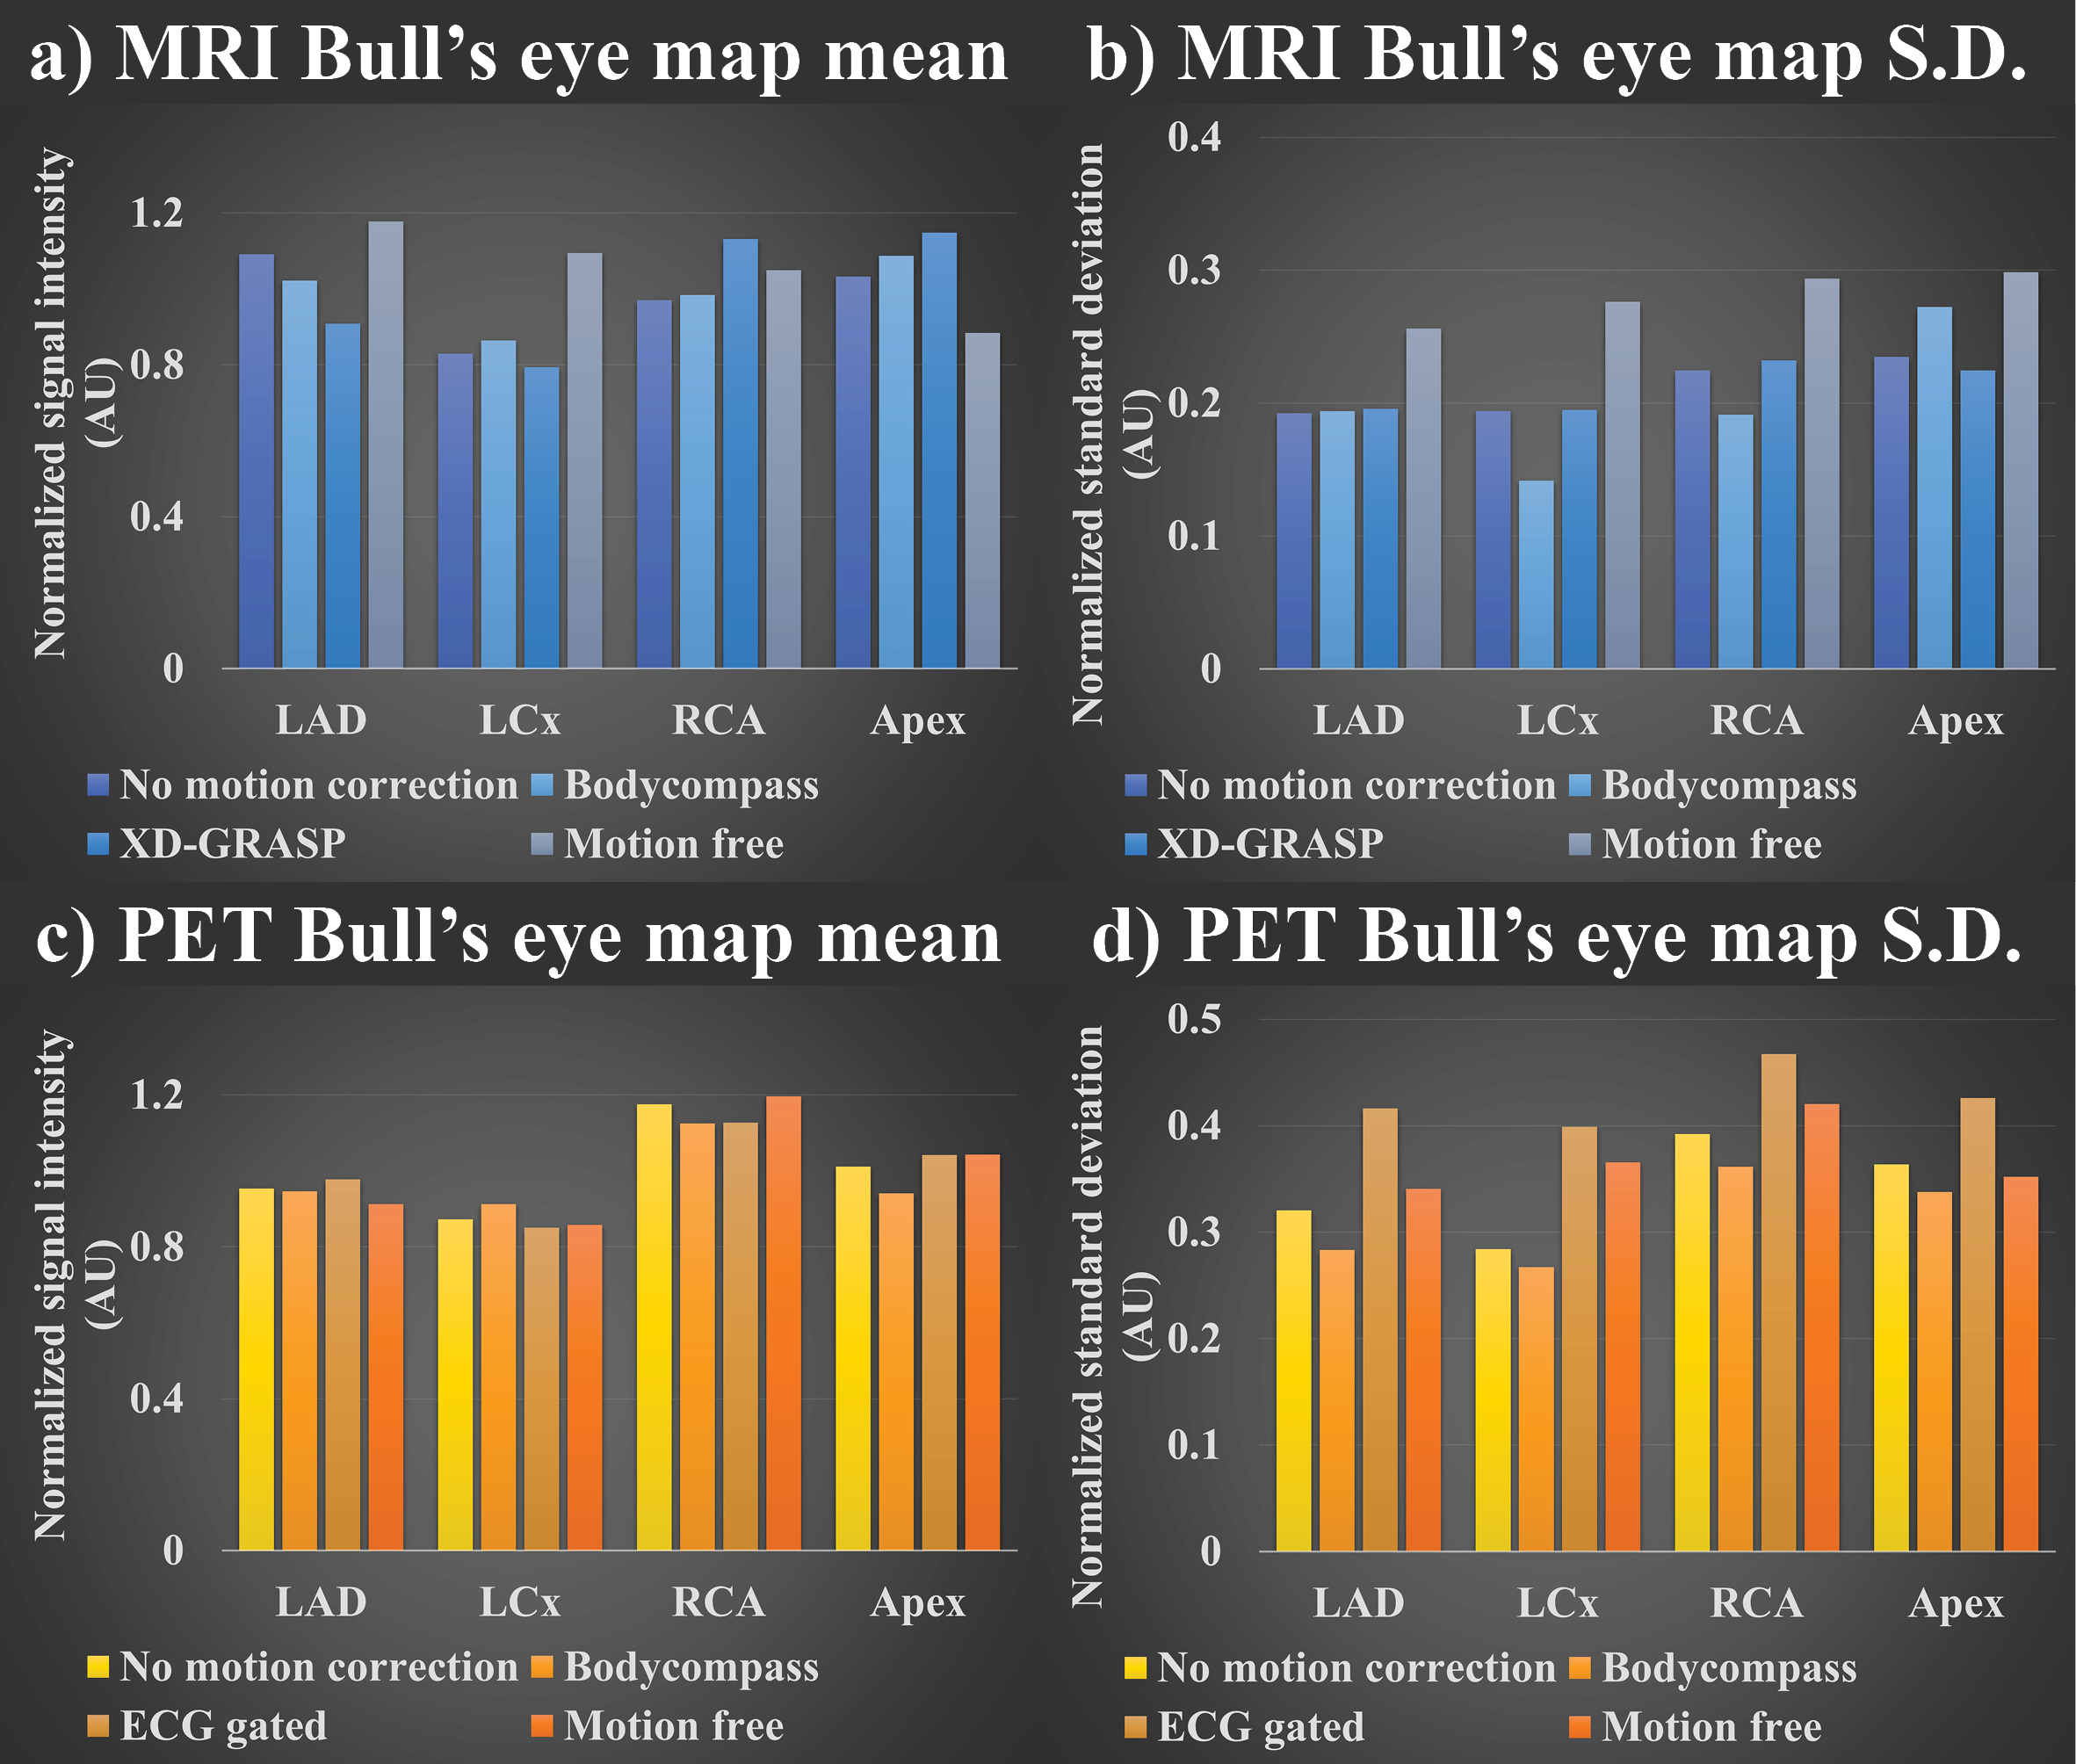
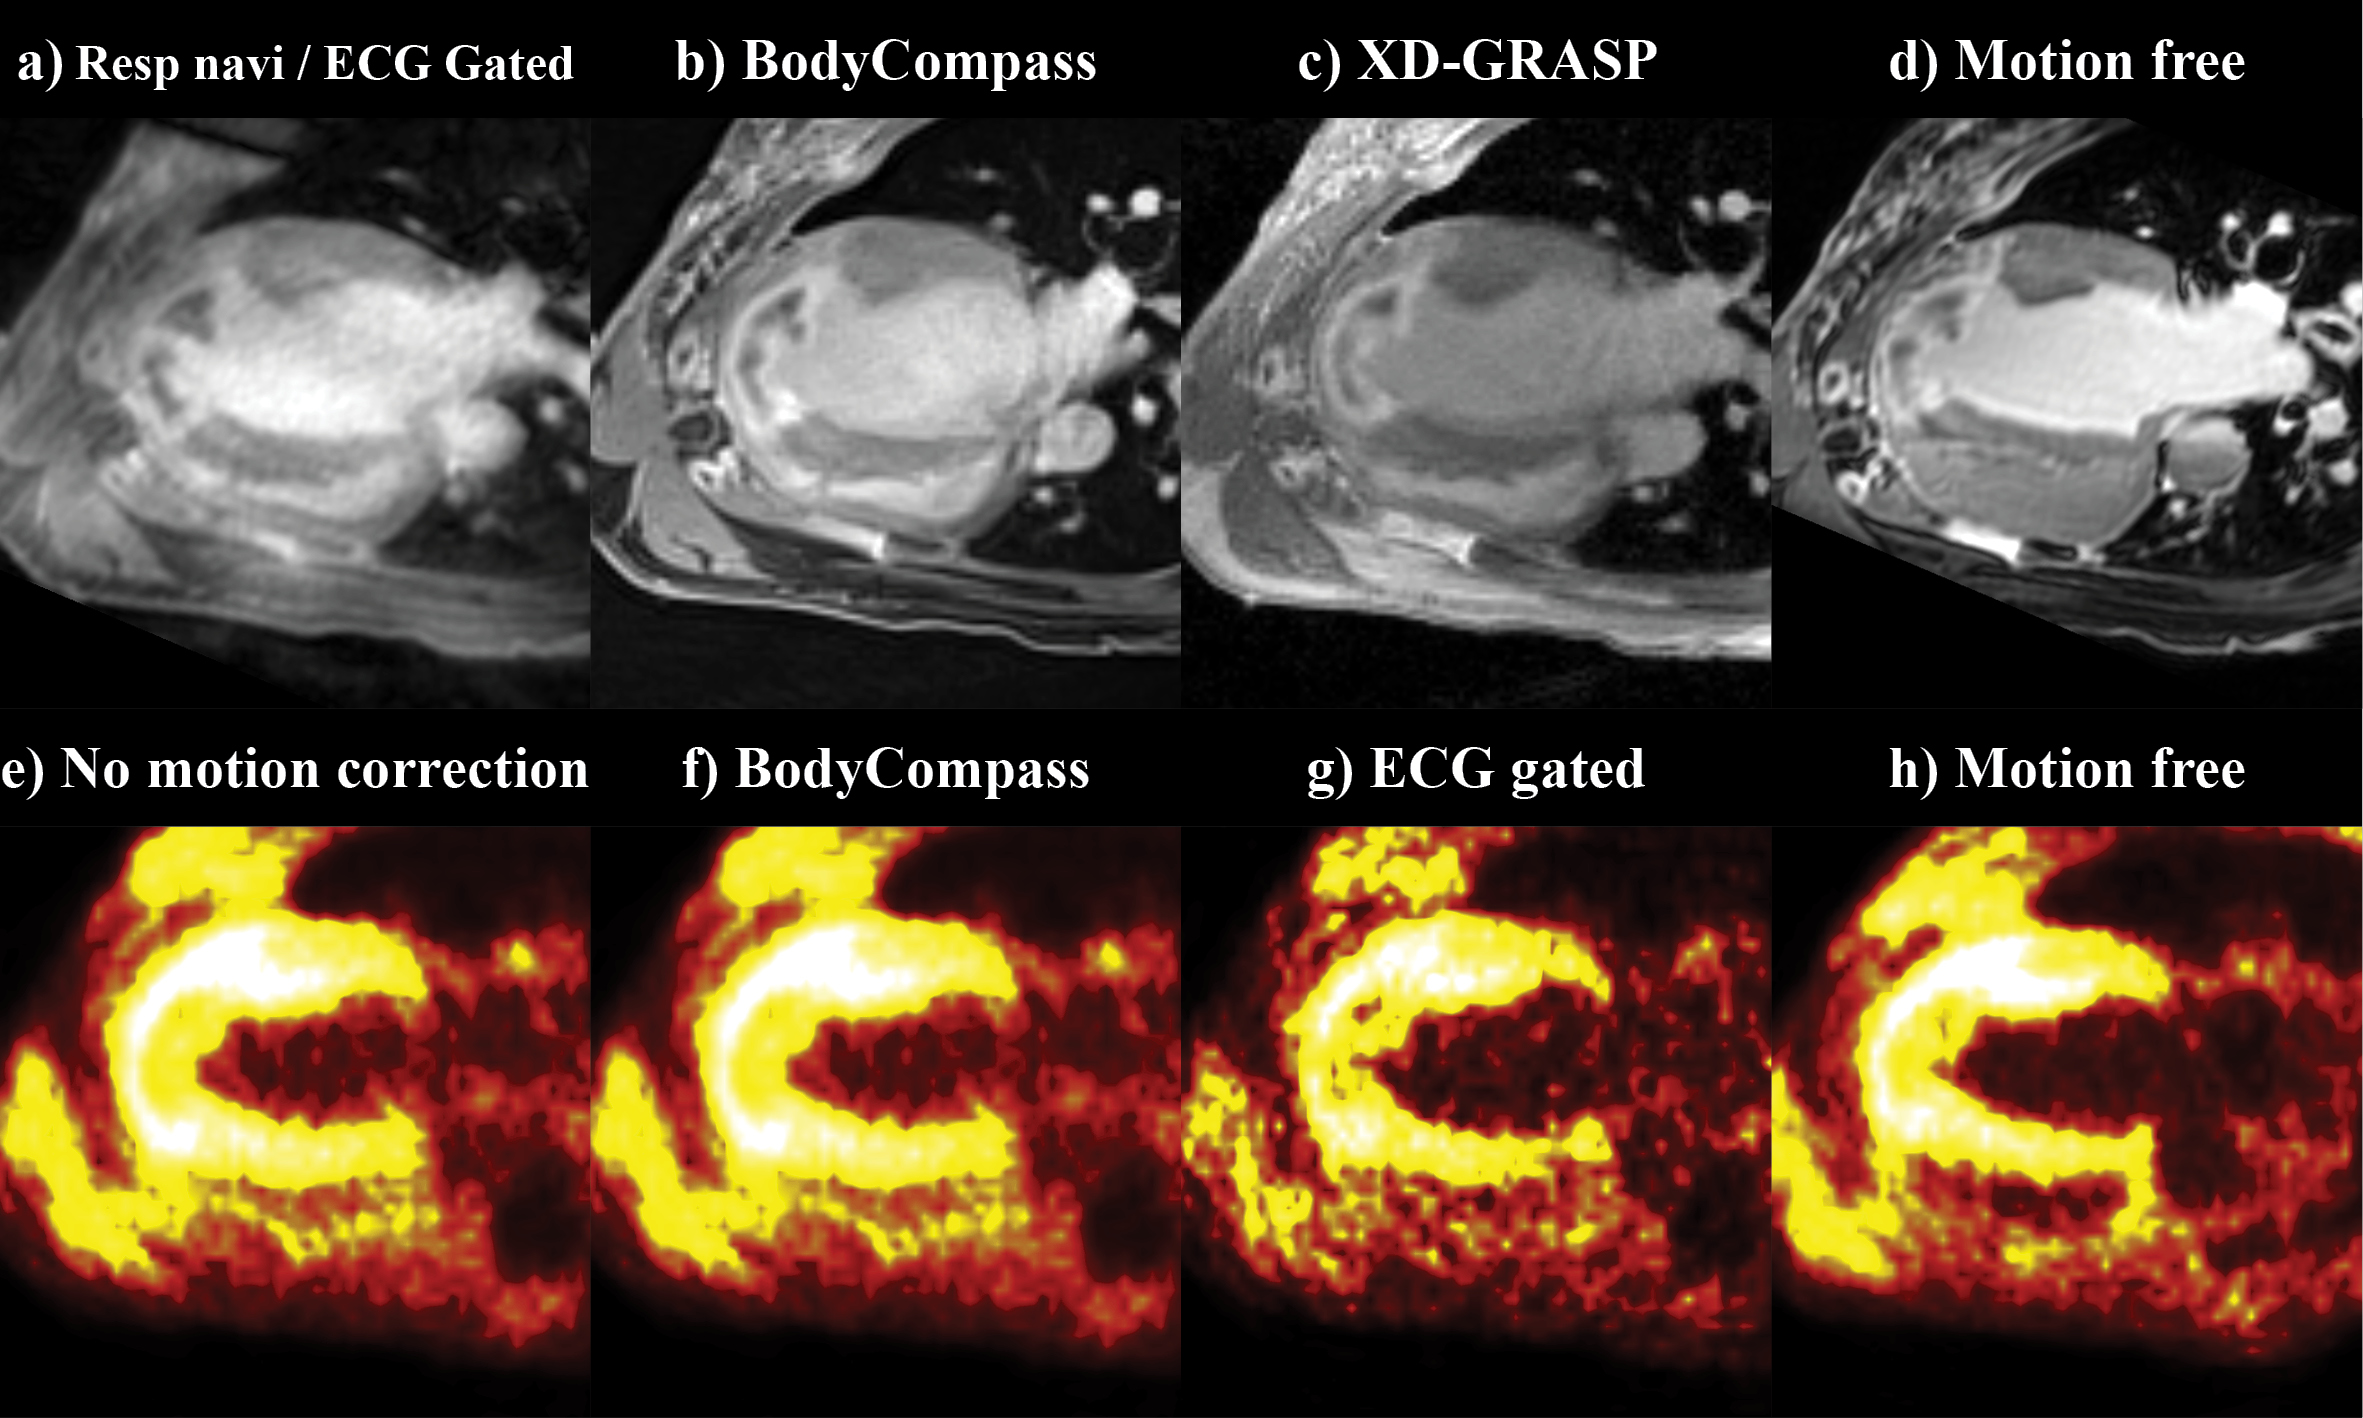
An example of 18F-FDG-PET/MRI was selected to showcase the impact of different motion correction strategies. Figure 2 shows normalized mean and S.D. comparison of different MRI & PET correction methods in four different LV ROIs: left-anterior descending artery, left-circumflex artery, right-coronary artery, and apex. For MRI motion correction methods, varying values of mean and S.D. was observed (Figures 2a/b)). In PET, mean values are aligned between different methods (Figure 2c)) while S.D values varied between methods (Figure 2d)). Figure 3 shows the four-chamber view of LV for the uncorrected, motion-corrected, and motion-free PET/MRI data.Discussion
The discrepancy in mean value between different MRI images as shown in Figure 2a) is due to the use of different sequences for acquisition where each MRI sequence weights T2, T1, and proton density differently. In contrast PET images are acquired using a singular event source, thus resulting in consistent mean value as shown in Figure 2c). However, the difference in S.D. between the motion correction method in both PET and MRI is interesting. Since motion introduces blurring to images, this can be considered the same as smoothing filter. Hence it is expected that motion-free images would be sharper and thus have higher mean and S.D. values as shown in Figure 2/2b). Furthermore, varying S.D. differences between each LV ROI suggests different motion correction methods may or may not improve the quality of the images depending on the ROI as evident in Figures 2b/d). Figure 3 also shows the varying degree of image quality for both PET and MRI motion correction.Conclusion
This study aimed to show a comparison of different motion correction methods in both PET and MRI images that are acquired simultaneously. The results showed varying values of the mean and S.D. for motion-corrected MRI & PET images. In the future, we will conduct a fully quantitative comparison of different motion correction methods in both cardiac PET and MRI.Acknowledgements
We would like to thank Jane Sykes and Thames Valley veterinary team for performing surgeries and preclinical animal setup. Siemens Healthcare Canada has generously provided us with the workstation server, sequences, and software. Dr. Heeseung Lim’s fellowship is funded by MITACS and Siemens. This work is funded by Heart and Stroke Foundation, NSERC Discovery, and NSERC Alliance.References
1. Chandarana, H., et al., Free-breathing radial 3D fat-suppressed T1-weighted gradient echo sequence: a viable alternative for contrast-enhanced liver imaging in patients unable to suspend respiration. Invest Radiol, 2011. 46(10): p. 648-53.
2. Feng, L., et al., XD-GRASP: Golden-angle radial MRI with reconstruction of extra motion-state dimensions using compressed sensing. Magn Reson Med, 2016. 75(2): p. 775-88.
3. Feng, L., et al., 5D whole-heart sparse MRI. Magn Reson Med, 2018. 79(2): p. 826-838.
4. Yarra Framework https://yarra-framework.org/
5. Patlak CS, Blasberg RG, Fenstermacher JD. Graphical evaluation of blood-to-brain transfer constants from multiple-time uptake data. Journal of Cerebral Blood Flow & Metabolism.
Figures