4968
Fast continuous 3D catheter balloon tracking for MRI-guided cardiac catheterization using 1D slice projection imaging with GRE stack of slices.1School of Biomedical Engineering and Imaging Sciences, King's College London, London, United Kingdom, 2MR Research Collaborations, Siemens Healthcare Limited, Camberley, United Kingdom, 3Guy's and St Thomas' NHS Foundation Trust, London, United Kingdom
Synopsis
Keywords: Heart, MR-Guided Interventions
An automated catheter tracking approach was developed for real-time continuous catheter visualization during MR-guided cardiac catheterization. 1D projection images are acquired for each slice of a stack providing fast 3D volume screening. These images are first collected in the absence of catheter to create an atlas on background signal across the breathing cycle. During catheter navigation, incoming images are matched to the best images of the atlas, which are then subtracted to suppress background signal. Finally, automated peak detection is applied to extract the catheter balloon location. The technique is successfully demonstrated during in-vitro and in one patient.
Introduction
Cardiac catheterization is a routine procedure in congenital heart disease patients. Presently, X-ray fluoroscopy is the gold standard for procedure guidance. Magnetic Resonance Imaging (MRI) provides an attractive alternative to fluoroscopy1,2. The main advantages are the lack of ionizing radiation, superior soft tissue contrast and simultaneous blood flow and pressure quantification. Gadolinium-filled balloon catheter are commonly used during MRI-guided cardiac catheterization. Real-time singe-slice imaging is used to visualize the catheter, through the hyper signal enhancement of the catheter balloon. However, the catheter often goes reported out-of-plane, previously for > 30% of scanning time3. When the catheter is lost from the imaging plane, it should first be relocated by imaging at different locations, which is distracting from the main procedure and prolong the intervention. In this proof-of-concept study, we present a fast 3D screening approach for real-time continuous tracking of a gadolinium-filled catheter balloon during navigation.
Methods
A prototype 2D multi-slice gradient echo sequence was designed to achieve fast 3D screening by only acquiring the central k-space line per slice. This enables the acquisition of a stack of 1D projection that can be put together as a 2D projection image representing a 3D volume. To increase the contrast between the balloon and the background, a non-selective inversion pulse (flip angle = 90°)4 was added before the acquisition of each 2D projection image. In addition, a double-echo readout was applied to produce water-only signal with the two-point Dixon method5. To remove background signal, an atlas of background 2D projection images is built by continuous imaging over several breathing cycles at the beginning of the procedure. During catheter navigation, each incoming 2D projection image is paired to its closest match (highest correlation) from the atlas. The two images are then subtracted to suppress the background signal. The catheter balloon location is finally identified using a peak detection approach: i) regional (6x6 pixels patches) high-pass filter - to identify candidate locations; ii) peak width estimate – to exclude unrealistic signals (expected balloon size: 3.52π – 102π mm2); iii) signal peak estimate – a signal peak threshold is determined as the half of expected signal ($$$E$$$):$$ \beta_x = 1/5\sum\nolimits_{t = 1}^5 {|d_{x,t}|} $$
$$ E = median_x(s_{x,1}/\beta_x) median_x(\beta_x) $$
Here $$$s$$$ represents the 2D projections organized in spatial – temporal indexing ($$$x,y$$$). $$$d$$$ represents the difference images calculated for $$$s$$$. $$$\beta$$$is the difference signal estimate without the target balloon signal in it. This threshold is adjusted to 0.8 * the peak value detected in the previous 2D projection if the balloon was detected. The candidate peak with the highest value above the described adaptive threshold is selected as the current balloon position.
All imaging was performed on a 1.5T MR scanner (Magnetom Aera, Siemens, Erlangen, Germany). The technique was tested in a phantom (FOV=300×160mm2, FA=30°, TEs=2.4/4.8ms, TR=6.1ms, temporal resolution=~122ms, training period=12s, stack of 20 traversal slices producing coronal 2D projections) to evaluate the performance of the fat suppression strategy. A gadolinium-filled syringe (1% dilution) was used to emulate a catheter balloon. The proposed sequence was acquired in one healthy volunteer (in the absence of catheter) to illustrate the quality of 2D projection images. The overall tracking approach was evaluated in-vivo in one patient undergoing MRI-guided cardiac catheterization (FOV=400x160mm2, FA=30°, TEs=2.4/4.8ms, TR=6.2ms, temporal resolution=~124ms, training period=43s, stack of 20 traversal slices producing coronal 2D projections). The interventionist was asked to displace the gadolinium filled balloon catheter after the initial training period to enable evaluation of the visualization and performance of the detection algorithm.
Results
Example in-vivo 2D projection images from one healthy volunteer acquired using different orientations are shown in Fig. 1. Lipid signal suppression was successful in-vitro (Fig. 2) and in-vivo (Fig. 3). Evaluation in one patient demonstrated excellent catheter visibility in the difference images. This enabled robust continuous tracking of the catheter balloon location (Fig. 3). Fig. 4 presents the extracted coordinates and values from the balloon detection and tracking algorithm.Discussion
The proposed approach was evaluated using a single (traversal) stack orientation, which enabled accurate estimation of 2D coordinates. The introduction of the second orthogonal stack is now warranted to enable full 3D coordinate estimation. Further work is also needed to determine the optimal imaging orientations and parameters for the 3D catheter balloon tracking task. For example, fig. 4 shows the balloon signal undulations as it moves along the slice direction, which may be reduced using higher spatial resolution in the slice direction.Conclusion
The proposed catheter tracker technique based on 1D projection stacks, lipid and background signal suppression was developed for fast 3D detection and visualization of catheters during MR-guided cardiac catheterization. This technique enabled fast 3D catheter balloon tracking without any prior knowledge of the catheter location. This approach has potential to facilitate catheter navigation, which will be evaluated in future studies.Acknowledgements
No acknowledgement found.References
1. Rogers T, Ratnayaka K, Khan JM, Stine A, Schenke WH, Grant LP, Mazal JR, Grant EK, Campbell-Washburn A, Hansen MS, Ramasawmy R, Herzka DA, Xue H, Kellman P, Faranesh AZ, Lederman RJ. CMR fluoroscopy right heart catheterization for cardiac output and pulmonary vascular resistance: results in 102 patients. Journal of cardiovascular magnetic resonance : official journal of the Society for Cardiovascular Magnetic Resonance 2017;19(1):54.
2. Razavi R, Hill DL, Keevil SF, Miquel ME, Muthurangu V, Hegde S, Rhode K, Barnett M, van Vaals J, Hawkes DJ, Baker E. Cardiac catheterisation guided by MRI in children and adults with congenital heart disease. Lancet 2003;362(9399):1877-1882.
3. Velasco Forte MN, Roujol S, Ruijsink B, Valverde I, Duong P, Byrne N, Krueger S, Weiss S, Arar Y, Reddy SRV, Schaeffter T, Hussain T, Razavi R, Pushparajah K. MRI for Guided Right and Left Heart Cardiac Catheterization: A Prospective Study in Congenital Heart Disease. Journal of magnetic resonance imaging : JMRI 2021;53(5):1446-1457.
4. Velasco Forte MN, Pushparajah K, Schaeffter T, Valverde Perez I, Rhode K, Ruijsink B, Alhrishy M, Byrne N, Chiribiri A, Ismail T, Hussain T, Razavi R, Roujol S. Improved passive catheter tracking with positive contrast for CMR-guided cardiac catheterization using partial saturation (pSAT). Journal of cardiovascular magnetic resonance : official journal of the Society for Cardiovascular Magnetic Resonance 2017;19(1):60.
5. Dixon WT. Simple proton spectroscopic imaging. Radiology 1984;153(1):189-194.
Figures
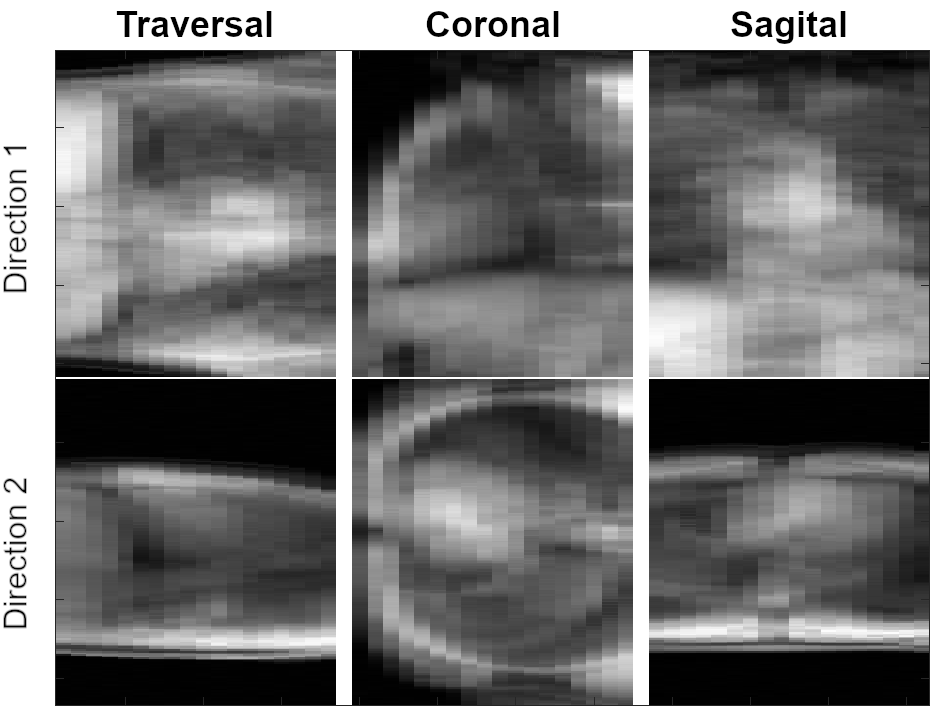
Fig. 1. Examples of the 2D projection imaging for traversal, coronal and sagittal stacks of slices. The figure presents how 2D imaging stacks can be projected onto the orthogonal directions. In the resulting 2D projection of a 3D volume each image point is the total density of exited protons summed along the projection direction.
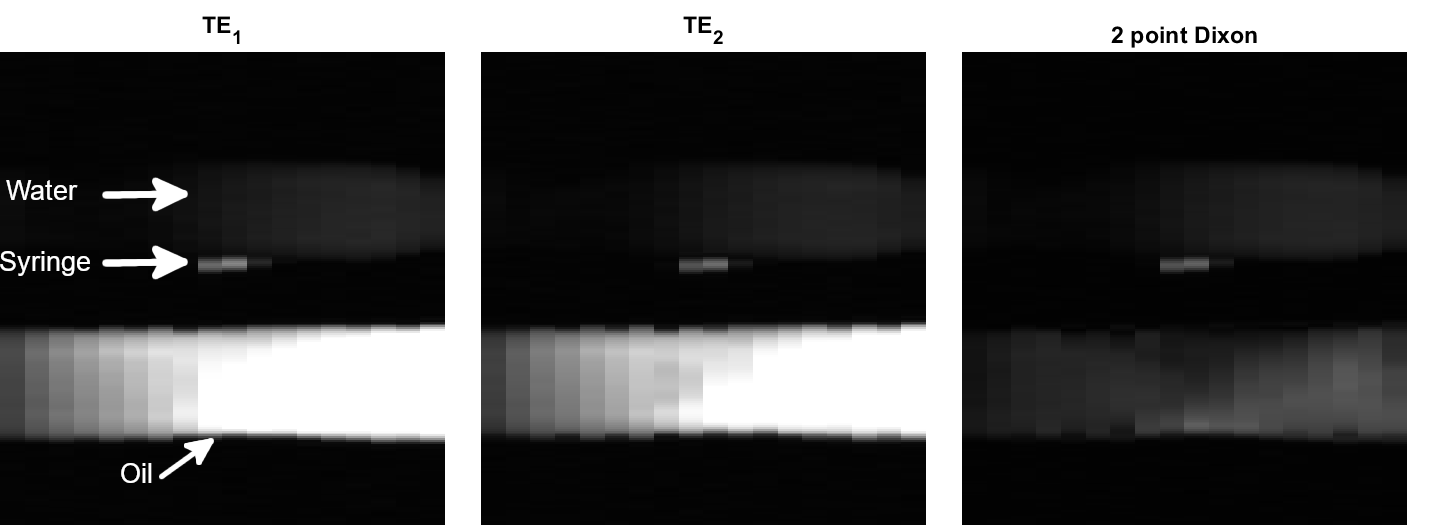
Fig. 2. Evaluation of the proposed approach in phantom. The phantom consisted of a water bottle, an oil bottle and a contrast filled syringe. Two images at echo times in-phase (TE1=2.4ms) and out-of-phase (TE2=4.8ms) are presented with their sum (two-point Dixon – water only image). Successful lipid signal suppression was achieved in the two-point Dixon image and resulted in improved contrast between the contrast filled syringe and the phantom.
Fig. 3. Evaluation of the technique during MR-guided cardiac catheterization in one patient. Examples of 2D projection image (Target), reference images from the atlas (Reference), and background subtraction results (Difference) are shown. The balloon was visible in Target images and can be seen as the bright peak in the Difference image. The dashed blue and red lines represent the automated detection of the catheter balloon coordinates.
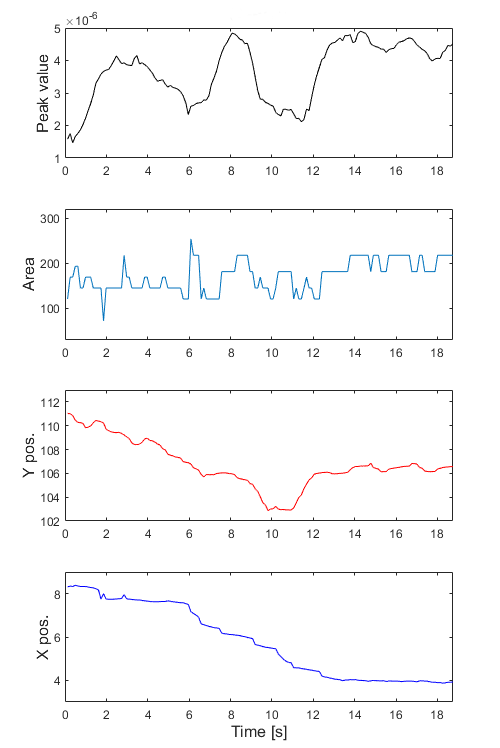
Fig. 4. Catheter tracking during MR-guided cardiac catheterization in one patient. The plots are, from the top, Peak value, peak area and corresponding 2D coordinates of the catheter balloon automatically detected using the proposed post-processing approach.