4966
Joint K-TE reconstruction for T2 mapping with the weighted linear regression fitting
Yan Dai1, Jie Deng1, and Xun Jia2
1University of Texas Southwestern Medical Center, Dallas, TX, United States, 2Johns Hopkins University, Baltimore, MD, United States
1University of Texas Southwestern Medical Center, Dallas, TX, United States, 2Johns Hopkins University, Baltimore, MD, United States
Synopsis
Keywords: Image Reconstruction, Quantitative Imaging
We developed a joint quantitative imaging reconstruction algorithm to reconstruct T2-weighted (T2W) images and T2 mapping simultaneously through an iterative optimization process, which integrated the weighted linear regression fitting. The proposed method achieved accurate T2 measurements and improved signal-to-noise (SNR) of both T2W images and the T2 map.Introduction
Measuring T2 relaxation time of tissue provides quantitative information for tissue characterization using MRI. The conventional method generates T2 map by voxel-by-voxel fitting the signal decay of a series of T2-weighted (T2W) magnitude images acquired at different echo times (TE). Image acquisition for T2 mapping using the multi-echo spin echo sequence is usually time-consuming and sensitive to motion during the acquisition. Parallel imaging is used to reduce imaging time but at the cost of signal-to-noise ratio (SNR). In addition, low SNR in tissue with short T2 causes inaccurate T2 measurement. Considering the correlation of MR images in the spatial (i.e., k-space) and time domain (i.e., T2 relaxation signal decay along TE), we propose a joint k-TE space reconstruction method to reconstruct the T2W image at each TE and resultant T2 map simultaneously. A weighted linear regression algorithm was applied to the joint reconstruction process to automatically assign weights to the data points when fitting T2 decay.Methods
A joint K-TE reconstruction algorithm is viewed as an optimization problem as described in Eq. 1. $$min_{f, R_2} \frac{1}{2} \sum_{TE} |FAf(x, TE) - g(TE)|^2 + R[f(x, TE), \lambda_1] + R[R_2(x), \lambda_2]\;\;\;\;\;\;\;\;\;\;\;\;\;(1) \\s.t. f(x, TE) = f(x,0)e^{-R_2(x)TE}, b>0$$, where $$$f(x, TE)$$$ is the T2W image acquired at each TE, $$$g(TE)$$$ is the corresponding k-space, and $$$R_2(x)$$$ is R2 map (i.e., reciprocal of T2 map). $$$F$$$ and $$$A$$$ denotes the 2D Fourier transform operator and phase correction matrix, respectively. $$$R[.]$$$ is image domain regularization applied to both T2W images and R2 map, which was taken as the block-matching and 3D filtering (BM3D)1 denoising form in this study via the plug-and-play approach2. $$$\lambda_1$$$ and $$$\lambda_2$$$ are parameters for the regularization terms of BM3D. The TE constraint links solutions and $$$R_2(x)$$$ via the mono-exponential decay model. This problem was solved using Alternating Direction Method of Multipliers (ADMM)3, in which T2W images and R2 map are updated iteratively to remove noise. In addition, a weighted linear regression algorithm4 was used to better estimate R2, especially in regions with extremely high R2. Assuming Gaussian noise exists in T2W images, the uncertainty of R2 calculation can be approximated as the 1st-order standard deviation, and its reciprocal was assigned as the weight for each T2W image pixel. The weighted linear regression was applied in the iterative form, with the weights updated based on the estimated signal from the previous loop. Further, pixels decaying too fast with low image SNR were excluded from the fitting process. A multi-echo spin echo sequence was performed on a T2 phantom (Essential System Phantom for Relaxometry, CaliberMRI, Boulder, CO) consisting of 14 vials, each with a different T2 value. Sixteen T2W magnitude images acquired at TEs ranging from 11ms to 176ms with a TE interval of 11ms were generated from the scanner. T2 maps were generated based on these T2W magnitude images using both linear and weighted linear fitting methods directly and compared with the T2 map generated by the proposed joint reconstruction method integrated with weighted linear fitting.Results
As shown in Fig. 1. for all of the 14 vials, T2 values measured by the joint reconstruction method (1st column) were compared with those measured by the conventional method with weighted linear fitting (2nd column) and with routine linear fitting (3rd column). Compared with reference standard T2 values generated by the scanner (red line), the proposed method and conventional method with weighted linear fitting achieved comparably accurate measurements, better than that with routine linear fitting. More importantly, the proposed joint reconstruction method provided higher SNR in each vial compared with the other two methods. The simultaneously reconstructed T2W images and T2/R2 maps are shown in Fig. 2. In Fig .3, we compared the signal intensity of a pixel with very low T2 on different T2W images without and with joint reconstruction. The background noise, especially those at high TE, was obvious using the conventional method but suppressed with the joint reconstruction method.Discussion
The joint K-TE reconstruction method takes the advantage of the exponential decay relationship between T2W images and the resultant T2 map to reconstruct them through an iterative optimization process. By using weighted linear regression fitting, different weights are assigned to pixels based on the uncertainty resulting from noise. During the iterations, T2W images at certain TE are updated based on the other T2W images acquired at different TEs, and thereby the noise of the images was removed. The weighted linear regression process is based on the assumption of Gaussian noise, and it will not hold in situations of extremely low SNR or the existence of other noise distributions. Our method simply assigned a weight of 0 to pixels with very low SNR, and the joint reconstruction may fail when the T2 decay is too fast. Further work will include incorporating more flexible methods, e.g., Maximum a Posteriori, that are not constrained to Gaussian noise assumption, into the joint reconstruction scheme.Conclusion
We developed a joint reconstruction algorithm to reconstruct T2-weighted (T2W) images and T2 mapping simultaneously by integrating the weighted linear regression fitting. The proposed method achieved accurate T2 measurements and improved signal-to-noise (SNR) of both T2W images and T2 mapping compared with the conventional method.Acknowledgements
This work was supported in part by the Cancer Prevention and Research Institute of Texas (grant \#RP200573) and the National Cancer Institute (grant \#R01CA227289).References
1. Dabov K, Foi A, Katkovnik V, et al. Image denoising by sparse 3-D transform-domain collaborative filtering[J]. IEEE Transactions on image processing, 2007, 16(8): 2080-2095.2. Venkatakrishnan S V, Bouman C A, Wohlberg B. Plug-and-play priors for model based reconstruction[C]//2013 IEEE Global Conference on Signal and Information Processing. IEEE, 2013: 945-948.
3. Boyd S, Parikh N, Chu E, et al. Distributed optimization and statistical learning via the alternating direction method of multipliers[J]. Foundations and Trends® in Machine learning, 2011, 3(1): 1-122.
4. Johansen S. The Welch-James approximation to the distribution of the residual sum of squares in a weighted linear regression[J]. Biometrika, 1980, 67(1): 85-92.
Figures
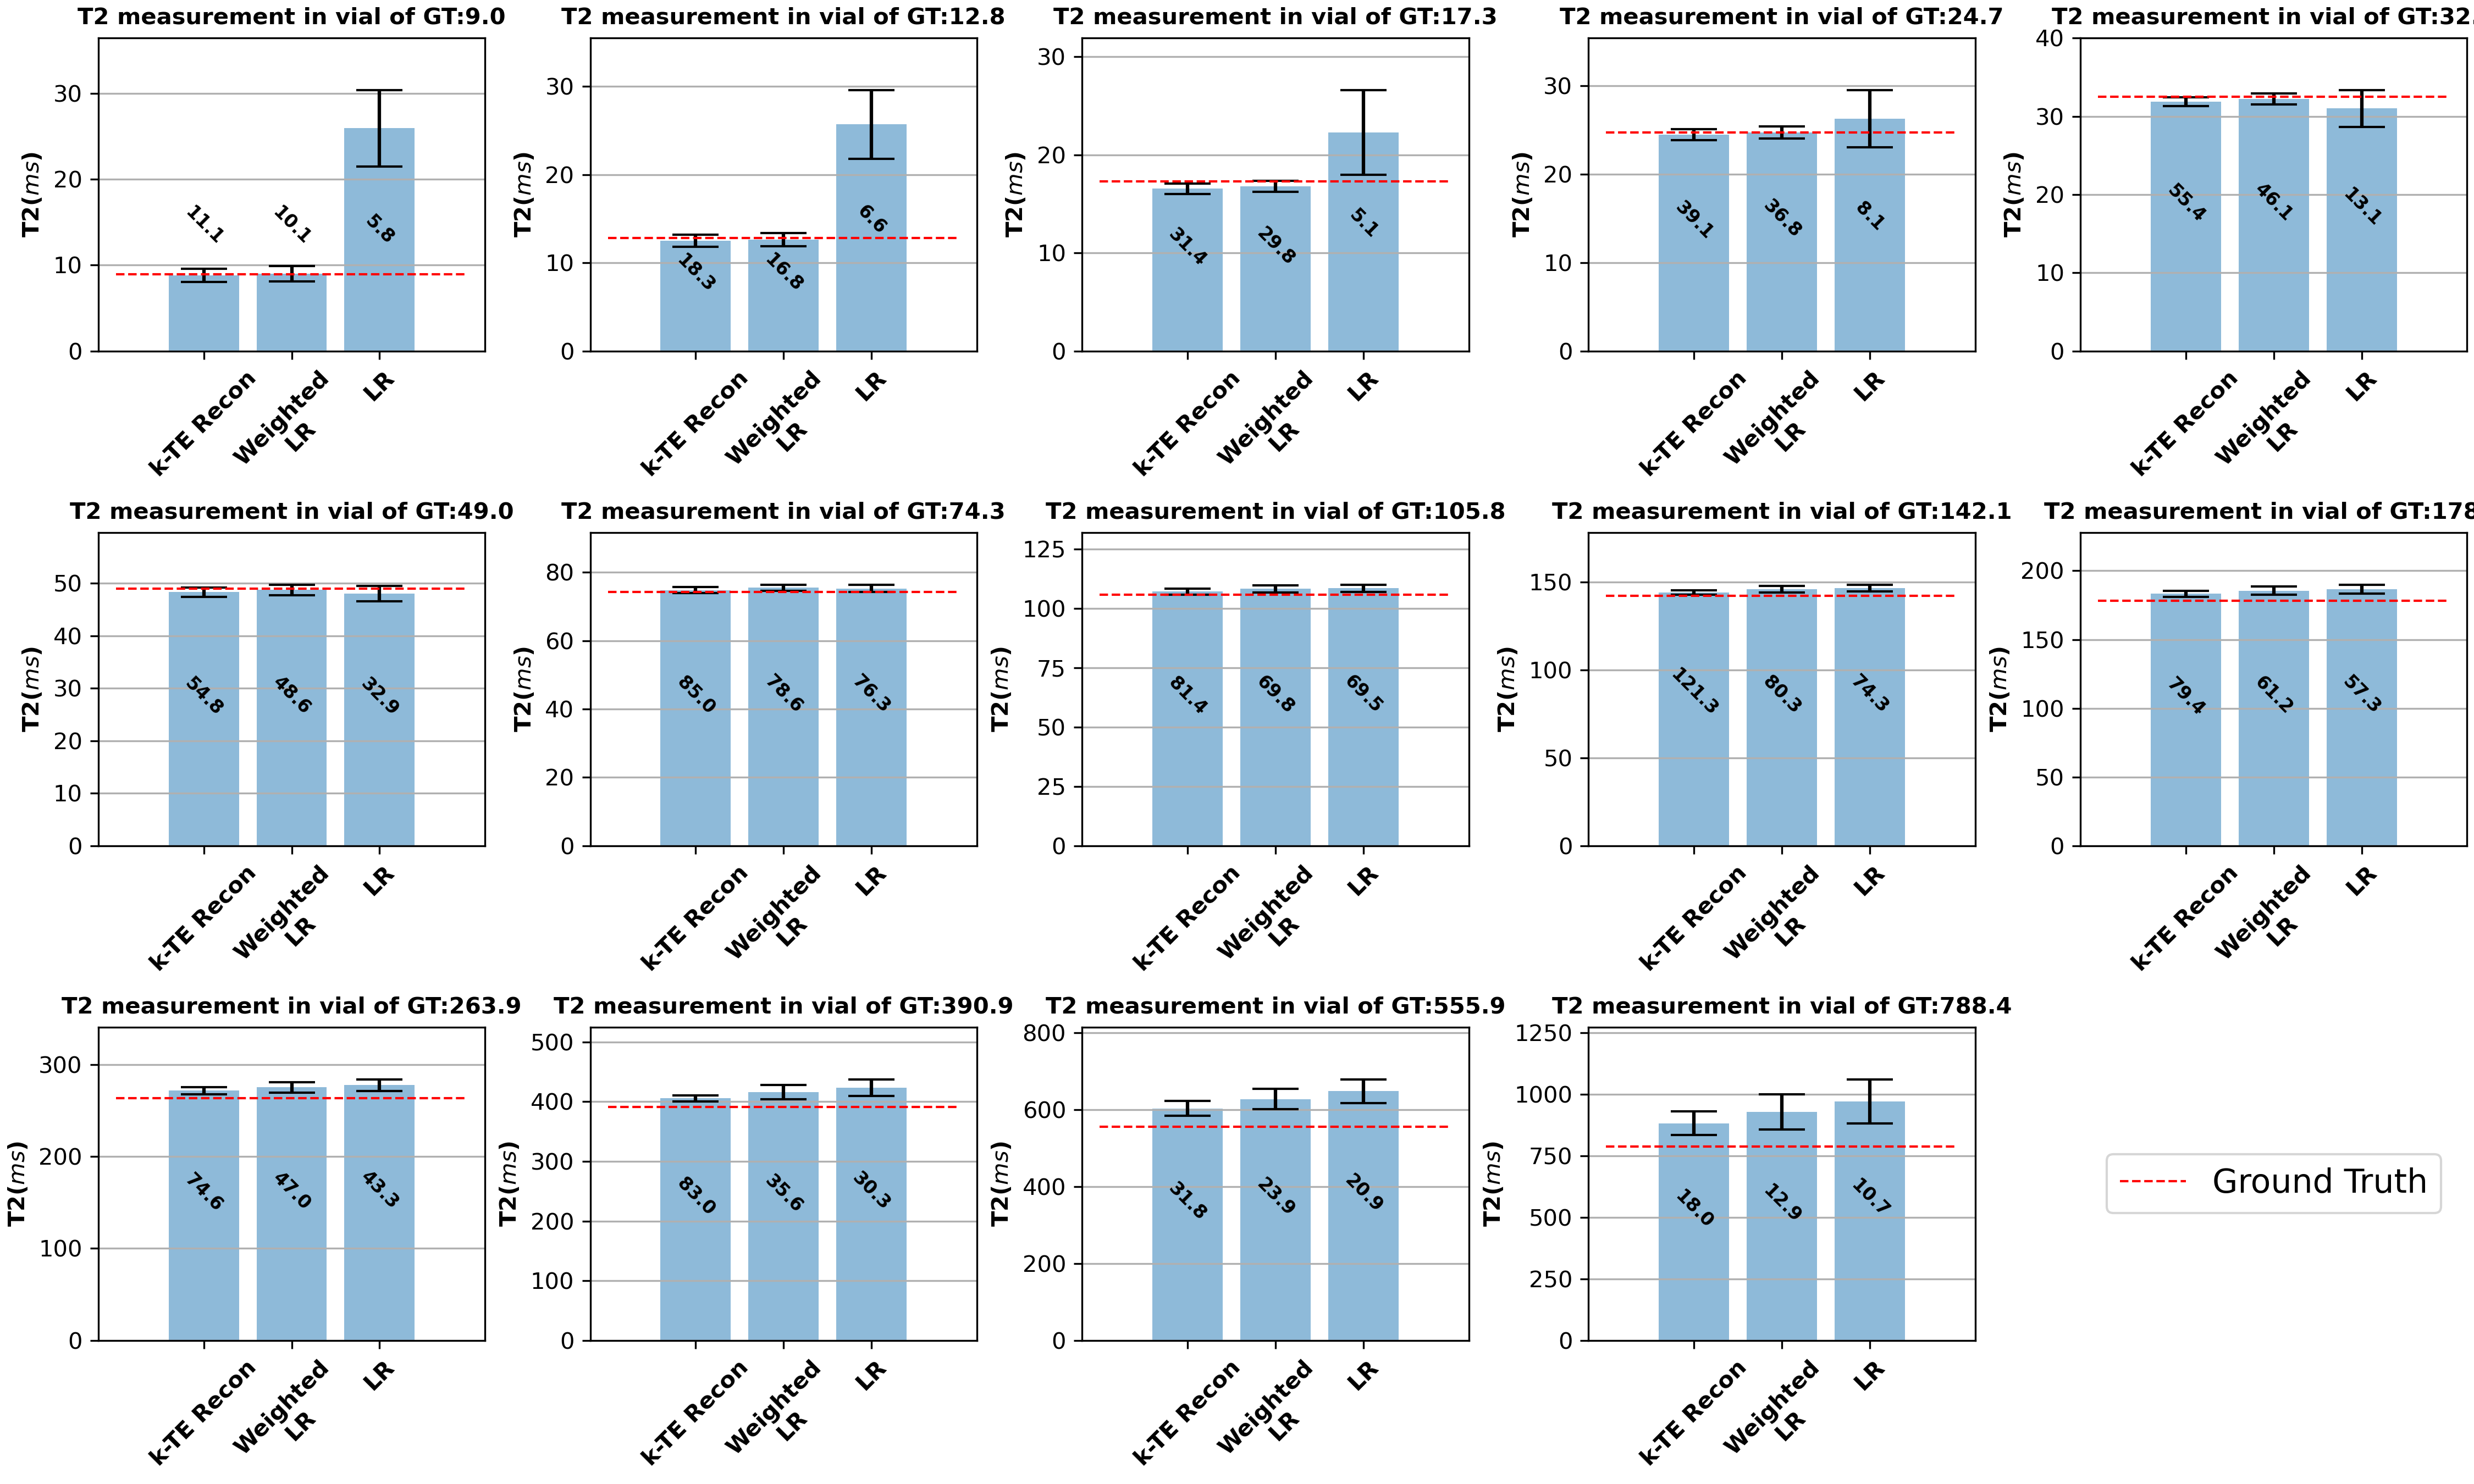
Fig. 1. T2 measurement comparison in all 14 vials with different ‘ground truth’ T2 using joint reconstruction (1st column), conventional method with weighted linear regression (2nd column), and conventional method with just linear regression fitting (3rd column). The error bar shows the mean and standard error. SNR of T2 map by different methods is labeled above or within each bar.
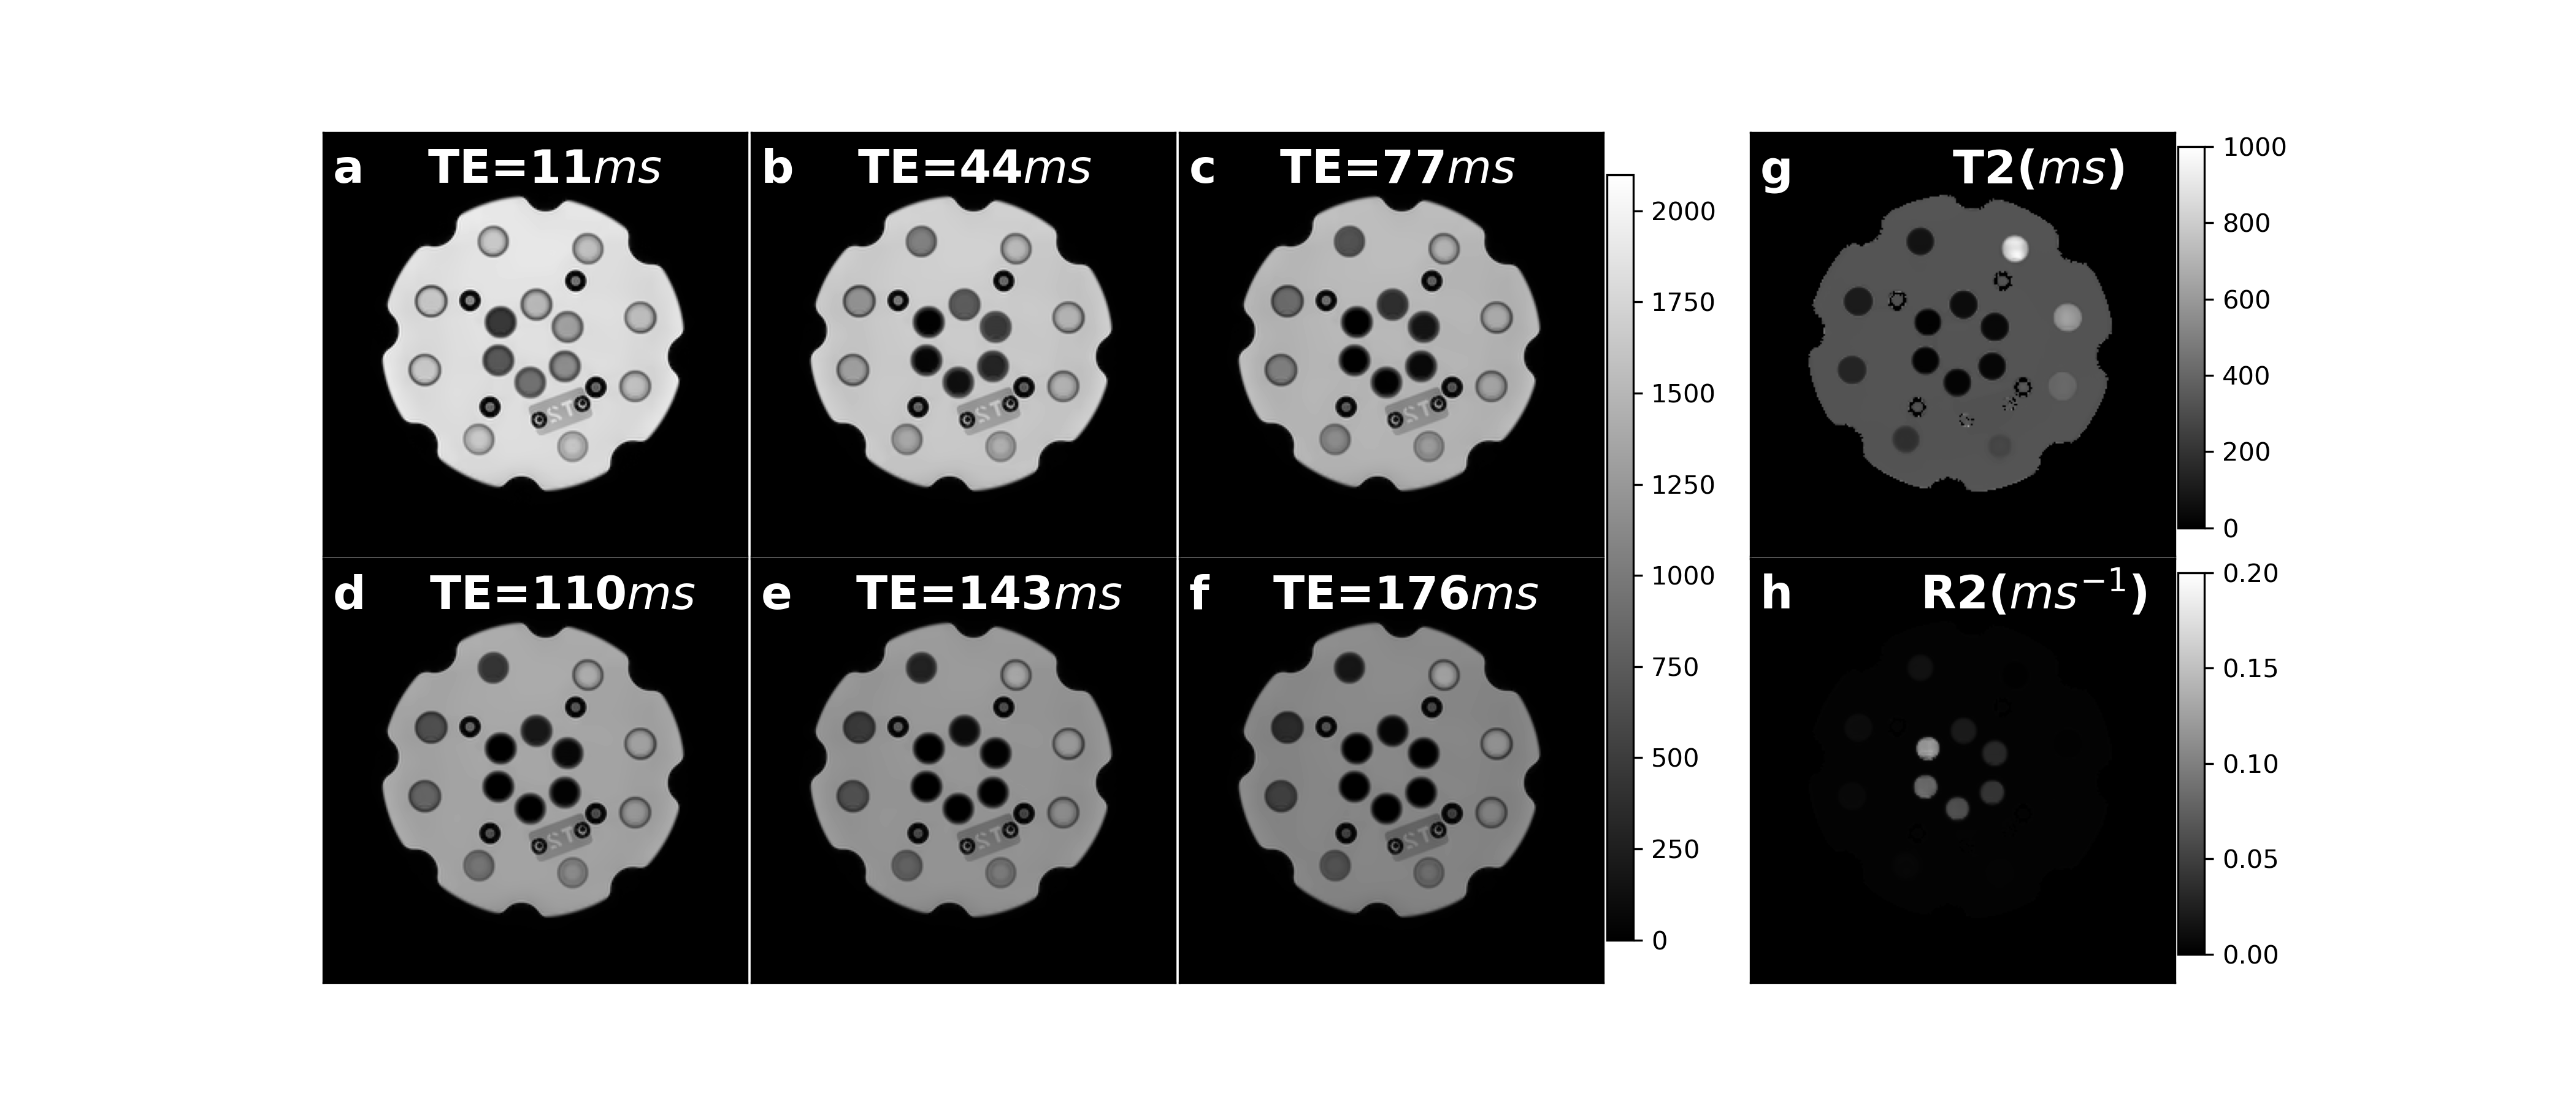
Fig. 2. The reconstructed T2W images (a-f), T2 map (g), and R2 map (h) simultaneously reconstructed by the proposed method.
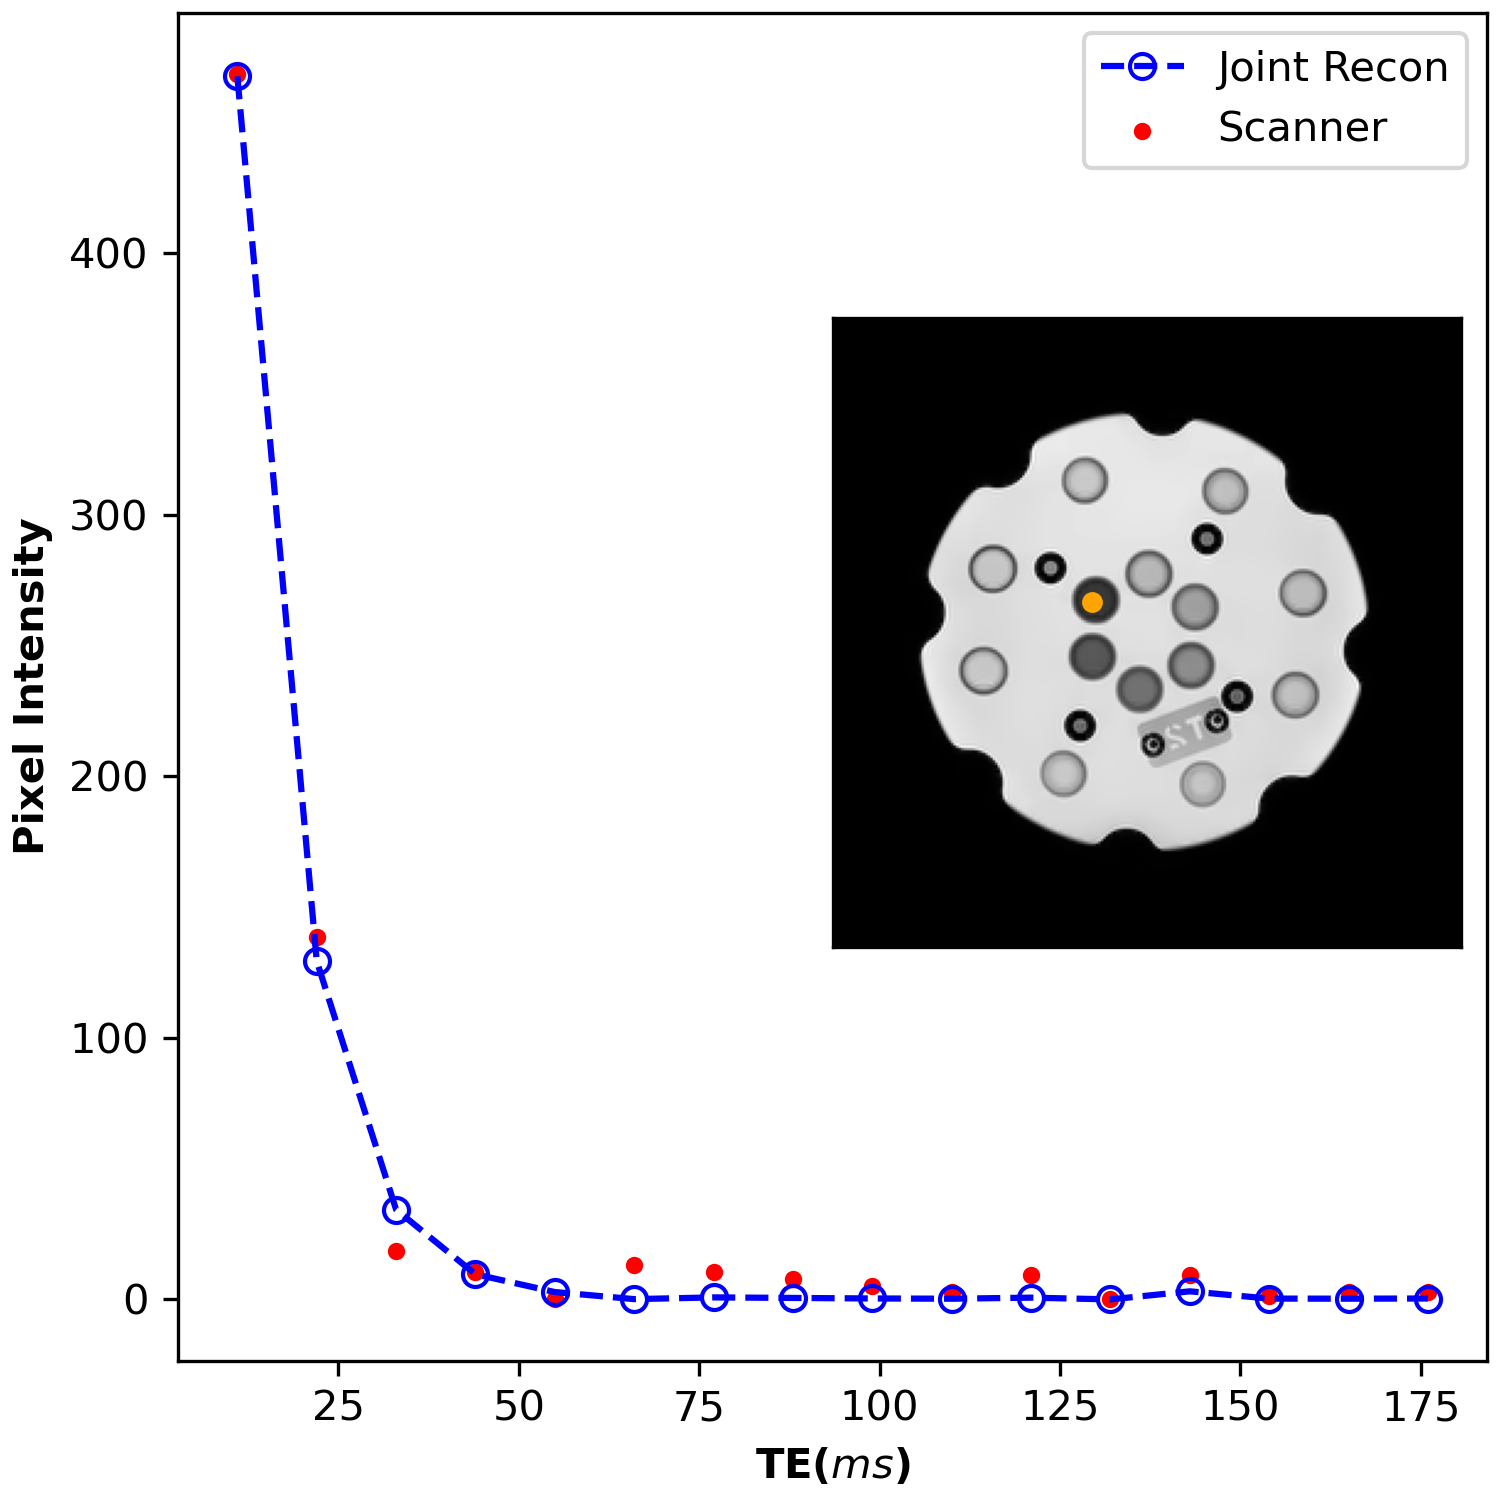
Fig. 3. The signal intensity plot of one pixel with very low T2 on different T2W images, with (blue) and without (red) joint reconstruction. The position of the chosen pixel is marked as orange in the phantom.
DOI: https://doi.org/10.58530/2023/4966