4964
Constrained Reconstruction of White Noise (CROWN) for Strategically Acquired Gradient Echo (STAGE) Imaging1SpinTech MRI, Bingham Farms, MI, United States, 2Radiology, Wayne State University, Detroit, MI, United States, 3Shanghai Jiao Tong University School of Medicine, Ruijin Hospital, Shanghai, China, 4Neurology, Wayne State University, Detroit, MI, United States
Synopsis
Keywords: Image Reconstruction, Quantitative Imaging
By using the inherent relationship between proton spin density (PSD) and T1, we propose a new image-processing approach to reduce noise called CROWN (Constrained Reconstruction of White Noise). Firstly, we established a linear relationship between these two parameters, then applied a cost function to constrain simulated Strategically Acquired Gradient Echo (STAGE) PSD map and T1 map data in the presence of noise. Secondly, we applied this approach to in vivo STAGE images to reduce noise and improve SNR without the loss of image detail. CROWN has the potential to make higher resolution or faster imaging viable with improved SNR.Introduction
There is a natural trade-off between scan time, resolution and signal-to-noise ratio (SNR). Although many filters have been developed to improve the SNR in MRI data, they all lead to some degradation of the image which is recognizable as a remnant blurring relative to the original data. Our goal is to show that, with the appropriate constraints applied to the proton spin density (PSD) and T1 maps, one can obtain enhanced SNR without the loss of detail. We call this approach CROWN which stands for “Constrained Reconstruction of White Noise.” CROWN has been specifically designed for use with multi-flip angle approaches such as strategically acquired gradient echo (STAGE) imaging [1,2].Methods
The basic concept behind CROWN is to use the following relationship between PSD (ρ=1/β) and T1 (1/R1) to constrain the data in a way that reduces noise:$$R1 = a β + b$$
This relationship can be understood in terms of tissue water content, which drives both T1 and PSD values. Often the PSD maps can be quite noisy, especially after correcting for T2*. CROWN has the distinctive property of increasing the SNR in the PSD image. First, we write the following cost function to calculate the estimated point (R1est, βest) from the measured data (R1', β'):
$$C(β, R1) = min((β-β')^2 + (R1 – R1')^2)$$
Second, substituting R1 from Eq. (1) yields:
$$C(β, R1) = min((β-β')^2 + ((aβ + b) - R1')^2)$$
And, finally, taking the derivative of C(β, R1) with respect to β, and setting it equal to zero yields:
$$β_{est} = (β'+ a(R1'-b))/(1+a^2)$$
and
$$R1_{est}=a β_{est}+b$$
These new estimates (R1est, βest) represent the CROWN output. They represent projections of (R1',β') onto (R1,β) and they fall on the line represented by Eq. (1). Practically, the coefficients a and b for Eq. (1) need to be determined. The values used in this work are based on the tissue properties of white matter (WM), gray matter (GM), and cerebrospinal fluid (CSF) at 3T, as derived from the literature [3,4]. For WM, T1=850ms, PSD=0.68, and T2*=53ms. For GM, T1=1611ms, PSD=0.84, and T2*=60ms. For CSF, T1=4500ms, PSD=1, and T2*=2000ms. These three tissues are used to provide three sample points on a plot of R1 versus β and a linear fit used to determine the coefficients a and b by forcing the line to pass through the point representing CSF. For example, for TE = 0ms, i.e., no T2* effects, the linear relation is given by R1 = 2.03/sec β - 1.81/sec. To take T2* effects into account, which was necessary for the in vivo data shown below, values for PSD should be adjusted by the factor E2 = exp(-TE/T2*), and linear regression re-performed using the new coefficients for different TEs.
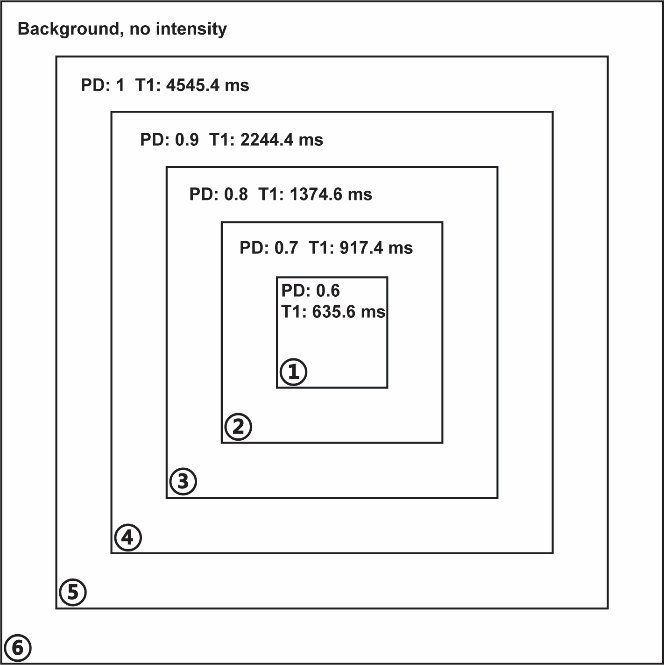
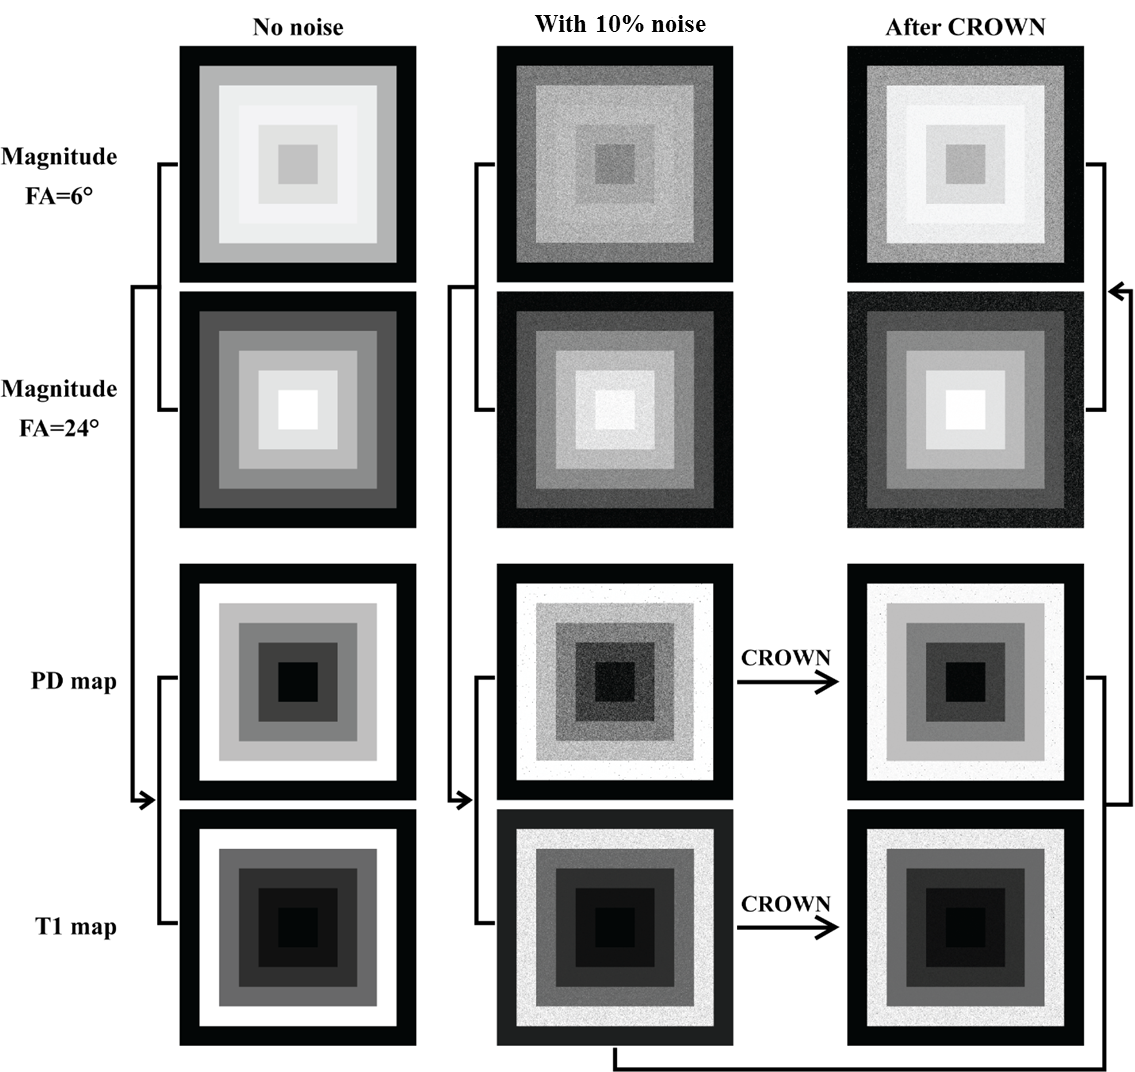
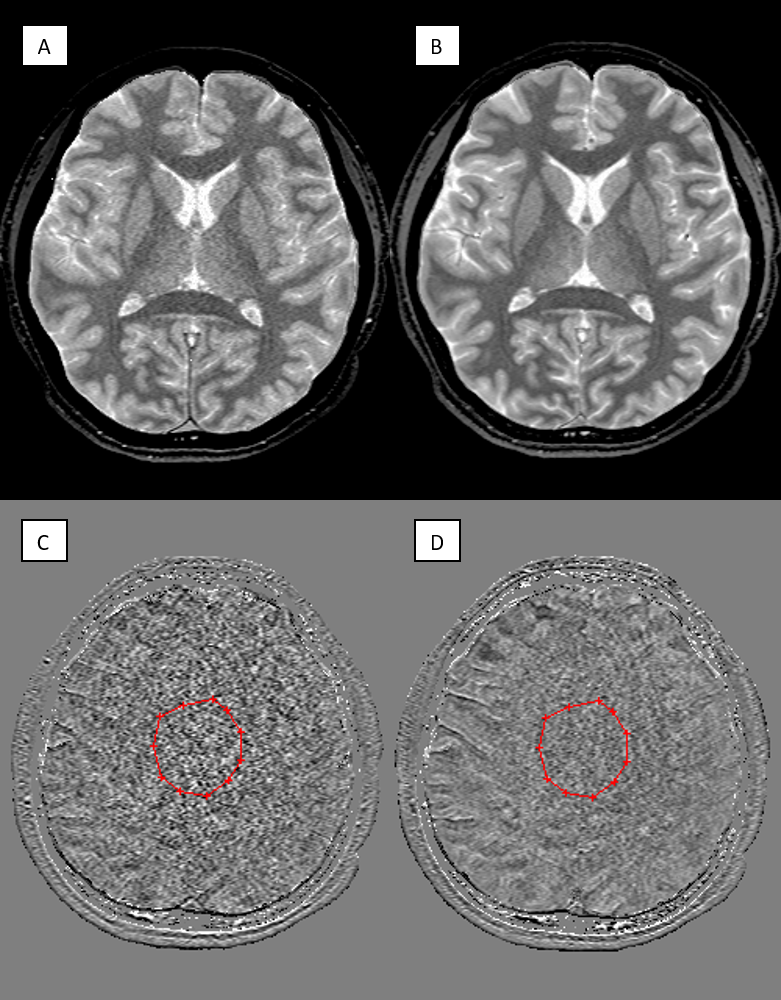
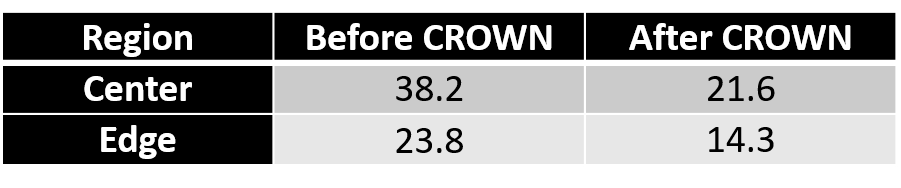
To evaluate the efficacy of CROWN, a test image was built out of a set of embedded squares with each annular-like region representing one tissue type (Figure 1). A TR of 25ms and TE of 0ms were used to generate both 6° and 24° spoiled gradient-echo data. Gaussian noise was set to be 10% of the signal from region 1 of the 6° magnitude image. PSD and T1 maps were generated using STAGE processing [1,2] and then CROWN was applied to reduce the noise. Finally, both 6° and 24° images were simulated using the improved PSD map. Two sets of in vivo STAGE data with identical parameters were collected on a 3T Siemens Prisma scanner (Siemens Healthcare, Erlangen, Germany). The coefficients used for CROWN at TE=5ms were a=1.52 and b=-1.3. If the scanners remain stable between acquisitions, the only difference between the images is background noise. The PSD maps (before and after CROWN) from each acquisition were subtracted and noise was measured at the center and edge of the brain using SPIN software (SpinTech MRI, Inc., Bingham Farms, MI).
Results
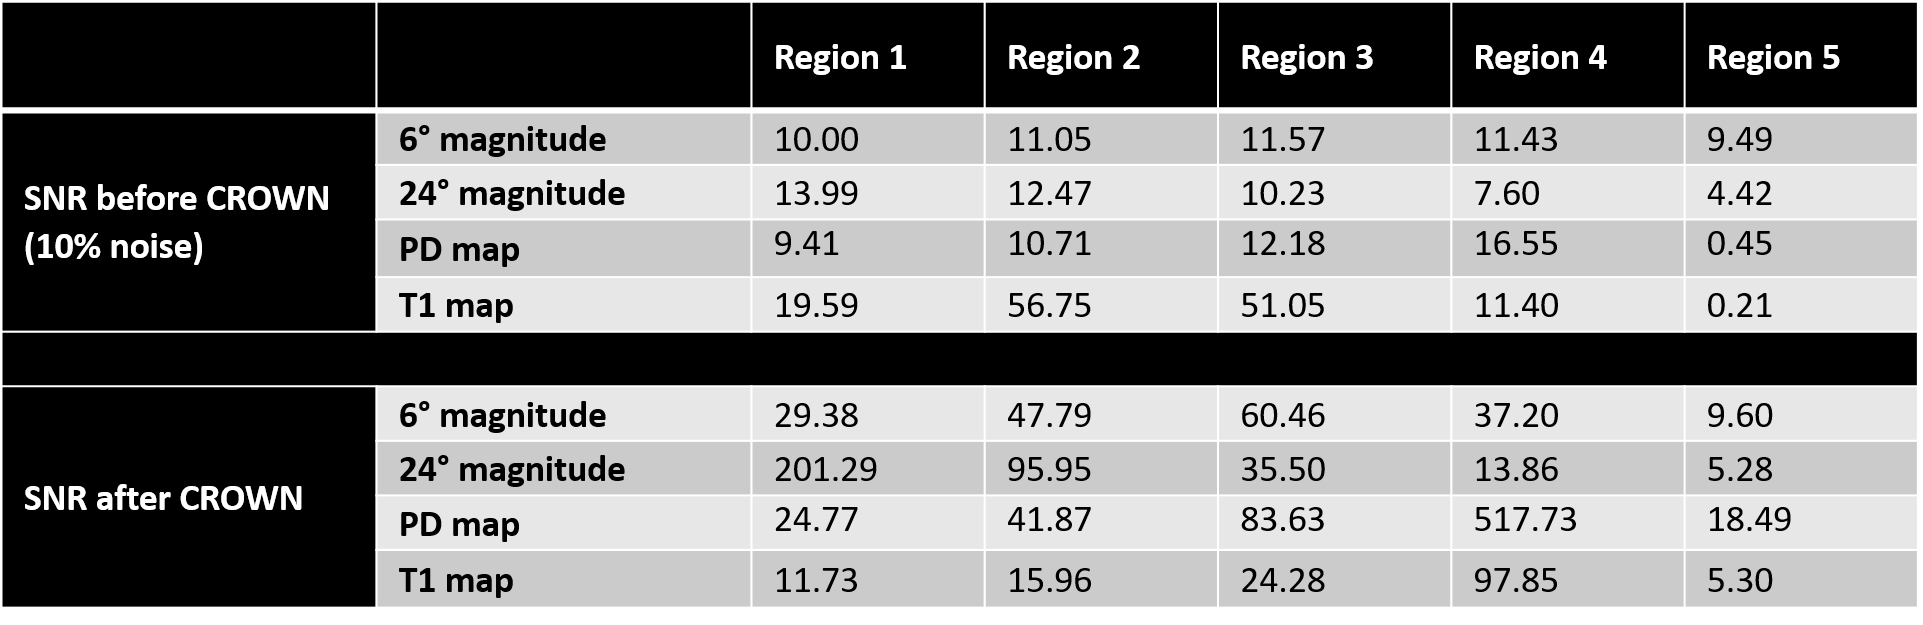
As shown in the simulations (Figure 2) and the real data (Figure 3), the noise was significantly reduced after CROWN processing for the PSD map (see Table 1 for increases in SNR post CROWN for each simulated region). After CROWN processing the SNR increased considerably for all tissues but more so for the short T1 tissues. For the in vivo dataset, CROWN reduced the noise in the PSD map by a factor of 1.77 at the center of the brain where receive coil sensitivity is generally the poorest and 1.66 at the edge of the brain (Table 2).Discussion and Conclusions
CROWN offers a powerful new means to improve SNR without modifying or blurring the image structures as is the case in most other methods that purport to improve SNR. CROWN can lead to improved SNR not only in the original PSD estimates but also in forward simulated MRI images. The major limitations of CROWN are: the validity of the relationship between R1 and the spin density; only PSD images are improved, and the method only works when PSD and T1 maps are available. CROWN may have an immediate impact on improving SNR for data collected with high parallel imaging acceleration factors, high resolution imaging, or when the data are collected with radiofrequency receive coils with a small number of channels.Acknowledgements
No acknowledgement found.References
1. Chen, Y., Liu, S., Wang, Y., et al., STrategically Acquired Gradient Echo (STAGE) imaging, part I: Creating enhanced T1 contrast and standardized susceptibility weighted imaging and quantitative susceptibility mapping. Magn Reson Imaging, 2018. 46: p. 130-139.
2. Wang, Y., Chen, Y., Wu, D., et al., STrategically Acquired Gradient Echo (STAGE) imaging, part II: Correcting for RF inhomogeneities in estimating T1 and proton density. Magn Reson Imaging, 2018. 46: p. 140-150.
3. Wright, P.J., et al., Water proton T1 measurements in brain tissue at 7, 3, and 1.5 T using IR-EPI, IR-TSE, and MPRAGE: results and optimization. MAGMA, 2008. 21(1-2): p. 121-30.
4. Dieringer, M.A., et al., Rapid parametric mapping of the longitudinal relaxation time T1 using two-dimensional variable flip angle magnetic resonance imaging at 1.5 Tesla, 3 Tesla, and 7 Tesla. PLoS One, 2014. 9(3): p. e91318.
Figures