4962
Fast $$$T_{2}^{*}$$$ and QSM using locally low rank methods for complex-valued, multi-echo GRE reconstruction1Electrical and Computer Engineering, The University of Arizona, Tucson, AZ, United States, 2Biomedical Engineering, The University of Arizona, Tucson, AZ, United States, 3Medical Imaging, The University of Arizona, Tucson, AZ, United States, 4Radiology, UMass Chan Medical School, Worcester, MA, United States, 5Neuroscience, Morningside Graduate School of Biomedical Sciences, Worcester, MA, United States
Synopsis
Keywords: Image Reconstruction, Brain
$$$T_{2}^{*}$$$ and quantitative susceptibility mapping are of increasing clinical interest, but typically require lengthy ME-GRE scans. To accelerate such acquisitions, we propose and implement a volumetric reconstruction method employing locally low rank (LLR) techniques to recover complex-valued ME images from highly undersampled k-space data that is suitable for parameter mapping. We present results for reconstructed magnitude and phase across multiple datasets and acceleration ratios, as well as computed $$$R_{2}^{*}$$$ and QSM from reconstructed images.Introduction
$$$T_{2}^{*}$$$ mapping and quantitative susceptibility mapping (QSM) are increasingly employed clinically for diagnostic use. Examples include analysis of iron deposition in brain tissue as a potential indicator of Parkinson's disease [1][2], hemorrhage detection [3][4], and identification of age-related biomarkers of neurodegeneration [5][6][7]. Generation of these parameter maps typically requires three-dimensional (3D) multi-echo gradient-recalled echo (ME GRE) MRI acquisitions, which can be lengthy. Acquisitions that reduce scan times while preserving reconstruction quality are therefore of significant value. Locally low-rank (LLR) reconstruction methods [8][9], which exploit redundancy within local spatial patches of images to promote sparsity and constrain the solution space, have demonstrated promise in reconstructing images from undersampled k-space data. In this work, we propose a novel volumetric, multi-echo, complex-valued reconstruction method exploiting the low-rank properties of ME GRE magnitude and phase. An explicitly parameterized temporal signal model is first developed to promote low-rank behavior in magnitude reconstruction. We then develop and demonstrate a novel POCS [10] phase reconstruction incorporating multiple informed constraints.Methods
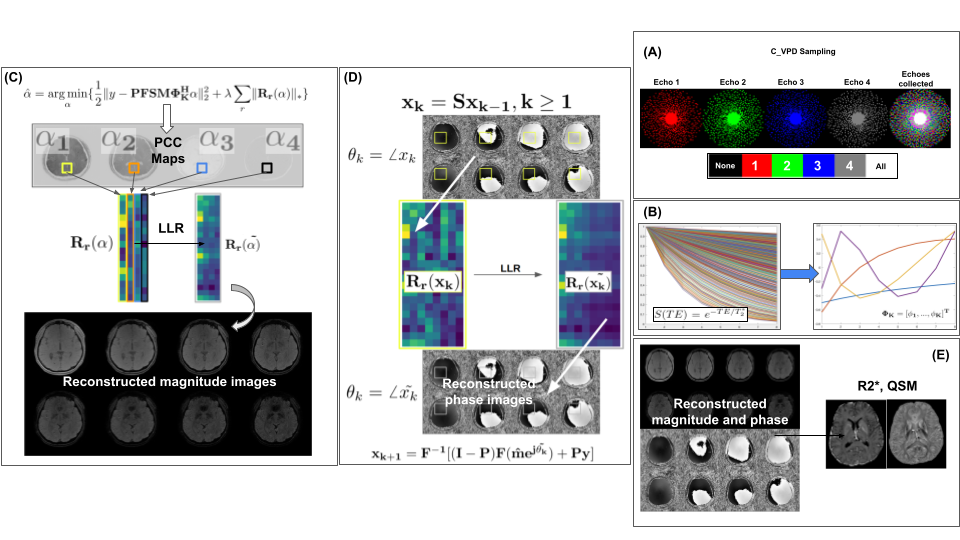
The magnitude reconstruction objective is given by:$$\hat{\alpha} = arg min_{\alpha}\{ \frac{1}{2} \lVert y - \mathbf{P F S M \Phi}_{K}^{H} \alpha \rVert_{2}^{2} + \lambda \sum_{r} \lVert \mathbf{R_{r}}(\alpha) \rVert_{*} \}$$
where $$$\alpha$$$ are principal component coefficient (PCC) maps; $$$\mathbf{\Phi}_{K}^{H}$$$ is a truncated subspace basis of order $$$K<=n_{echoes}$$$; $$$\mathbf{M}$$$ is a complex exponential term corresponding to low-resolution phase estimated from the fully collected central k-space region; $$$\mathbf{S}$$$ denotes the coil sensitivity operator; $$$\mathbf{F}$$$ is the forward Fourier operator; $$$\mathbf{P}$$$ is the k-space sampling operator; $$$\mathbf{\lambda}$$$ is the LLR regularization parameter; $$$\vert \vert ... \vert \vert_{*}$$$ denotes the matrix nuclear norm; $$$\mathbf{R_{r}}(\alpha)$$$ is the forward Casorati operator on local PCC blocks at spatial index $$$\mathbf{r}$$$. Sampling was performed using complementary variable density Poisson Disc (C-VPD) sampling [11] as illustrated in Figure 1(a). To create the magnitude basis, simulated temporal signals were generated according to the monoexponential decay model $$$S(TE) = S_{0}e^{-\frac{TE}{T_{2}^{*}}}$$$, with $$$T_{2}^{*} $$$ ~ $$$\mathbf{U}$$$[1ms,1000ms] (Figure 1(b)). Principal Component Analysis (PCA) was performed on the ensemble of simulated signals to obtain an orthonormal basis ; $$$K=4$$$ principal components were chosen to form the truncated basis. Magnitude reconstruction was performed iteratively with ADMM [12] (Figure 1(c)). $$$T_{2}^{*}$$$ maps were subsequently generated with ARLO [13]. Phase images were reconstructed using a novel POCS-based scheme. Coupled with the reconstructed magnitudes $$$\hat{m} = \mathbf{\Phi}_{K}^{H}\hat{\alpha}$$$, the complex-valued echo images used in the phase reconstruction were initialized using zero-filled phase $$$\theta_{0}$$$ from the undersampled k-space: $$$x_{0} = \hat{m}e^{j\theta_{0}}$$$. Spatial consistency was enforced via the application of the sensitivity maps: $$$x_{k} = \mathbf{S}x_{k-1}$$$. The Casorati operator $$$\mathbf{R}_r$$$ was applied at each spatial index $$$r$$$ and singular value decomposition (SVD) was performed as shown in Figure 1(d): $$[u_{k,r},s_{k,r},v_{k,r}] = SVD[\mathbf{R}_{r}(x_{k})]$$ The singular values $$$s_{k,r}$$$ were soft-thresholded and the data was reprojected and reshaped into an array at spatial location $$$r$$$ via the backwards Casorati operator $$$\mathbf{R}_{r}^{T}$$$: $$\tilde{x}_{k,r} = \mathbf{R}_{r}^{T}(u_{k,r}\sigma_{\mu}(s_{k,r})v_{k,r})$$ where $$$\sigma_{\mu}$$$ denotes the soft-thresholding function. Phase was updated as $$$\theta_{k} = angle(\tilde{x}_{k})$$$ and consistency with both the acquired k-space values and the reconstructed magnitudes was enforced: $$x_{k} = F^{-1}[(\mathbf{I} -\mathbf{P})F(\hat{m}e^{j\theta_{k}}) + \mathbf{P}y]$$ where $$$\mathbf{I-P}$$$ is the elementwise complement of the k-space sampling mask. The raw phase maps were unwrapped using Laplacian-based phase unwrapping [14], local field maps were computed using V-SHARP normalized background phase removal [15], and QSM was performed using STAR QSM [16]. Normalized root mean square errors (NRMSE) were computed for each reconstruction result $$$\mathbf{x}_{recon}$$$: $$NRMSE(\mathbf{x}_{recon}) = \frac{1}{max(\mathbf{x}_{truth}) - min(\mathbf{x}_{truth})} \sqrt{\Sigma_{i}(\mathbf{x}_{recon}(i) - \mathbf{x}_{truth}(i))^2}$$ Five ME GRE datasets were used; four from a previous QSM study [17], and one new collection from a healthy subject on a 3T Siemens Skyra scanner with prior informed consent.
Results
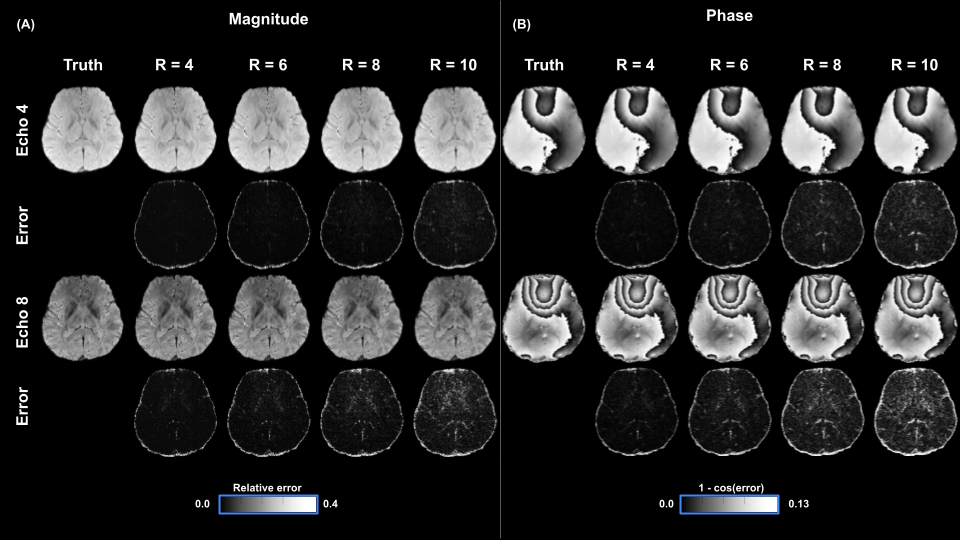
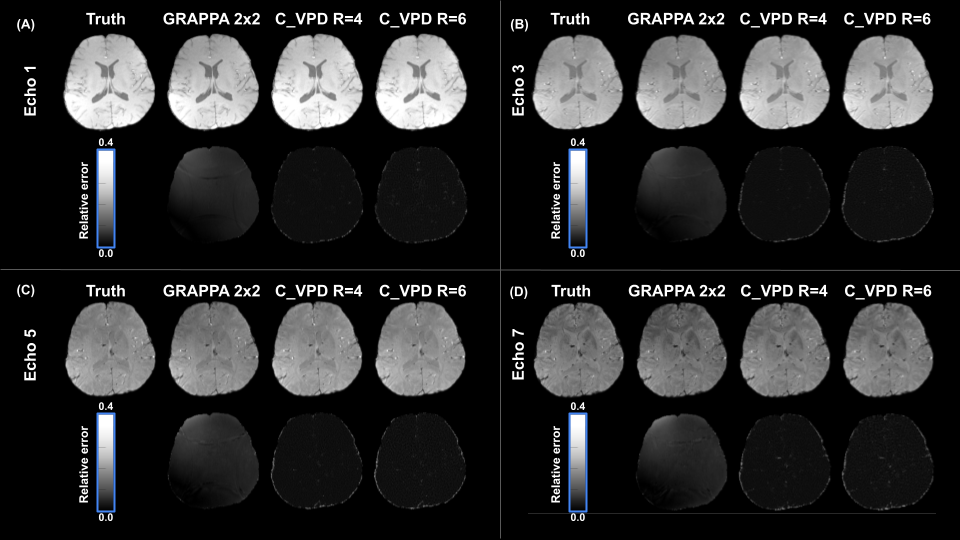
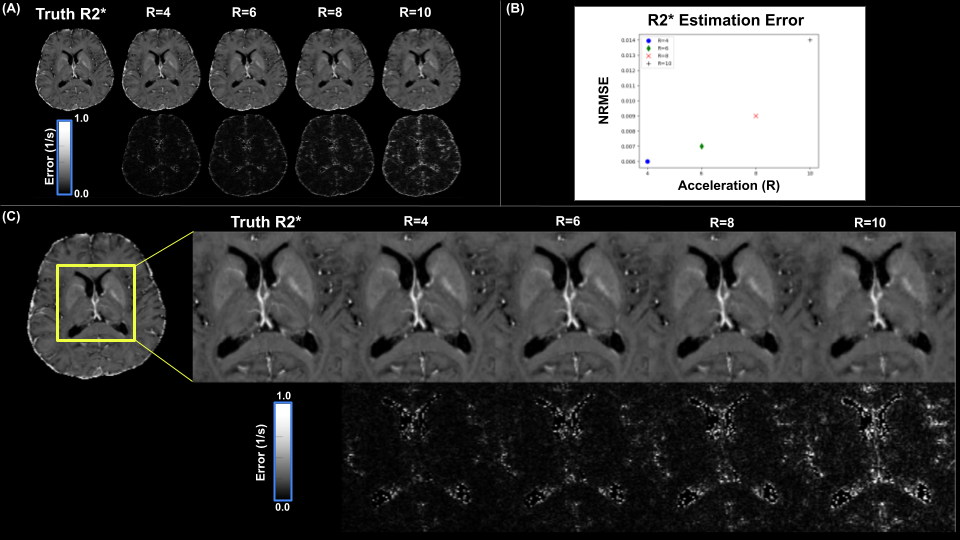
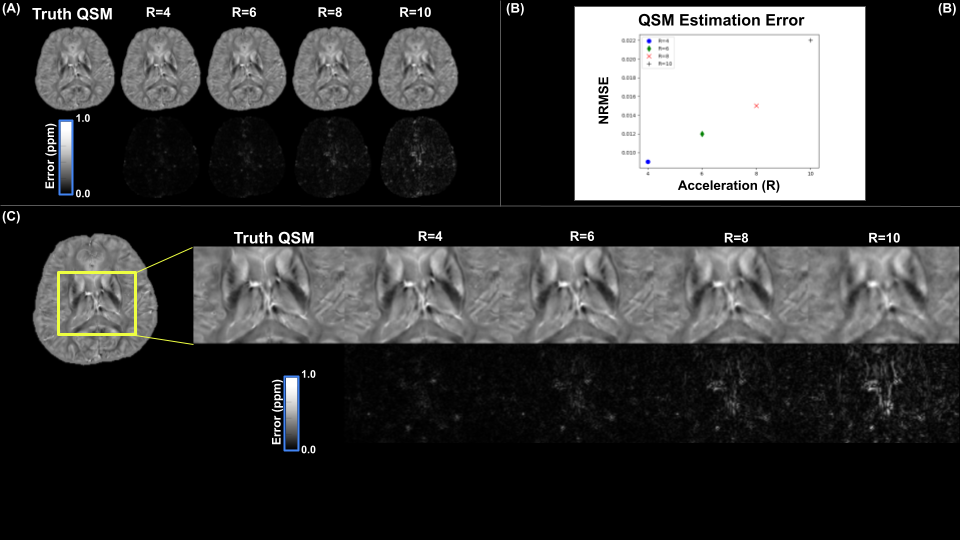
Figure 2(a-b) shows reconstructed magnitude and phase images on a single mid-axial slice for two echoes using C-VPD sampling with corresponding error maps for R values of 4,6,8, and 10. Normalized root mean square errors (NRMSE) across acceleration ratios were 0.007,0.009,0.013,0.026/0.073,0.10,0.150,0.21 for magnitude/phase (with cosine distance error used for phase). Figure 3(a-d) shows magnitude results for R = 4 and 6 against a 2x2 GRAPPA reconstruction with corresponding errors. Figure 4(a) illustrates $$$R_{2}^{*}$$$ results derived from reconstructed images with NRMSE values of 0.006,0.007,0.009,0.014 for R=4,6,8,10 (Figure 4(b)). Figure 5(a) shows QSM from reconstructed phase maps using acceleration ratios of R=4,6,8,10 resulting in NRMSE values of 0.009,0.012,0.015,0.022 (Figure 5(b)). Figures 4(c) and 5(c) show QSM and $$$R_{2}^{*}$$$ results for a magnified region of interest surrounding the thalamus.Discussion
The LLR reconstruction method capably reconstructed images, even at higher R values, particularly in magnitude. Fine detail is preserved in the magnitude images, though there is a sharp drop in quality past R = 8. While GRAPPA 2x2 showed aliasing artifacts in the magnitude error maps, the LLR method using C-VPD at an equivalent or even higher R values showed no comparable large-scale error patterns. LLR with C-VPD shows excellent correspondence with truth in R2* and QSM, though there is some blurring in the maps at higher R values.Conclusion
We have successfully developed and implemented a volumetric, complex-valued, multi-echo LLR reconstruction. Reconstructed images and derived parameter maps are highly accurate but exhibit some degradation at higher R values.Acknowledgements
No acknowledgements.References
1. He et al., “Dentate Nucleus Iron Deposition Is a Potential Biomarker for Tremor-Dominant Parkinson’s Disease.”
2. Chen et al., “Iron Deposition in Parkinson’s Disease by Quantitative Susceptibility Mapping.”
3. “Histopathologic Analysis of Foci of Signal Loss on Gradient-Echo T2*-Weighted MR Images in Patients with Spontaneous Intracerebral Hemorrhage: Evidence of Microangiopathy-Related Microbleeds | American Journal of Neuroradiology.”
4. Zia et al., “Characterizing Myocardial Edema and Hemorrhage Using Quantitative T2 and T2* Mapping at Multiple Time Intervals Post ST-Segment Elevation Myocardial Infarction.”
5. McNeill et al., “T2* and FSE MRI Distinguishes Four Subtypes of Neurodegeneration with Brain Iron Accumulation.”
6. Aquino et al., “Age-Related Iron Deposition in the Basal Ganglia.”
7. Callaghan et al., “Widespread Age-Related Differences in the Human Brain Microstructure Revealed by Quantitative Magnetic Resonance Imaging.”
8. Huang et al., “T2 Mapping from Highly Undersampled Data by Reconstruction of Principal Component Coefficient Maps Using Compressed Sensing.”
9. Tamir, Jonathan I., et al. "T2 shuffling: sharp, multicontrast, volumetric fast spin‐echo imaging." Magnetic resonance in medicine 77.1 (2017): 180-195.
10. Zhang, Tao, John M. Pauly, and Ives R. Levesque. "Accelerating parameter mapping with a locally low rank constraint." Magnetic resonance in medicine 73.2 (2015): 655-661.
11. Levine et al., “3D Cartesian MRI with Compressed Sensing and Variable View Sharing Using Complementary Poisson-Disc Sampling.”
12. Boyd et al., “Distributed Optimization and Statistical Learning via the Alternating Direction Method of Multipliers.”
13. Pei et al., “Algorithm for Fast Monoexponential Fitting Based on Auto-Regression on Linear Operations (ARLO) of Data.”
14. Li et al., “Integrated Laplacian-Based Phase Unwrapping and Background Phase Removal for Quantitative Susceptibility Mapping.”
15. Özbay et al., “A Comprehensive Numerical Analysis of Background Phase Correction with V-SHARP.”
16. Wei et al., “Streaking Artifact Reduction for Quantitative Susceptibility Mapping of Sources with Large Dynamic Range.”
17. Wang, Yi, and Tian Liu. "Quantitative susceptibility mapping (QSM): decoding MRI data for a tissue magnetic biomarker." Magnetic resonance in medicine 73.1 (2015): 82-101.
Figures