4957
Feasibility study of a simulTaneous multi-relaXation-time Imaging (TXI) method in Intervertebral Disc1Department of Radiology, Zigong First People's Hospital, Zigong, China, 2Sichuan Vocational College of Health and Rehabilitation, Zigong, China, 3MR Scientific Marketing, Siemens Healthineers, Shanghai, China, 4Shanghai Key Laboratory of Magnetic Resonance, East China Normal University, Shanghai, China
Synopsis
Keywords: Image Reconstruction, MSK
Quantitative imaging of intervertebral disc degeneration is important for the diagnosis of lower back pain. In our study, a simulTaneous multi-relaXation-time Imaging (TXI) method was evaluated, which generated bone marrow fat fraction (PDFF), R2* and R1 mapping within a single scan. The results showed that the BMFF, T2*, T1 mapping calculated from TXI method were close to the values reported in other studies for lumbar discs.Introduction
Lower back pain(LBP) is a common health problem that has been shown to be related to intervertebral disc (IVD) degeneration1. MRI is a useful tool to characterize IVD degeneration due to its excellent spinal soft-tissue contrast. T2* mapping allows assessment of the ultrastructural tissue composition of the IVD by providing information regarding the spatial architecture of the macromolecules and the mobility of water molecules2, and it correlates with functional lumbar mechanics3. T1 mapping has been widely used in cartilage degeneration4 and has been shown to be correlated to the water content5. Additional studies have confirmed that significant associations between bone marrow fat fraction (BMFF) and T1ρ/T2 mapping in the adjacent IVD and suggest that the conversion of hematopoietic bone marrow to fatty bone marrow impairs the supply of available nutrients to cells in the IVD and may thereby accelerate disc degeneration6. While these techniques need scan independently, which take more acquisition time and the joint analysis of multiple sequences have great challenge due to image registration. To accelerate the acquisition and improve joint analysis accuracy, a simultaneous multi-relaxation-time Imaging (TXI) method was introduced to simultaneously calculate BMFF, T2* and T1 values. The aim of this study was to explore the feasibility of TXI method in healthy subjects’ IVD and to research an interplay between the IVD and the adjacent bone marrow.Materials and Methods
MR imaging: Five healthy volunteers were recruited and underwent MR imaging on a 3T MRI scanner (MAGNETOM VIDA, Siemens Healthcare, Erlangen, Germany). The acquisition of TXI method contains two multi-point quantitative Dixon (qDixon) sequence with two different flip angles and B1 mapping scan. The qDixon sequence was scanned with the following parameters: TR = 12.4 ms, TE1/TE6/𝜟TE = 1.07/10.12/1.81ms, FA1 = 4° and FA2 = 22° , FOV = 380 × 336 mm2, matrix size = 224 ×177, pixel bandwidth = 260Hz/pixel, in-plane resolution = 1 × 1mm2 , slice thickness = 3mm, number of slices=48. Prior to the T1 mapping, a 9 second B1 mapping was acquired using a double-angle method with a nonselective preparation pulse (flip angles of 33° and 66°) followed by a fast spin-echo readout (ETL =7).Quantification Algorithm: The algorithm of TXI method contains 4 steps: 1) water, fat signal and T2* map at 4˚ flip-angle were calculated by the T2*-IDEAL algorithm, based on a single T2* and 9-peak fat model, with the inhomogeneity magnetic field initialized by Spurs-gc algorithm7; 2) BMFF was calculated by dividing fat signal by total signal (fat+water). 3) The additional B1 map was used for correction, which was interpolated to the same size of water signals images; 4) In order to avoid severe T2* dephasing effects at longer TEs, only the first echo in qDixon were used for T1 mapping processing. The water signals at 2 flip angles and the interpolated B1 map were then used to calculate T1 map using equation S(FA) = water(FAb1) × sin(FA b1) × (1 – exp(-TR/T1) / (1 – cos(FA b1) × exp(-TR/T1))8, where FA b1 was flip angle corrected by B1 map. The algorithm was implemented in Matlab 2018b and Python 3.5.
Image analysis: Region of interests (ROIs) were manually defined in covering the entire IVD to calculate the T2* and T1 value, and entire vertebra to calculate BMFF. Three subregions in each of the lumbar IVD were drawn: the anterior 1/5 part representing the anterior annulus fibrosus (AAF), the medial 3/5 part representing nucleus pulposus (NP), and the posterior 1/5 part representing the posterior annulus fibrosus (PAF) region.
Statistical Analysis: The mean T1 values in each subregion from each IVD were calculated and compared between acquisitions with and without the B1 correction using the independent samples t-test, with a significant level set to p<0.05. All analyses were done using SPSS software (version 25.0).
Results
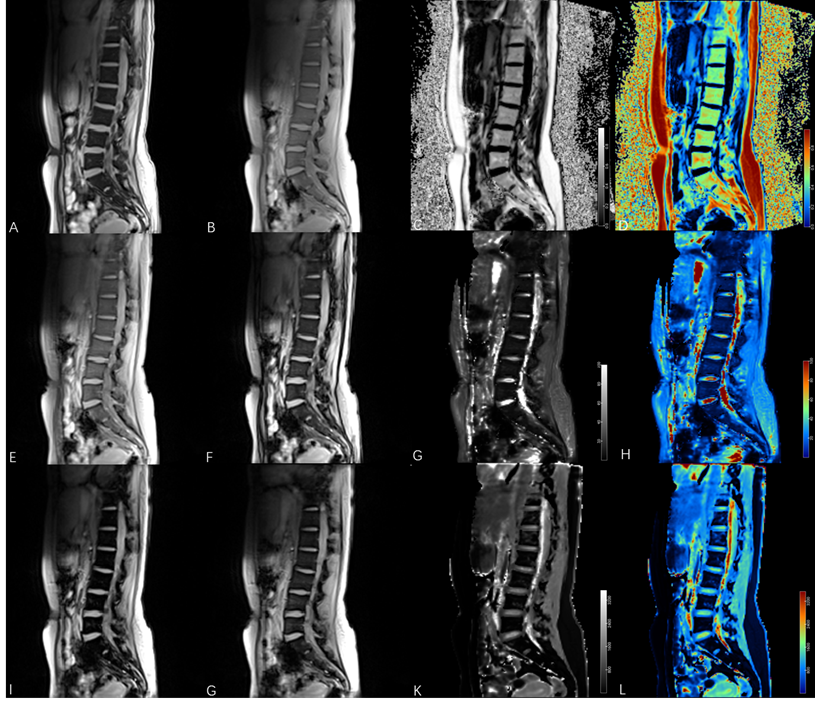
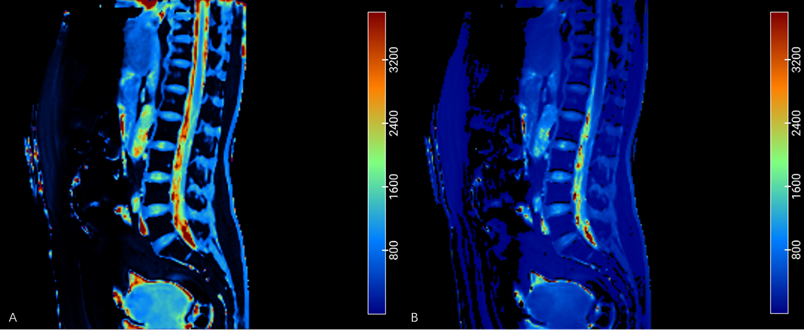
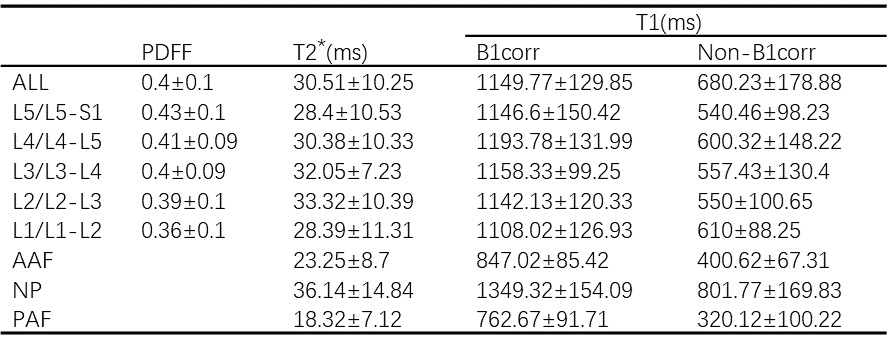
Simultaneously T1, T2*, BMFF mapping by TXI method exhibited good signal-noise-ratio and artifact-free images (Figure 1). A clear visualization of the fat distribution in the vertebral body, including the lumbar vertebrae and some of the thoracic vertebrae. The annulus fibrosus (AF) and NP of each individual IVDs from L1/L2 to L5/S1 were clear displayed on T1, T2* mapping. Significant difference between T1 mappings with and without B1 correction could be discerned via visual inspection(p = 0.02)(Figure 2), where both the AF/NP and cerebrospinal fluid were more homogeneously displayed on images acquired with B1 correction. Table 1 shows the mean BMFF, T2*, T1values for the entire vertebrae, IVD, and the subregions of the IVD (AAP, NP, PAF). A significant increase in BMFF was found from L1 to L5.Discussion & Conclusion
In this study, we demonstrated the feasibility of TXI method for quantifying lumbar discs by calculating the quantification images, including BMFF, T2*, T1 mapping, which were close to the values reported in the other studies2-6. Few studies has yet combined the BMFF, T2*, T1 mapping to quantify IVD disease by the disc water content, molecular interactions, and spatial structural changes in macromolecules9. In conclusion, TXI method can achieve quantitative analysis of vertebrae and intervertebral discs, which played an important role in the study of degenerative disc disease.Acknowledgements
No acknowledgement found.References
1. Luoma K, Riihimaki H, Luukkonen R, et al. Low back pain in relation to lumbar disc degeneration. Spine. 2000;25:487-92.
2. Chiu EJ, Newitt DC, Segal MR, et al. Magnetic resonance imaging measurement of relaxation and water diffusion in the human lumbar intervertebral disc under compression in vitro. Spine. 2001;26:E437-44.
3. Deoni SCL, Rutt BK, Peters TM. Rapid combined T1 and T2 mapping using gradient recalled acquisition in the steady state. Magn Reson Med. 2003;49:515–526.
4. Fram E, Herfkens R, Johnson G, et al. Rapid calculation of T1 using variable flip angle gradient refocused imaging. Magn Reson Imaging. 1987;5:201–208.
5. Xiang L, Yu X, Rong L, et al. Q-Dixon and GRAPPATINI T2 Mapping Parameters: A Whole Spinal Assessment of the Relationship Between Osteoporosis and Intervertebral Disc Degeneration. J Magn Reson Imaging. 2022; 55(5):1536-1546.
6. Galley J, Maestretti G, Koch G, el al. Real T1 relaxation time measurement and diurnal variation analysis of intervertebral discs in a healthy population of 50 volunteers. Eur J Radiol. 2017; 87:13-19.
7. Dong J, Liu T, Chen F, et al. Simultaneous phase unwrapping and removal of chemical shift (SPURS) using graph cuts: application in quantitative susceptibility mapping. IEEE Trans Med Imaging 2015;34:531-540.
8. Fram E, Herfkens R, Johnson G, et al. Rapid calculation of T1 using variable flip angle gradient refocused imaging. Magn Reson Imaging. 1987;5:201–208.
9. Nora B, Cyrille D, Jean-Baptiste H, et al. Comparison of MRI T1, T2, and T2* mapping with histology for assessment of intervertebral disc degeneration in an ovine model. Sci Rep. 2022;12(1):5398-5444.
Figures