4956
Statistical Approach to Single-Point Water-Fat Imaging with Independent Component Analysis (ICA)1Radiology, University of British Columbia, Vancouver, BC, Canada
Synopsis
Keywords: Image Reconstruction, Image Reconstruction, water-fat imaging
Water-Fat Imaging with only a single acquisition is desirable for its pulse sequence simplicity and scan time efficiency. However, robust reconstruction is more challenging due to limited available information. In this work, it is discovered that some previously unused information can be found by statistical analysis, leading to effective reconstruction of water and fat images. In particular, Independent Component Analysis (ICA) was used to determine the phase error. Well separated water and fat images were subsequently obtained after phase correction.Introduction
Since its initial proposal by Dixon1, Water-Fat Imaging (WFI) has gone a long way into practical applications2. Typically, WFI is performed with two or more acquisitions, known as “2-point” , “3-point” or “multi-point” WFI to obtain more information for robust reconstruction of water and fat images, although the possibility of “single-point WFI” with only one acquisition was proposed right after Dixon’s original work3,4. The challenge behind 1-point WFI is its lack of information for proper phase correction5-8 without having additional signal acquisition. In this work, it is found that Independent Component Analysis (ICA)9 can be used to uncover previously unused information for enhanced reconstruction, resulting in well separated water and fat images from only a single acquisition.Methods
Theory:The complex image from a 1-point WFI acquisition can be expressed as,
$$C=(W+iF)P\;\;\;\;\;\;\;\;\;\;\;\;\;\;\;\;\;\;\;\;\;\;\;\;\;\;\;(1)$$
where the water (W) and fat (F) images are acquired in quadrature, namely 90° out of phase, by a proper offset of echo time TE; $$$P=exp(iΦ)$$$ is a phasor representing the phase error due to main magnetic field inhomogeneity etc.
If P is known, it can be simply removed from Equation (1), then the orthogonal real and imaginary channels R & I of the resulting complex image will be the two component images W & F respectively; otherwise, each channel will in general contain a mixture of the two components. So, the challenge of achieving water-fat separation is to find the correct error phasor P.
Independent Component Analysis (ICA)9 is a powerful statistical tool with which mixed components such as signal and artifacts (or noise) can be impressively separated by minimizing a key quantity known as Mutual Information (MI). As another application of ICA, here W & F images are separated from the mixed complex image acquired.
In this work, various phase correction values were applied while the quantity MI9 between the resulting R & I images were computed. It was found that MI is minimized when R & I represent the correct W & F images. This way, a minimization of MI by tuning P will enable the error phasor to be found. Such tuning procedure can be applied regionally if the phase error is spatially varying.
Experiments:
Complex images were acquired from human subjects on 1.5T clinical scanners using spin-echo sequences. The angle between W and F components were chosen to be (0°, 90°, 180°). Decent Water and Fat images were reconstructed from the full dataset with 3 acquisitions2. These images were used as gold standard for comparison. The middle quadrature dataset acquired at 90° only was used to test the proposed ICA method.
Results
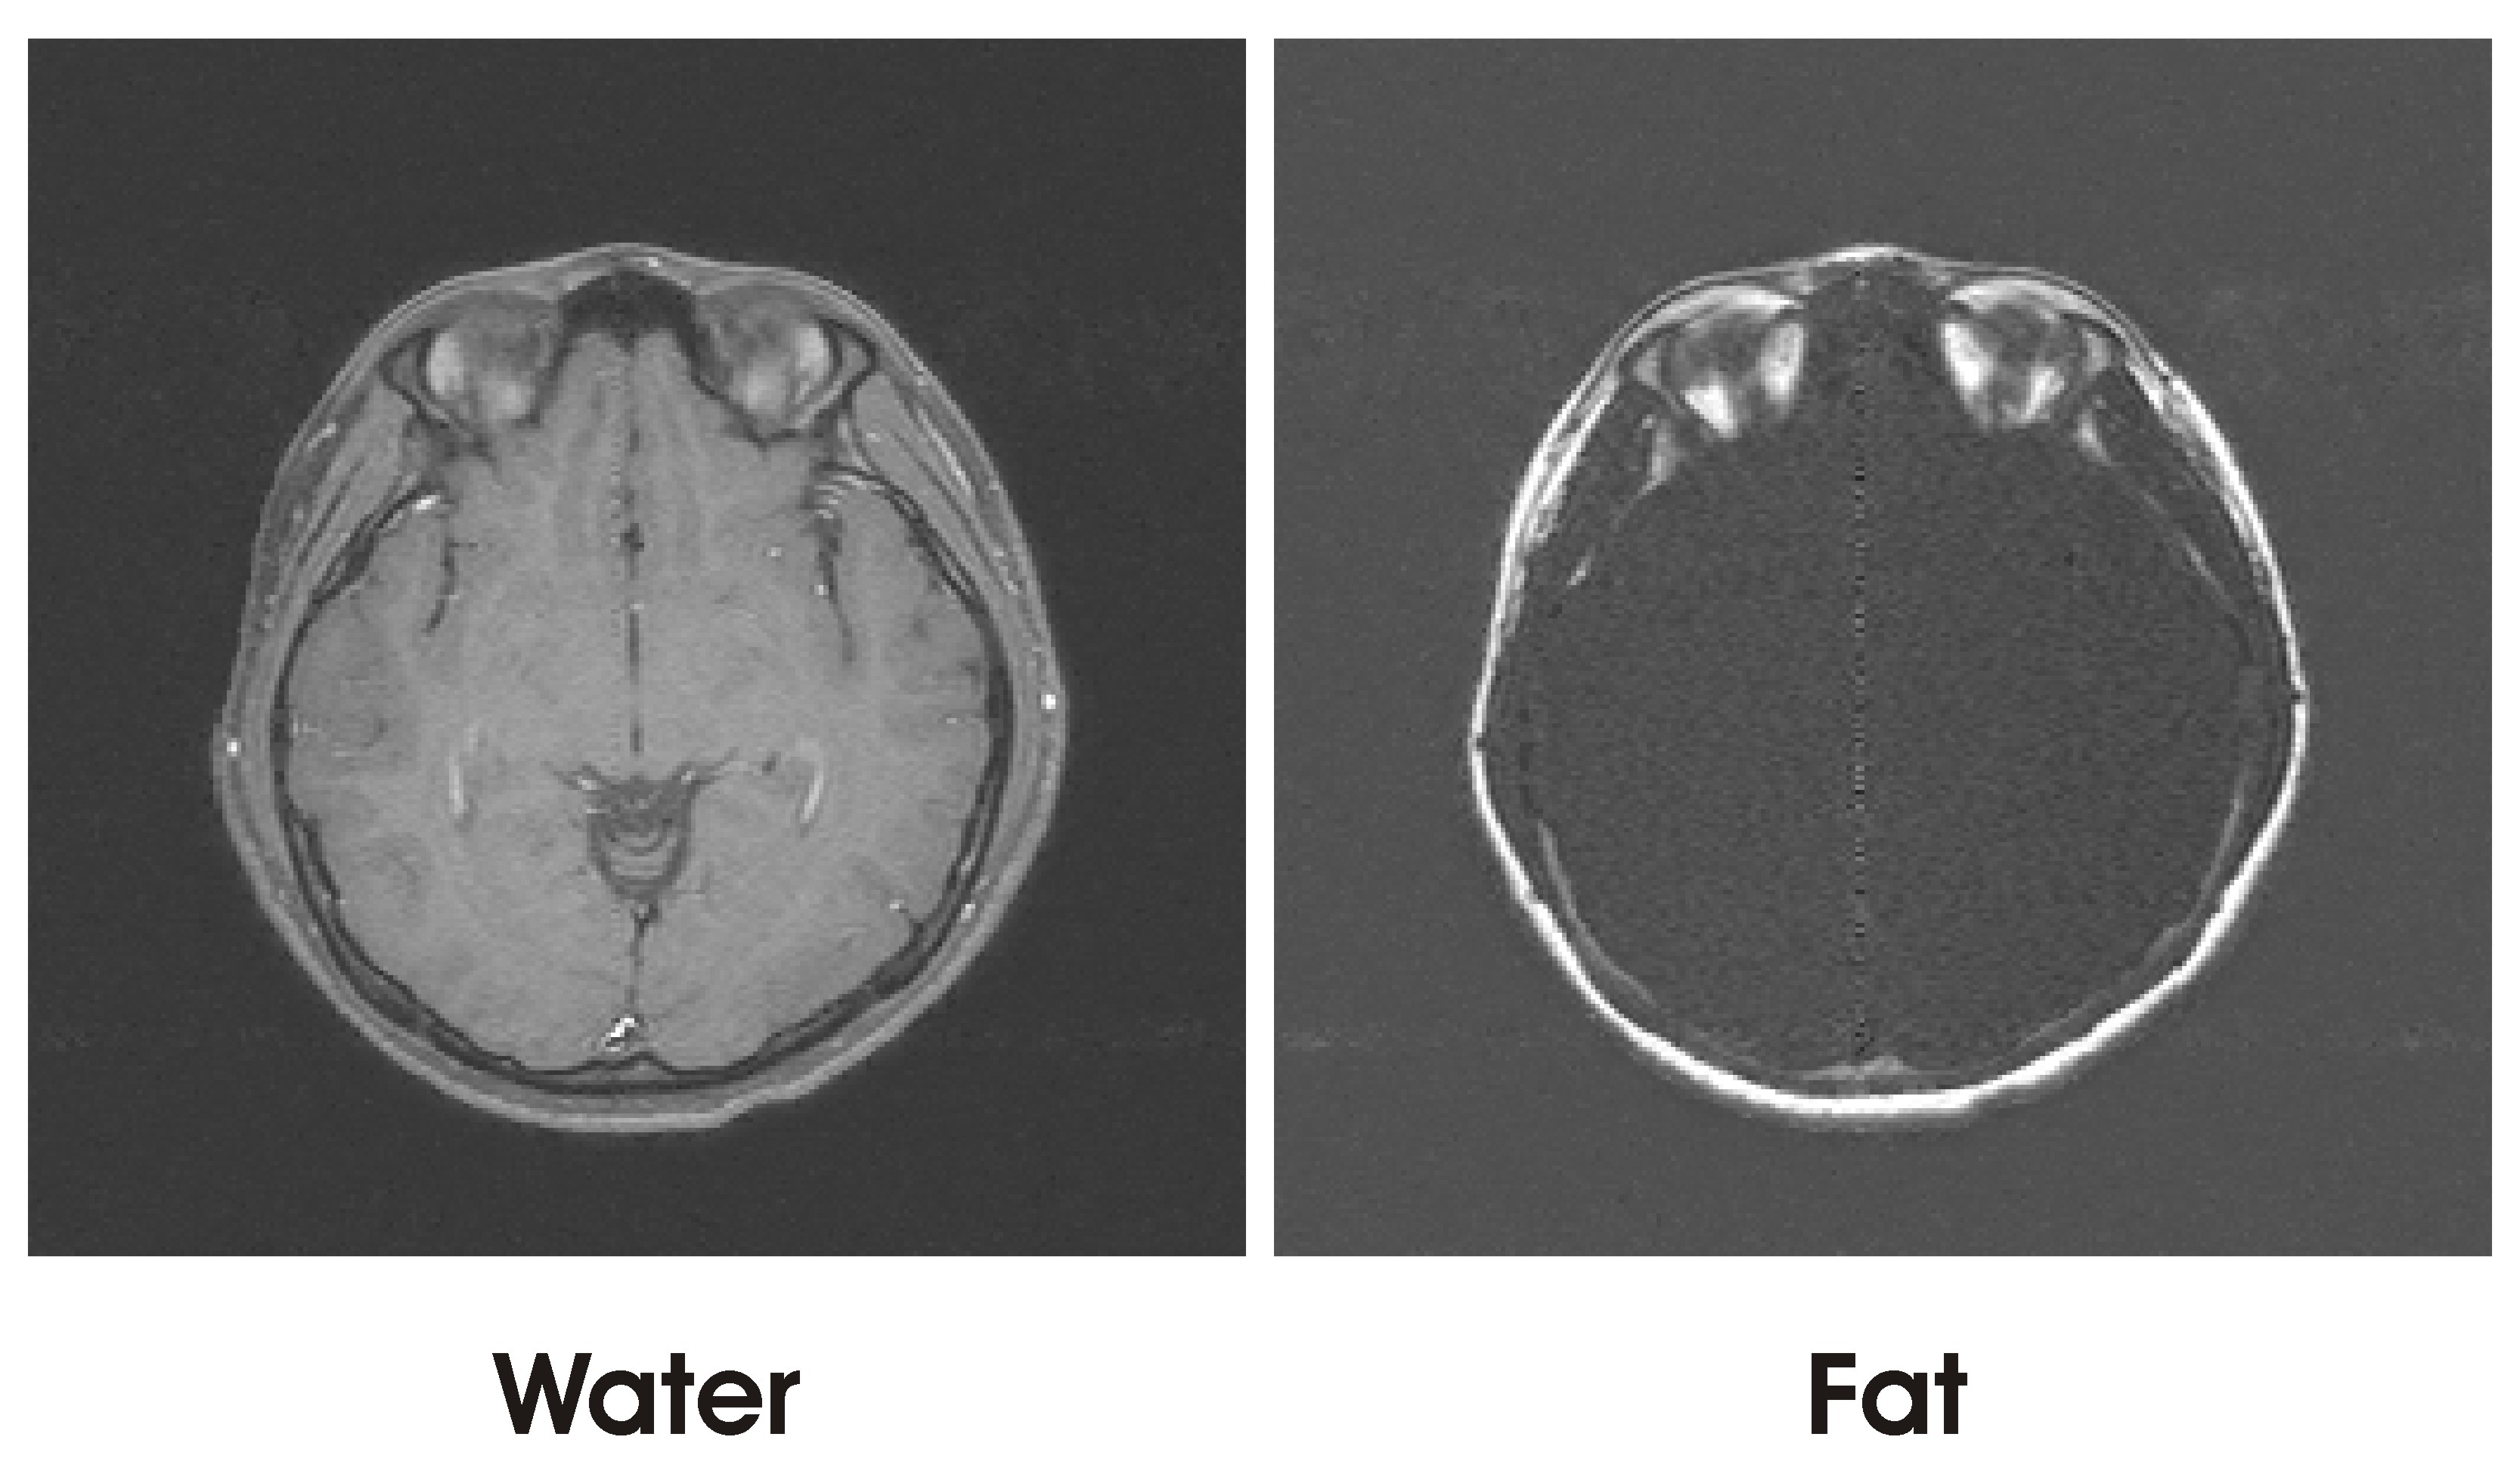
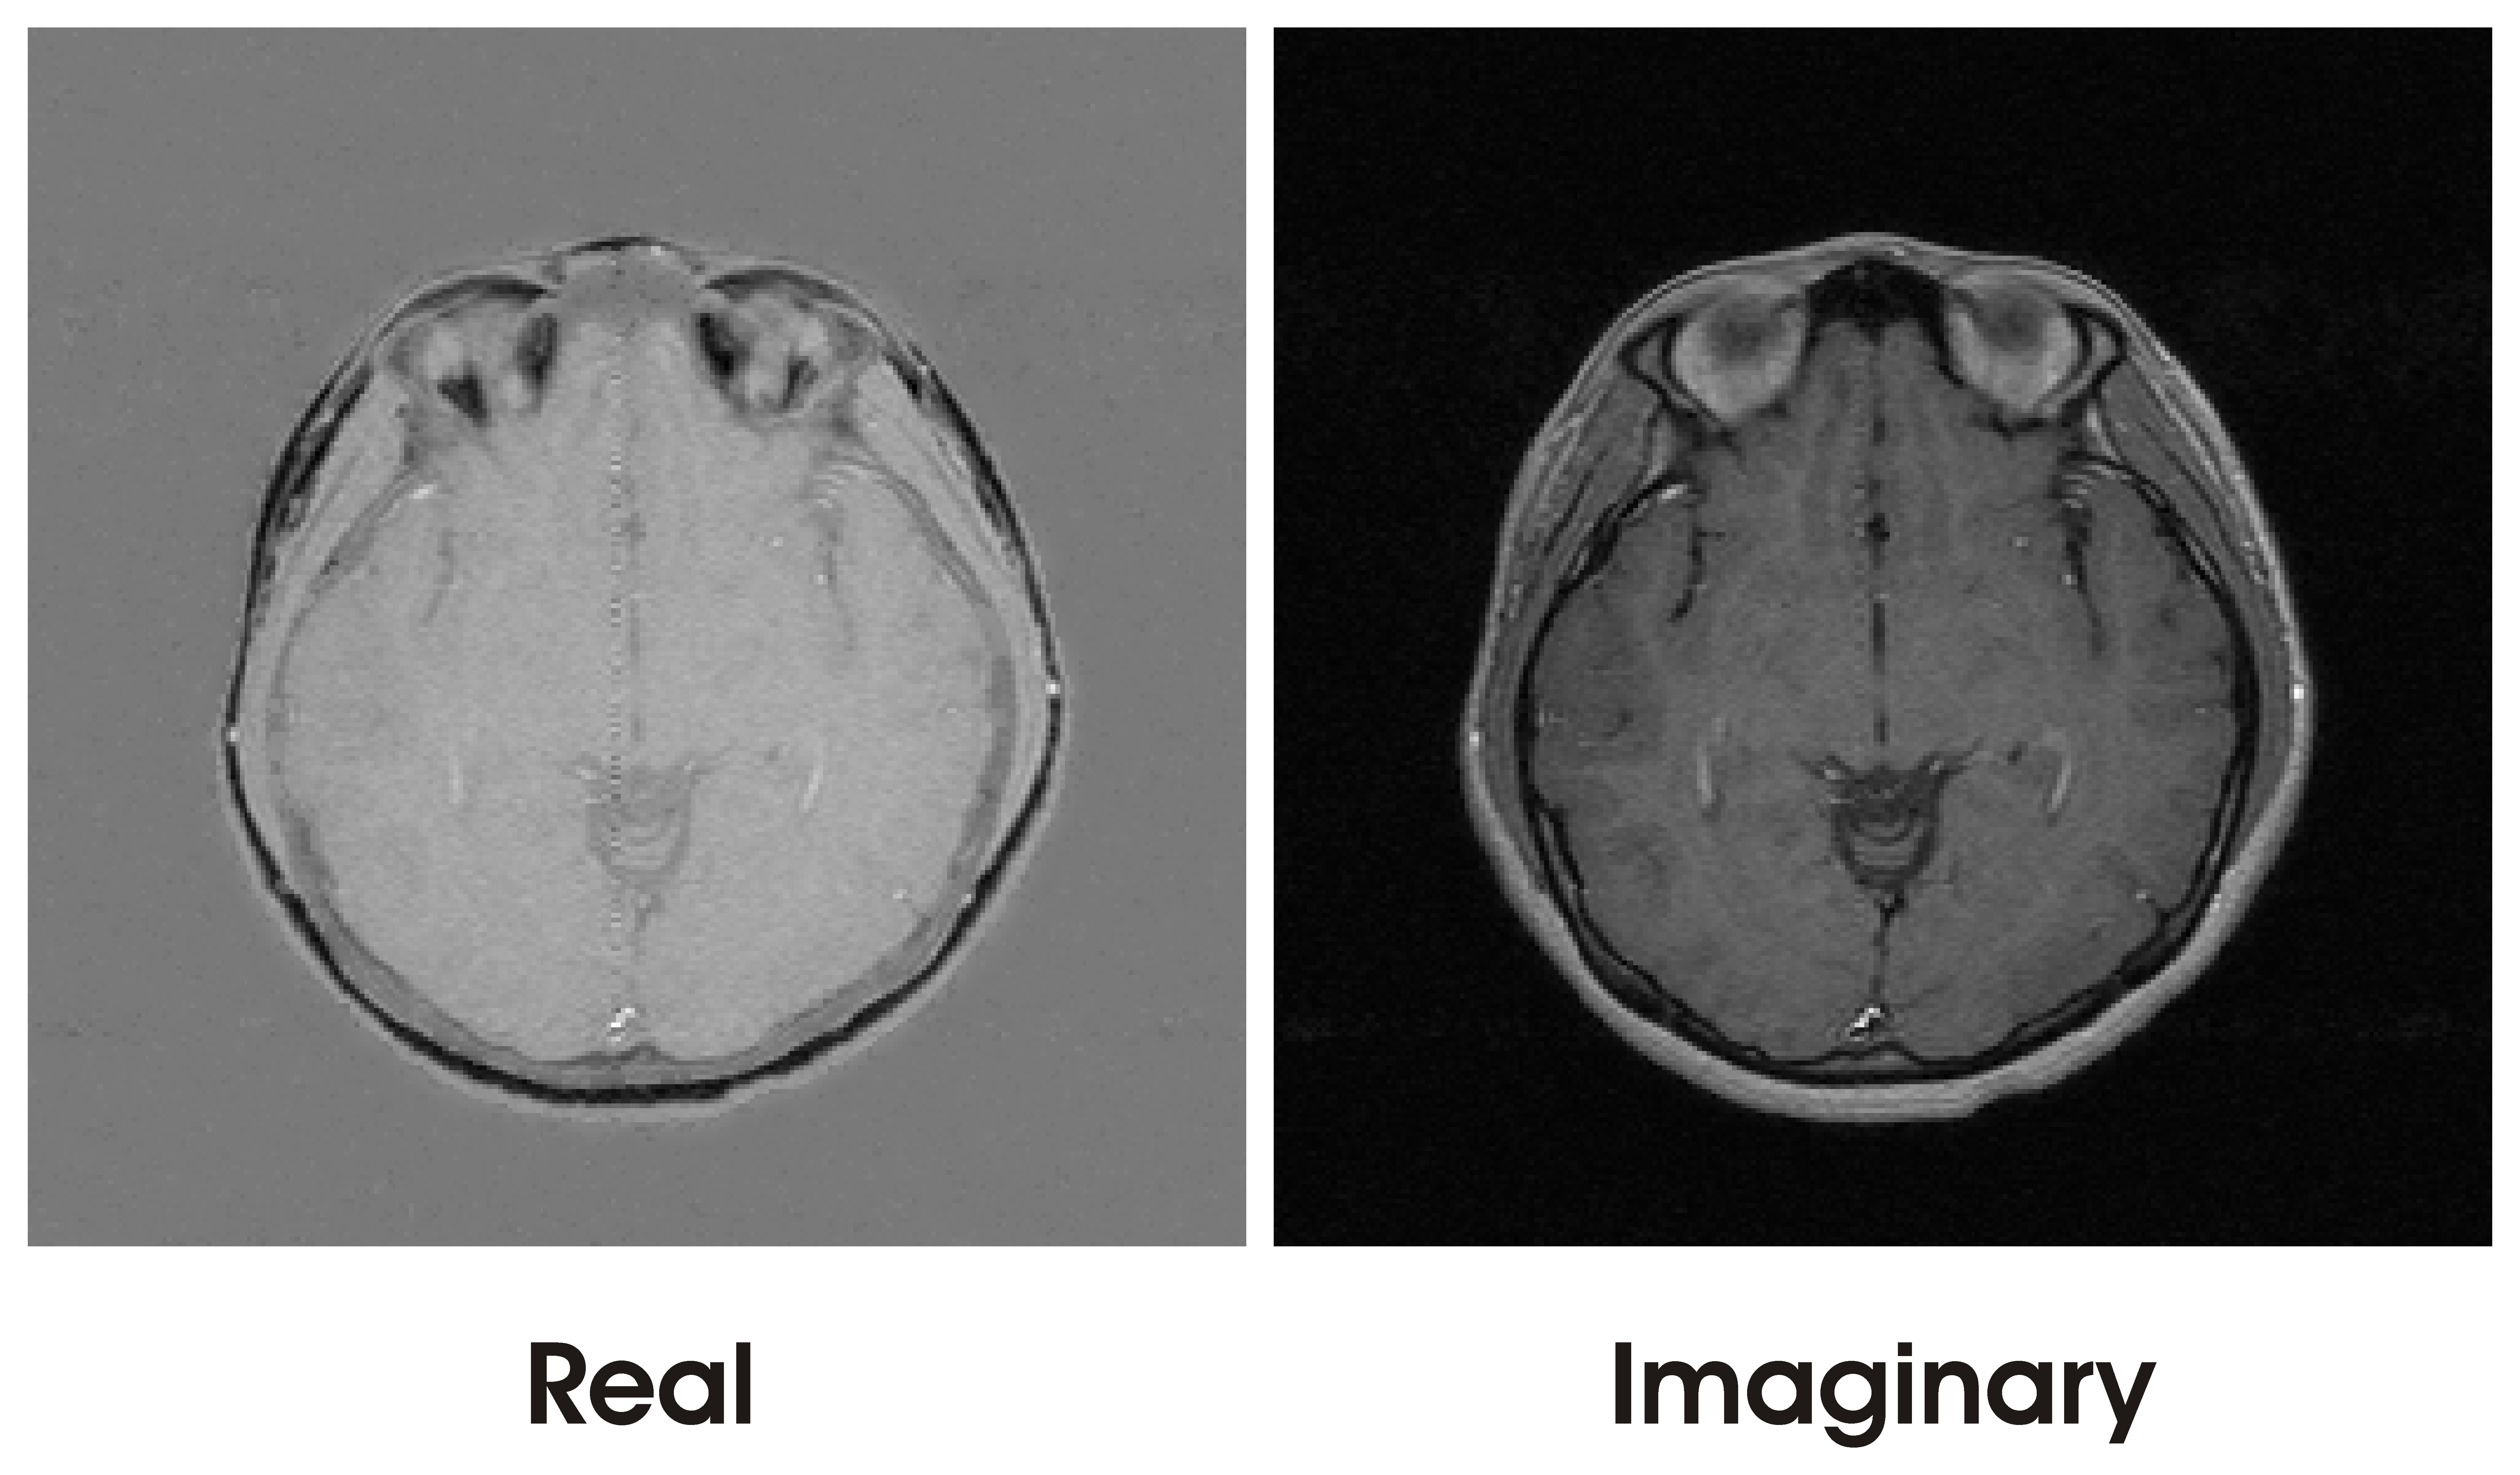
Figure 1 includes Water and Fat images (W & F) obtained from the full dataset at (0°, 90°, 180°) using proven 3-point reconstruction algorithm2.Figure 2 represents real and imaginary parts (R & I) of the uncorrected complex image C, as described by Equation(1). An arbitrary global phase rotation of 60° was applied to create a zero’th order phase error across the entire FOV. W & F components were mixed in both R & I.
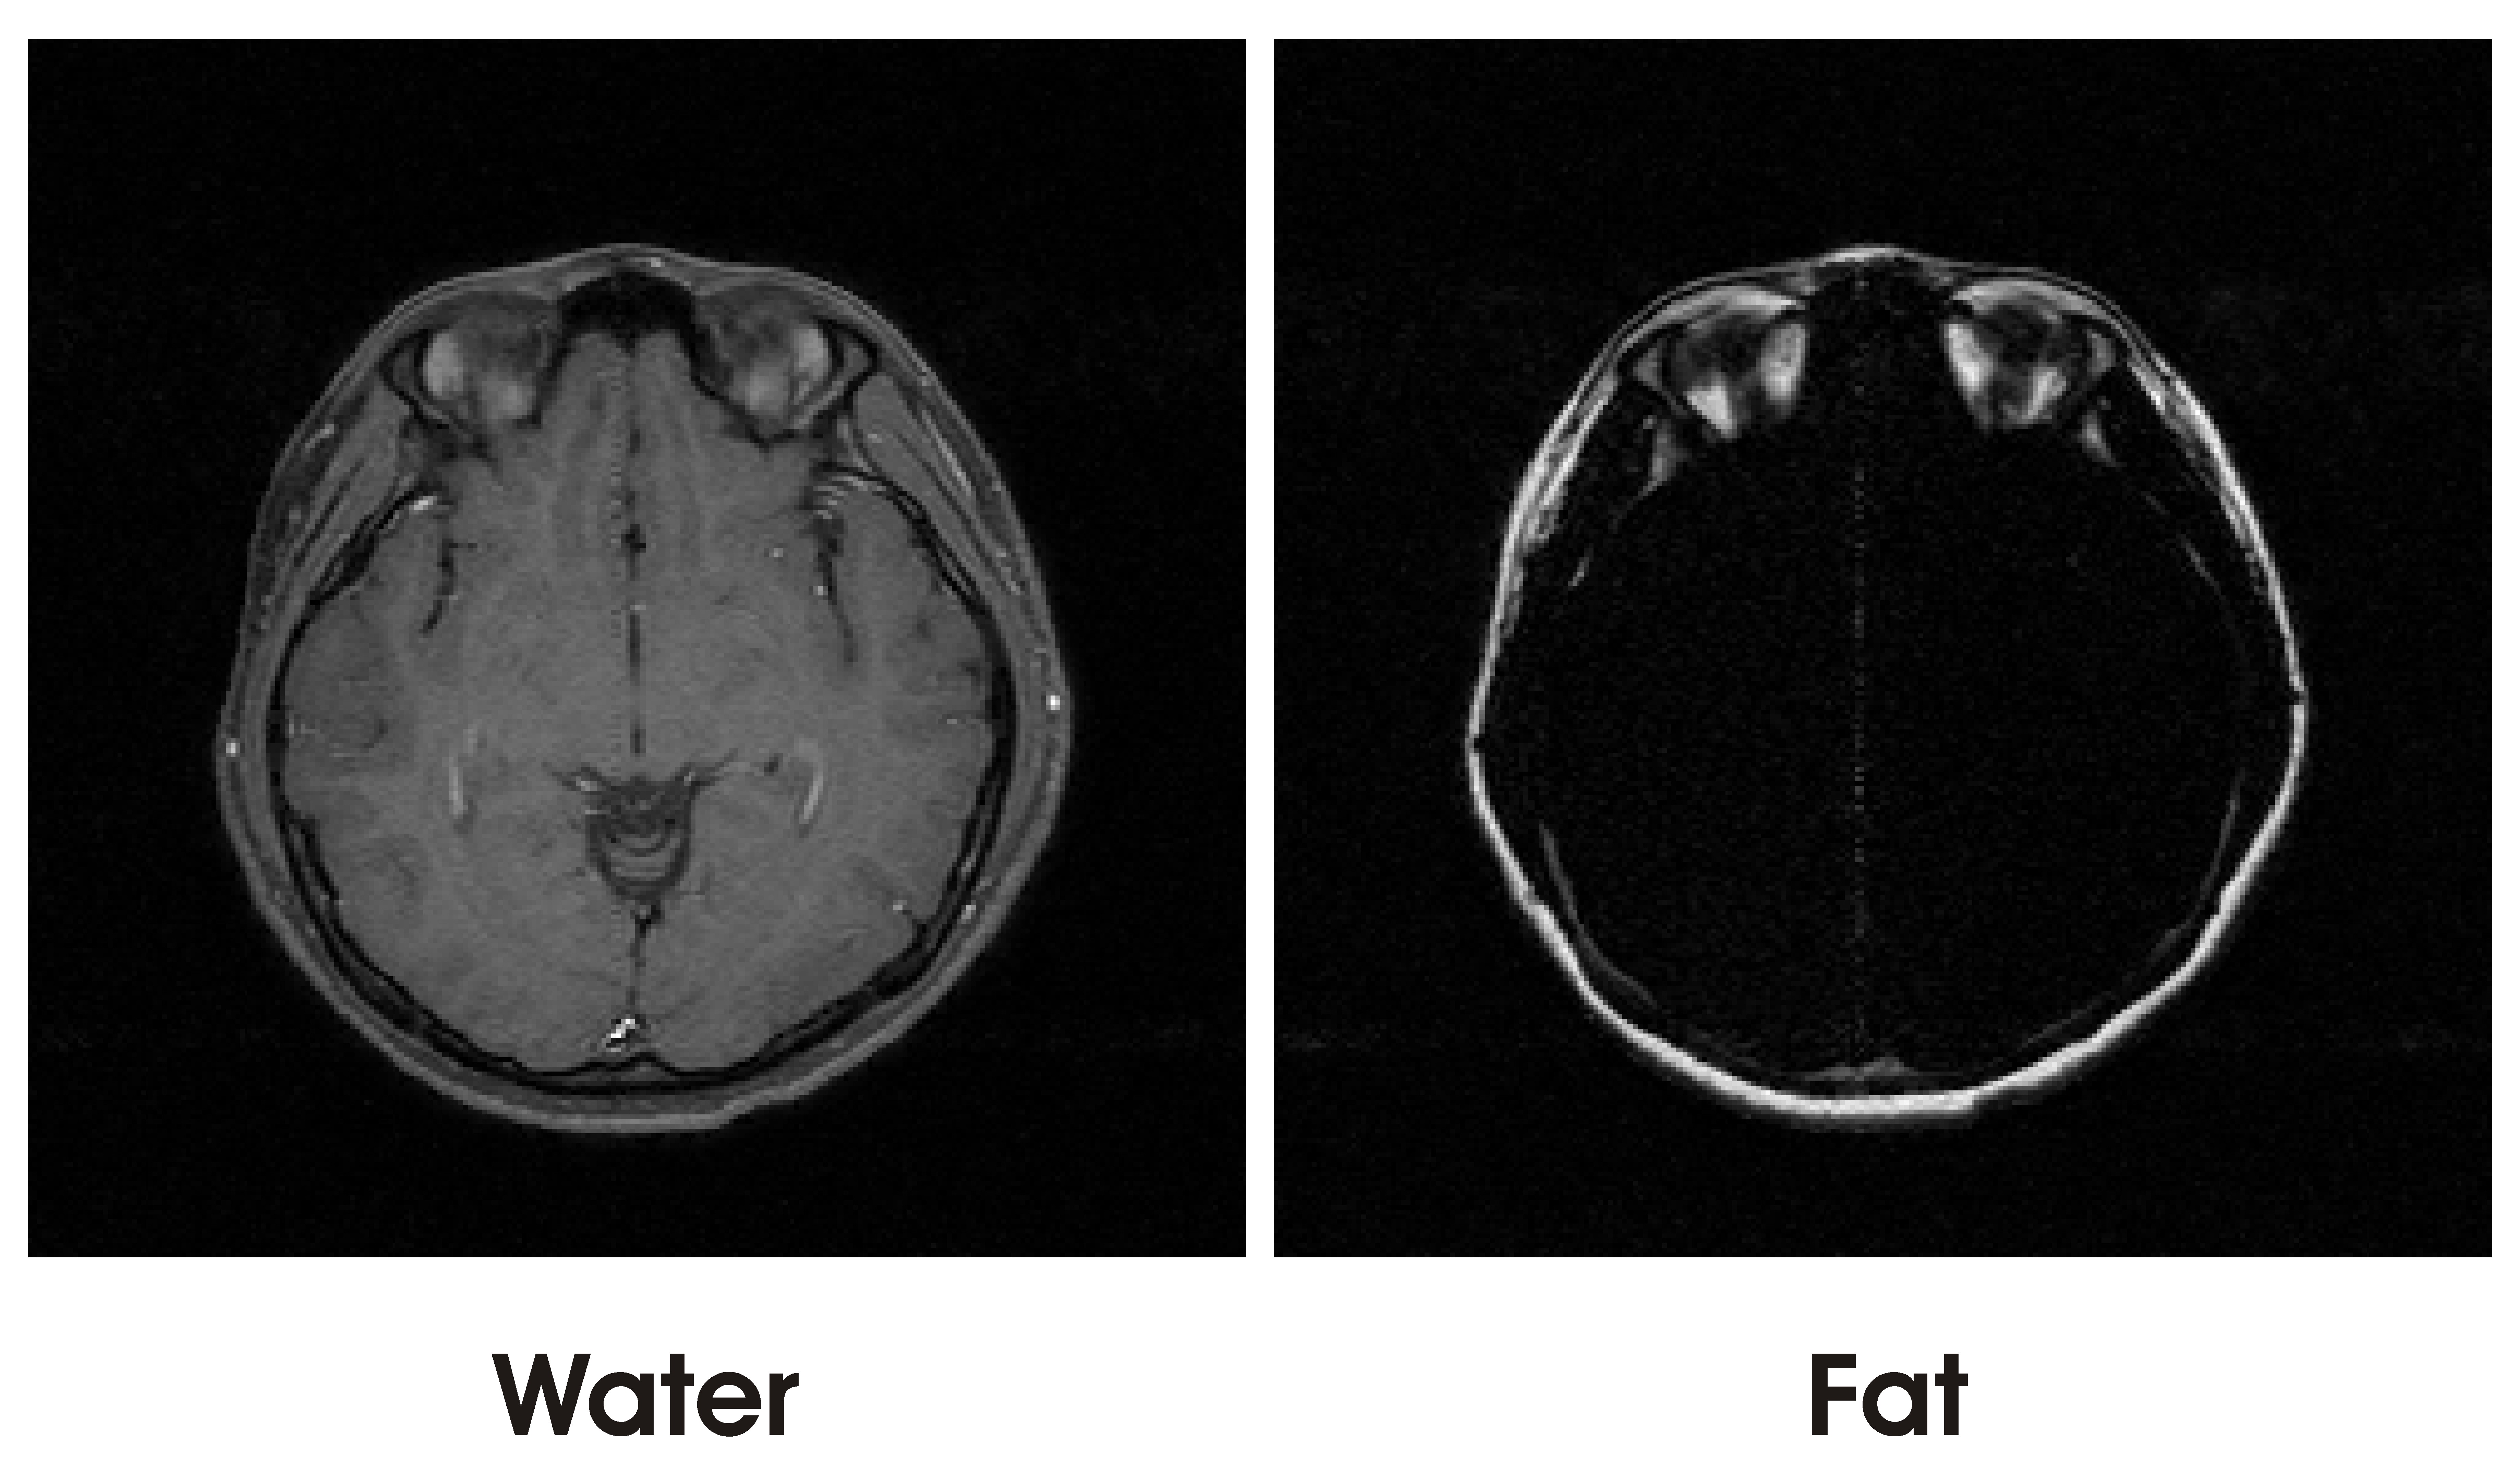
Figure 3 shows well separated resulting W and F images after MI minimization. The phase error was determined to be 59.0° + 1.0° that was consistent with the known value of 60°.
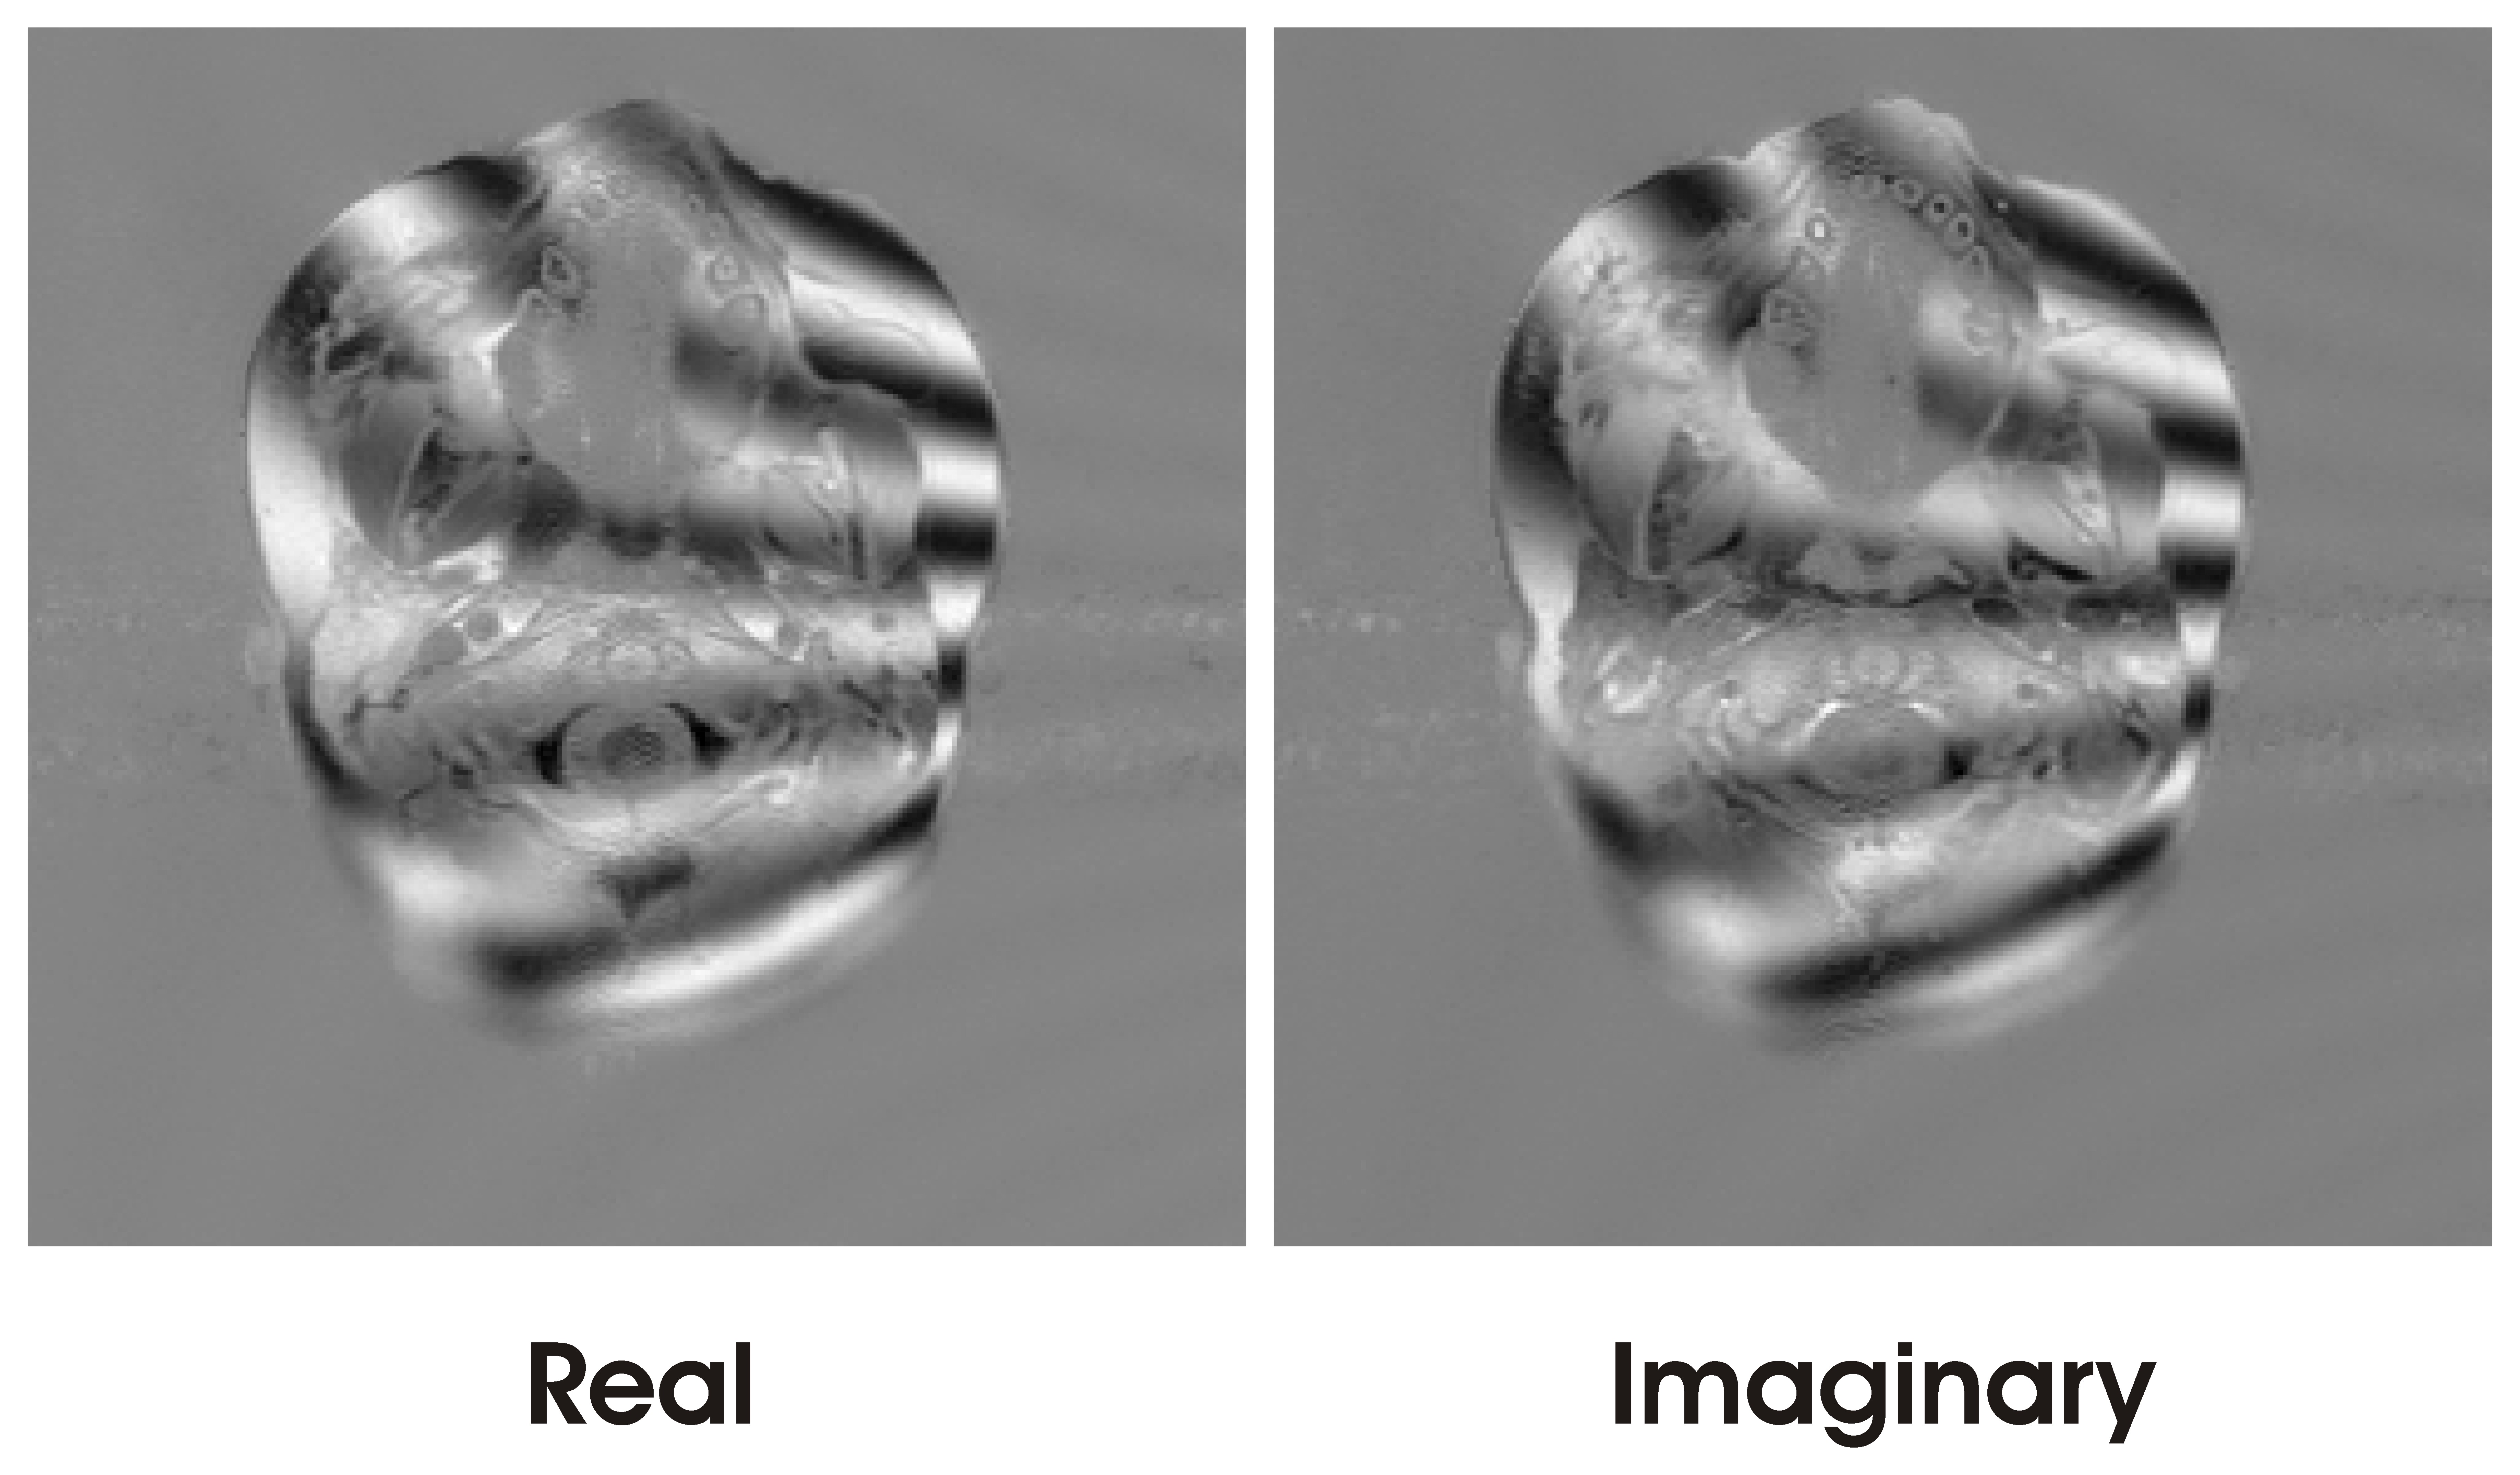
Figure 4 is a pair of R & I images with rather strong spatially varying phase errors across the FOV, as often seen in a clinical scan.
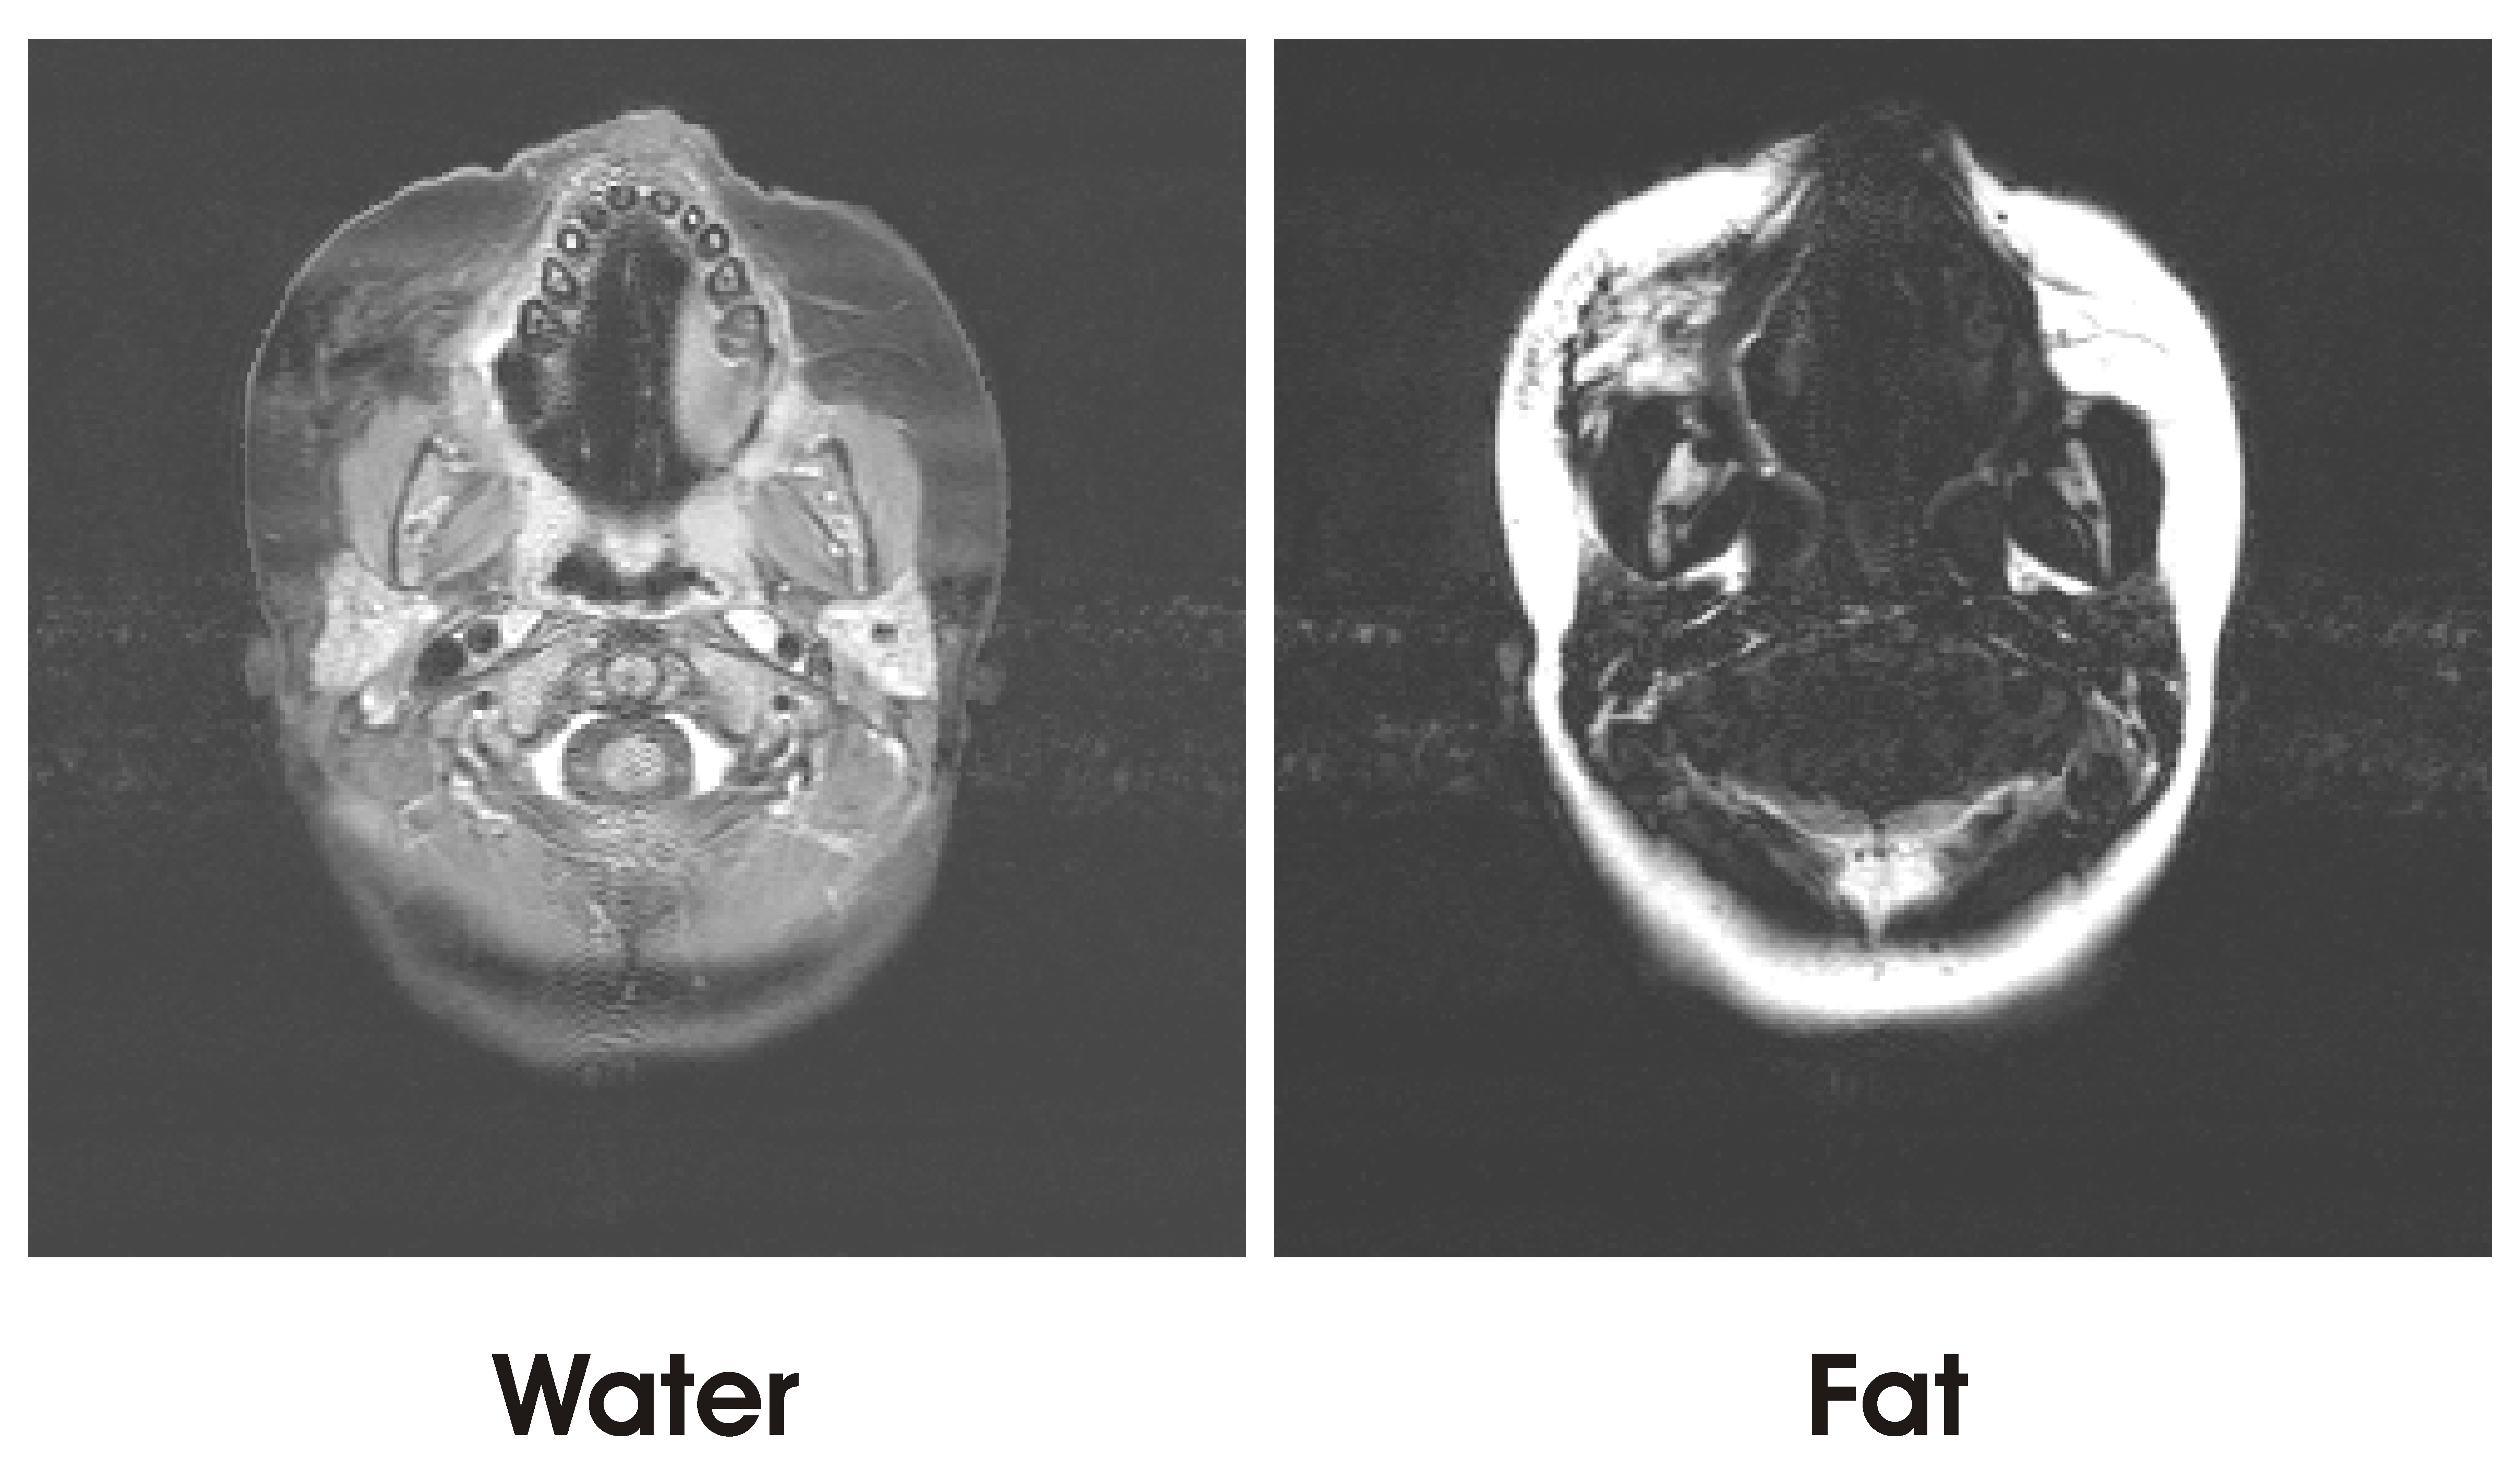
Figure 5 shows resulting W & F images after an MI minimization with regional linear 1st order phase tuning10. These were consistent with those obtained from the full 3-point dataset with (0°, 90°, 180°) sampling scheme.
Discussion
A statistical approach to 1-point Water-Fat Imaging is introduced. It uses the powerful ICA technique to achieve effective phase correction by MI minimization, leading to well separated water and fat images. In vivo data were used to demonstrate the method. The newly uncovered information can also be used to improve WFI reconstruction with two or more acquisitions.Acknowledgements
No acknowledgement found.References
[1] Dixon WT. Simple proton spectroscopic imaging. Radiology. 1984;153:189-194.
[2] Hu HH, et al. ISMRM Workshop on Fat–Water Separation: Insights, Applications and Progress in MRI, Magn Reson Med, 2012; 68:378-388.
[3] Paltiel Z. Separate water and lipids images obtained by a single scan, In: Proceedings of the 4th Annual Meeting of SMRM, New York, USA, 1985, p172-173.
[4] Patrick JL, Haacke EM, Hahn JE. Water/fat separation and chemical shift artifact correction using a single scan. In: Proceedings of the 4th Annual Meeting of SMRM, New York, USA, 1985. p174-175.
[5] Ahn CB, et al. Spectroscopic imaging by quadrature modulated echo time shifting, Magn Reson Imaging. 1986; 4:110-111.
[6] Xiang QS. Improved single point water-fat imaging with virtual shimming. In: Proceedings of the 9th Annual Scientific Meeting of the ISMRM, Glasgow, Scotland, 2001. p789.
[7] Ma J. A single-point Dixon technique for fat-suppressed fast 3D gradient-echo imaging with a flexible echo time. J Magn Reson Imaging. 2008; 27:881-890.
[8] Son JB, et al. Single-Point Dixon Water-Fat Imaging Using 64-Channel Single Echo Acquisition MRI, Concepts in Magnetic Resonance Part B. 2008; 33B(3):152-162.
[9] Hyvärinen A and Erkki O. Independent Component Analysis: Algorithms and Applications. Neural Networks. 2000;13:411-430.
[10] Ahn CB and Cho ZH. A New Phase Correction Method in NMR Imaging Based on Autocorrelation and Histogram Analysis. IEEE Trans Med Imaging. 1987; MI-6(1), 32-36.
Figures