4951
MUSIC-MRI: unleash the resolving power of k-space beyond the Fourier transform
Dongbiao Sun1,2, Yan Zhuo1,2, Lin Chen2,3, and Zihao Zhang1,3
1State Key Laboratory of Brain and Cognitive Science, Beijing MR Center for Brain Research, Institute of Biophysics, Chinese Academy of Sciences, Beijing, China, 2University of Chinese Academy of Sciences, Beijing, China, 3Institute of Artificial Intelligence, Hefei Comprehensive National Science Center, Hefei, China
1State Key Laboratory of Brain and Cognitive Science, Beijing MR Center for Brain Research, Institute of Biophysics, Chinese Academy of Sciences, Beijing, China, 2University of Chinese Academy of Sciences, Beijing, China, 3Institute of Artificial Intelligence, Hefei Comprehensive National Science Center, Hefei, China
Synopsis
Keywords: Image Reconstruction, Image Reconstruction, Non-Fourier transform reconstruction
Modern MRI reconstructs images by performing Fourier transform (FT) on k-space to decompose the signal on an orthogonal basis composed of trigonometric functions. We are inspired by the problem of estimating the Direction of Arrival in radar theory and propose a novel route for MRI reconstruction based on multiple signal classification (MUSIC). MUSIC-MRI overcomes the sidelobe problem of FT and significantly promotes the actual resolution in the meaning of full width at half maximum (FWHM). Our phantom experiments show that the FWHMs are 0.45mm by MUSIC-MRI and 1.50mm by FT, while the nominal resolution of the k-space data is 0.94mm.Introduction
In 1975, Ernst used the gradient field to create the orthogonal basis and reconstructed MR images by performing Fourier transform (FT). The severe sidelobe problem of FT and the nonconvergent partial sum of Fourier coefficients decrease the usable resolution even if increasing the encoding matrix, which manifests as the Rayleigh limit. We are inspired by the problem of estimating DOA (Direction of Arrival) in radar theory and propose MUSIC (MUltiple SIgnal Classification) reconstructions to overcome the sidelobe problem of FT.Methods
The modern MRI performs FT for orthogonal basis decomposition on k-space data to get images, while we decompose the expectation of k-space data to obtain signal subspace and estimate its spectral to get images. The simulation was performed to demonstrate the profile of the reconstructed signal. The real signal was assumed to be at polar coordinates = 85 and 95 deg, with consistent and different intensities. The phantom experiments were performed on a human 7T MR research system (Siemens Healthcare, Erlangen, Germany) with a birdcage coil. We measured the full width at half maximum (FWHM) to evaluate the actual resolution and used normalized signal intensity for contrast assessment. An ACR-like phantom with hole array pairs was used for resolution evaluation. The array pairs were composed of uniformly distributed hole grids with a diameter of 1mm and a spacing of 1mm. The gradient echo (GRE) sequence was scanned with the following parameters: field of view (FOV) = 180×180mm2, matrix = 192×192, nominal resolution = 0.94×0.94mm2, thickness = 3mm, TR = 100ms, TE = 4.97ms, FA = 25°. The FWHMs were measured on the images reconstructed by MUSIC and FT. A paired t-test was performed on FWHMs to compare the actual resolution of the two methods. The homemade stair-like phantom was used to assess the image contrast of MUSIC-MRI. The height of each step was 1mm and the width was 2mm. The GRE sequence was used with the same parameters except for FOV = 50×50 mm2 and thickness = 8mm.Results
The results of the simulations are shown in Figure 1. Sharper signal peaks and suppressed side lobes are given by the MUSIC-MRI reconstruction, with the same intensities as FT-MRI at the signal positions. The resolution-phantom and the reconstructed images are shown in Figure 2. The MUSIC-MRI delineates the hole points that cannot be resolved by FT-MRI with the limited encoding matrix. The FWHM measurements of the grid area are shown in Figure 3. The FWHMs obtained by MUSIC-MRI are 0.48±0.02 mm horizontally and 0.49±0.02 mm vertically, while the FWHMs of FT-MRI are 0.80±0.21mm horizontally and 0.84±0.39mm vertically. The FWHMs of the MUSIC-MRI is significantly smaller than that of FT-MRI (p = 2.968e-08 horizontally and p = 0.0229 vertically). For the middle lines of the grid in Figure 4, the FWHMs obtained by FT-MRI degrade to 0.95±0.25 mm horizontally and 0.94±0.27 mm vertically, while the MUSIC-MRI maintains superior FWHMs of 0.49±0.04 mm and 0.48±0.04 (p = 4.479e-06 horizontally and p = 0.0168 vertically). Figure 5 demonstrates that MUSIC-MRI has contrast levels similar to FT-MRI after intensity normalization.Discussion
Our study shows that MR images can be obtained without solving orthogonal bases using FT. According to the simulation results in Figure 1, the resolving power of MUSIC-MRI is superior to FT-MRI as it overcomes the sidelobe problem. The phantom experiments validate the theoretical expectation that the sharper signal profile of MUSIC-MRI exhibits higher resolving power than FT-MRI when reconstructing the same k-space data. Figure 3 and 4 confirm that MUSIC-MRI is capable of resolving the hole array from the k-space data with a small encoding matrix, while FT-MRI can hardly distinguish adjacent signals in this case. In fact, the number of voxels in the images reconstructed by MUSIC-MRI relies on the iterations of the calculation. Therefore, it may require a new definition of the “resolution” of MR images. Nonetheless, the consistent contrast of MUSIC-MRI to FT-MRI makes its signal meaningful in most conventional MRI applications. There are still obvious limitations in the current version of MUSIC-MRI. First, the current framework of MUSIC-MRI does not support the previous undersampling reconstruction, such as GRAPPA and SENSE, which needs further development of the algorithm. Second, the solution of MUSIC is highly dependent on large-scale SVD, which is time-consuming and memory-intensive.Conclusion
A novel MUSIC reconstruction framework is proposed to generate MR images without solving the Fourier basis. MUSIC-MRI achieves significantly sharper FWHMs than FT-MRI while maintaining consistent contrast levels. The reconstructed images unleash the resolving power implicit in k-space data.Acknowledgements
We acknowledge Dr. Jing An from Siemens Shenzhen Magnetic Resonance Ltd. for her support in the experiments. This study has received funding from the National Natural Science Foundation of China (82271985, 82001804, 8191101305), the Ministry of Science and Technology of China (2022ZD0211901, 2019YFA0707103), the Natural Science Foundation of Beijing Municipality (7191003).References
1. Lauterbur, Paul C. "Image formation by induced local interactions: examples employing nuclear magnetic resonance." nature 242.5394 (1973): 190-191
2. Aue, W. P., E. Bartholdi, and Richard R. Ernst. "Two‐dimensional spectroscopy. Application to nuclear magnetic resonance." The Journal of Chemical Physics 64.5 (1976): 2229-2246
3. Schmidt, Ralph. "Multiple emitter location and signal parameter estimation." IEEE transactions on antennas and propagation 34.3 (1986): 276-2804.
4. R. O. Schmidt. A Signal Subspace Approach to Multiple Emitter Location and Spectral Estimation. Ph.D. dissertation, Stanford University, Stanford, CA, 1981.
Figures
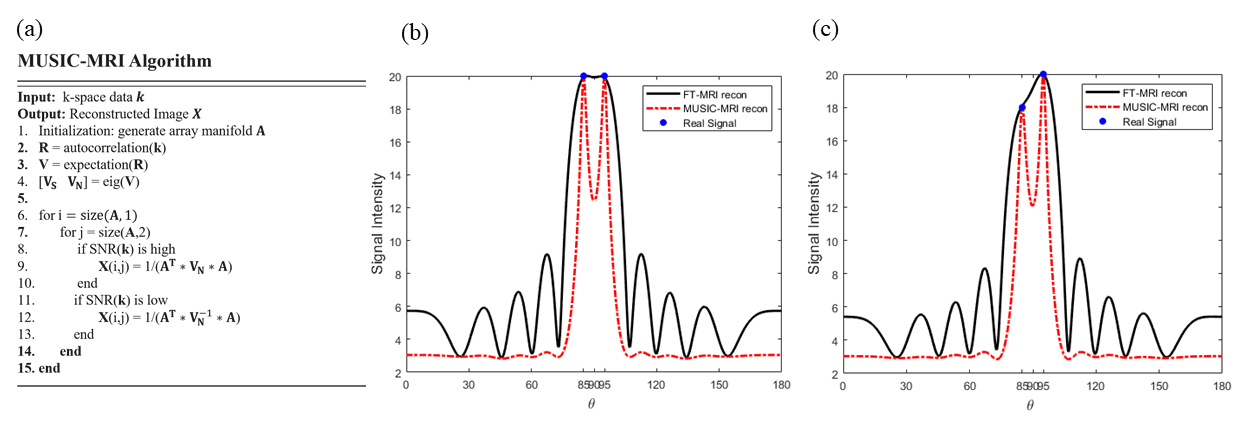
Figure 1. The
pseudo-code of the MUSIC reconstruction algorithm was shown in (a). Simulation results of reconstructing two closed signals with
= 85 and 95 deg using MUSIC and FT.
The real signal intensities are (b) 20 and 20, (c) 18 and 20.
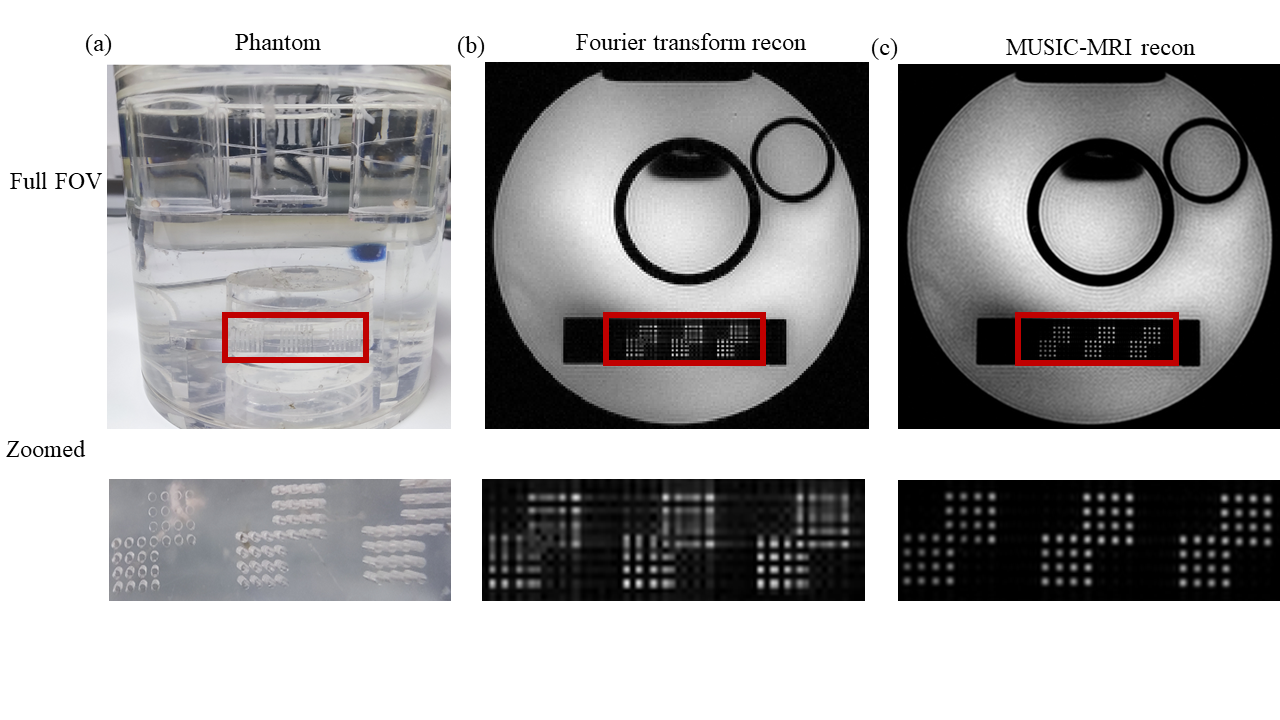
Figure 2. The
resolution phantom and the reconstructed images of FT-MRI and MUSIC-MRI. (a)
The ACR-like phantom, (b) The image reconstructed by Fourier transform, (c) The
image obtained by MUSIC reconstruction. The lower row is the zoomed view of the
boxed areas in the upper row.
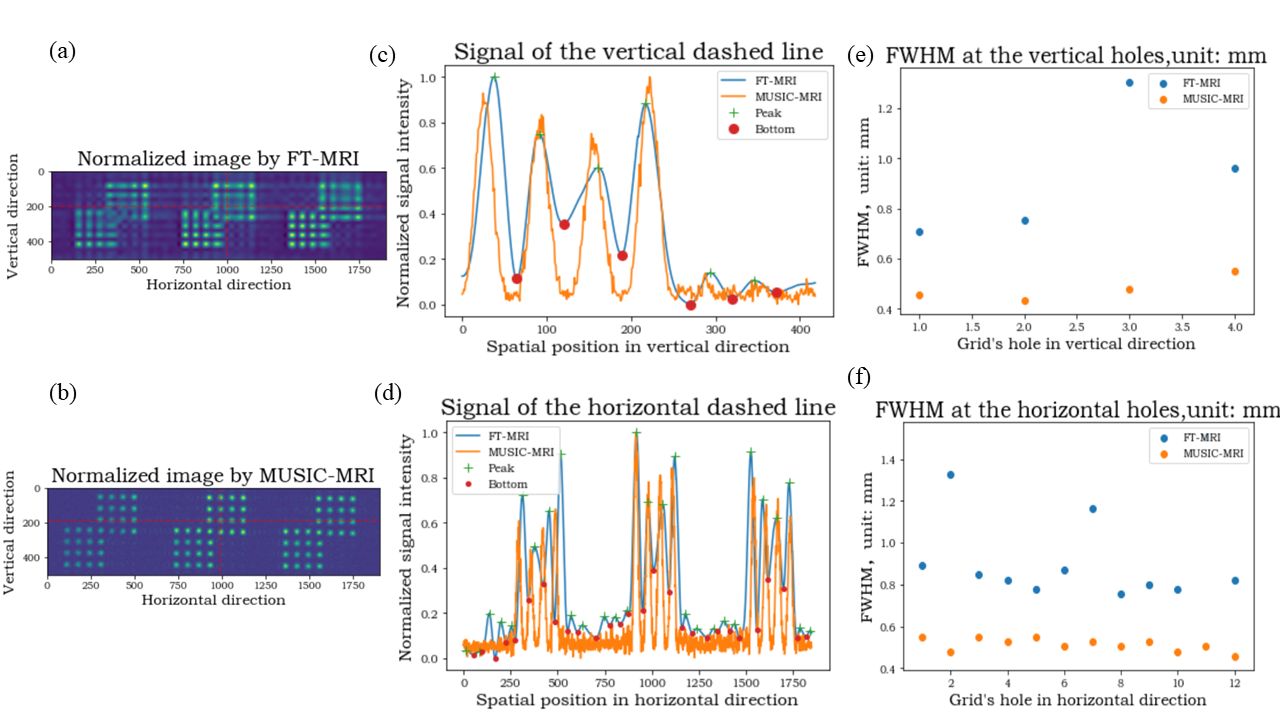
Figure 3.
The analysis of full width at half maximum (FWHM) on the reconstructed hole
grids. (a, b) The images obtained by Fourier transform and MUSIC
reconstruction, respectively. The signals of the dashed lines were extracted
for analysis. (c, d) The signal curves of the vertical and the horizontal
lines. (e, f) The FWHMs of the signal peaks.
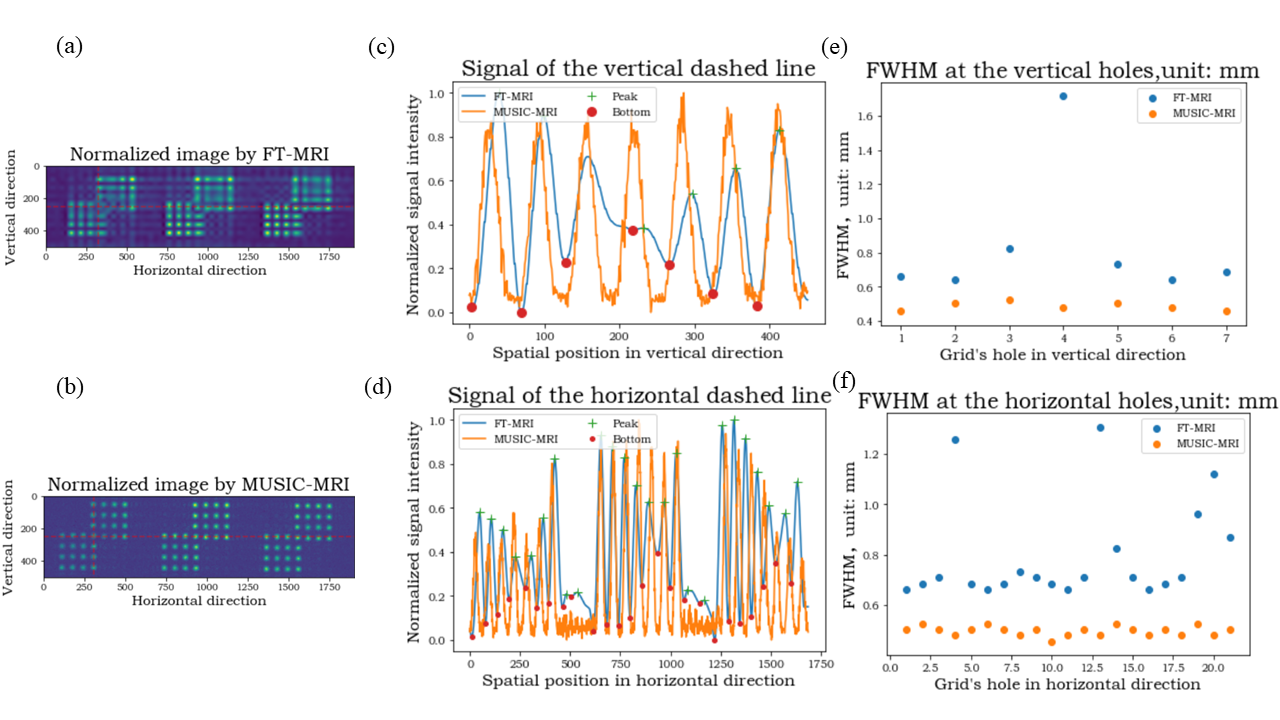
Figure 4. The
analysis of full width at half maximum (FWHM) on the middle lines of the hole
grids. (a, b) The images obtained by Fourier transform and MUSIC reconstruction,
respectively. The signals of the dashed lines were extracted for analysis. (c,
d) The signal curves of the vertical and the horizontal lines. (e, f) The FWHMs
of the signal peaks.
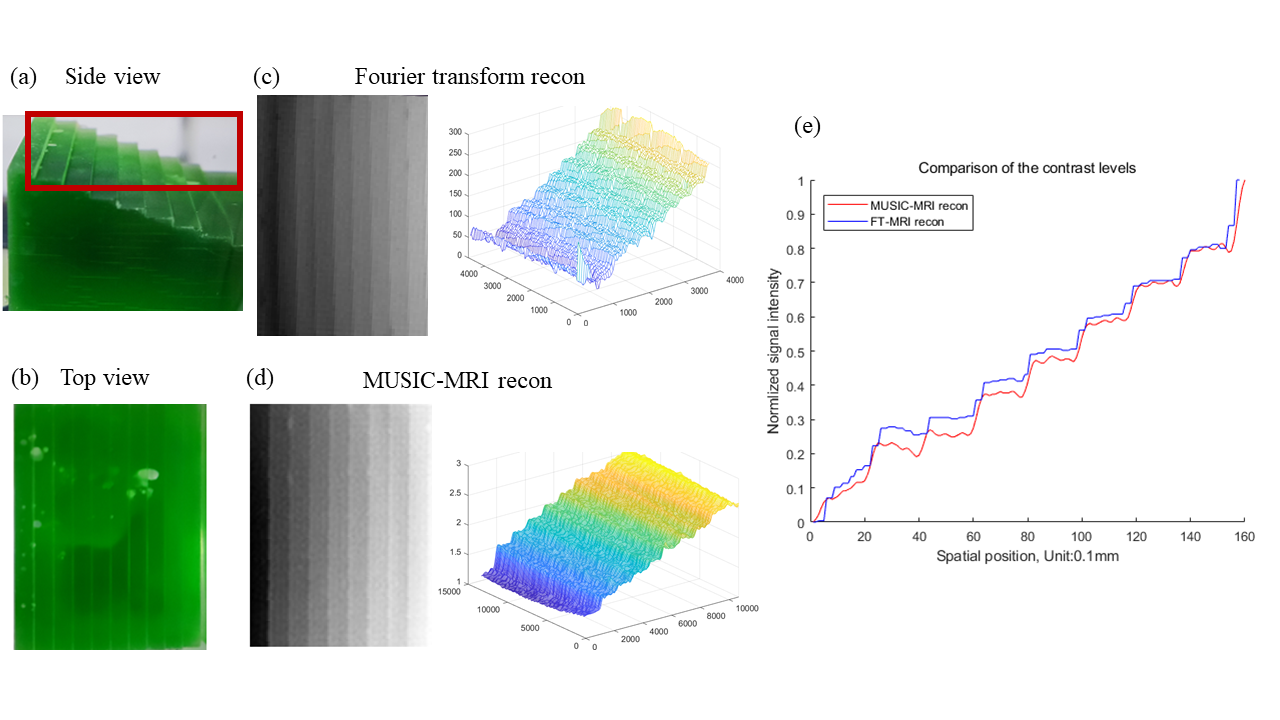
Figure 5. The
contrast assessment using the homemade stair-like phantom. (a, b) The side and
top views of the phantom. The red box indicates the imaging slice. (c, d) The grayscale
and mesh views of the images reconstructed by Fourier transform and MUSIC-MRI.
(e) The contrast levels of the two methods after intensity normalization.
DOI: https://doi.org/10.58530/2023/4951