4949
Locally high rank reconstruction through Partial Separability model (PS-LHR) with regional optimized temporal basis (ROT) of dynamic speech MRI1Department of Bioengineering, University of Illinois Urbana-Champaign, Champaign, IL, United States, 2National Center for Supercomputing Applications, Champaign, IL, United States, 3Gordon Center for Medical Imaging, Department of Radiology, Massachusetts General Hospital/Harvard Medical School, Boston, MA, United States, 4Department of Communication Sciences and Disorders, East Carolina University, Greenville, NC, United States, 56 Department of Electrical and Computer Engineering, University of Illinois Urbana-Champaign, Champaign, IL, United States
Synopsis
Keywords: Image Reconstruction, Sparse & Low-Rank Models
To optimize the reconstruction quality of isotropic 3D dynamic speech magnetic resonance imaging with large scan volume, we applied two novel methods based on the Partial Separability model theory: 1. Locally High-Rank reconstruction through Partial Separability model (PS-LHR) which enables higher rank to be devoted to the dynamic speech region. 2. Implementation of Regional-Optimized Temporal basis (ROT) to focus the temporal navigator information on the speech region. The improvement in reconstruction quality was seen to decrease the noise of regions of the image outside the area of interest and increase dynamic smoothness in the speech region.Introduction
Dynamic speech MRI is becoming widely used in medical research and provides promising prospects for linguistic research. Traditional speech imaging has been drastically expanded in spatial coverage and speed using the low-rank Partial Separability (PS) model1,2,3. Recent work utilizing the PS model achieved a 2-mm isotropic 3D imaging with 64 mm axial coverage and a temporal resolution of 35.6 fps4,5. However, with extended 3D imaging volumes, the general model rank will expand and, when coupled with the need to keep the sampling time short, will thus result in significant noise amplification in regions outside the area of interest (e.g., the static brain) where a high-rank measure is not an accurate estimate. A previous denoising method achieved SNR boost by extending the PS model to a locally low-rank model that represents MR spectroscopic imaging signals within different tissues as separate subspaces with different ranks6. Due to the localized dynamic regions in speech imaging, we proposed a combination of several novel methods to improve the reconstruction quality: a locally high-rank reconstruction (PS-LHR) with regional optimized temporal bases (ROT). Using these, we were able to experience a large SNR boost across the entire image and achieved better qualities of the dynamics in the speech region.Methods
Based on the previous PS model speech work4,5, we used parallel imaging factor of 2 in the phase encode direction to sample 64 equally-spaced k-space lines out of 128 in each 3D kz-plane. We acquired spiral cone temporal navigators that were interleaved with every four Cartesian imaging k-space lines. 80 full frames of 32 kz-location 3D data were sampled with (80*32*64/4=40960) total timeframes of reconstructed 3D data.We have expanded the PS-model with spatially dependent ranks. The input image timeseries can be represented as $$$f(\mathbf{r},t)$$$. The spatial coordinates $$$\mathbf{r}$$$ are separated into $$$\mathbf{r}_s$$$, which indicates the region of dynamic speech, and $$$\mathbf{r}_n$$$, which indicates other mostly static regions outside the target speech area. We applied two model ranks for the two regions as $$$L_s$$$, for speech, and $$$L_n$$$, for non-target regions, where $$$L_s>L_n$$$. The desired image timeseries can be represented as $$f(\mathbf{r},t)=\sum_{l=1}^{L_s}c_l(\mathbf{r}_s)\varphi_l(t) +\sum_{l=1}^{L_n}c_l(\mathbf{r}_n)\varphi_l(t)$$ where $$$c_l(\mathbf{r})$$$ denotes the spatial basis, $$$\varphi_l(t)$$$ represents temporal basis. The temporal basis is acquired through singular value decomposition from a regional-optimized virtual coil selected at the speech region based on the ROVir method to focus sensitivity on the speech region7. The estimation of spatial basis can be solved through minimization of: $$ \{\hat{c}_l(\mathbf{r})\}_{l}^{L_s} =arg\min_{c_l(\mathbf{r})}\{\Vert{s(\pmb{k},t)-\mathit{\Omega}WS[\sum_{l=1}^{L_s}c_l(\mathbf{r}_s)φ_l(t)+\sum_{l=1}^{L_n}c_l(\mathbf{r}_n)φ_l (t)]}\Vert_{2}^{2}+\lambda\Phi_{huber}[D(c_l(\mathbf{r}))]\}$$
$$$\{\hat{c}_l(\mathbf{r})\}$$$ is the estimated spatial basis, $$$s(\pmb{k},t)$$$ measured data, $$$W$$$ is the DFT matrix, $$$S$$$ is the coil sensitivity weighting matrix, $$$\mathit{\Omega}$$$ is the data sampling matrix, and $$$\lambda$$$ is the regularization coefficient. $$$D(\cdot)$$$ is the operator that takes first order spatial derivative in each dimension. $$$\Phi_{huber}(\cdot)$$$ indicates the Huber penalty.
Results
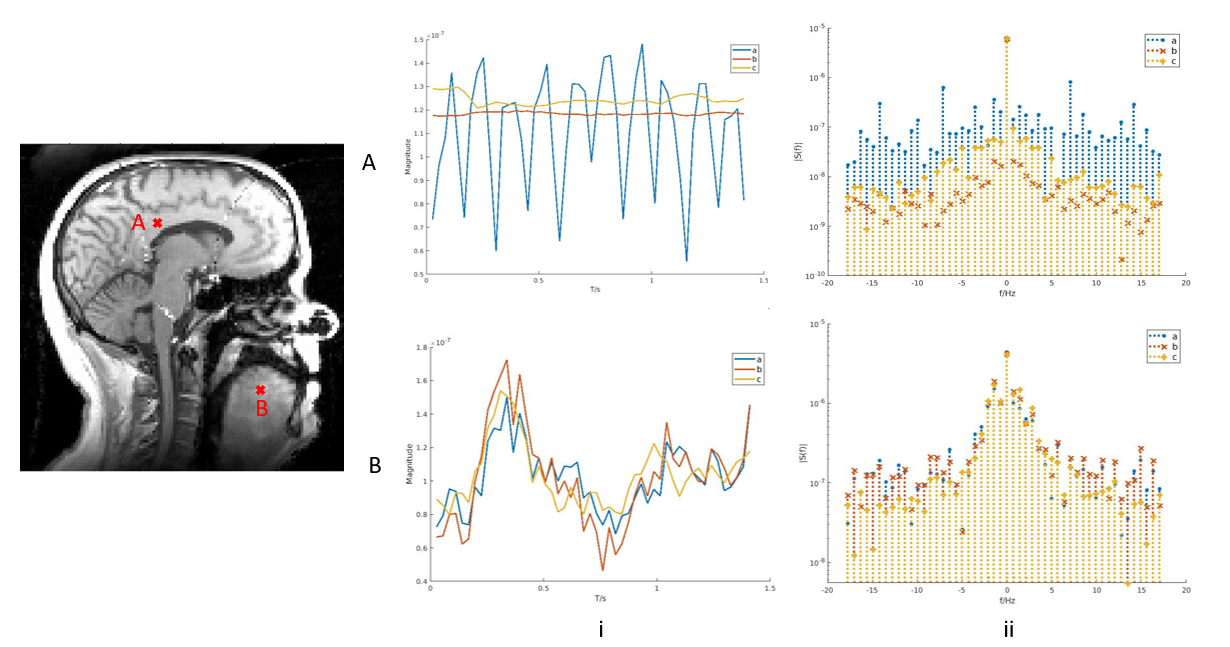
To illustrate the improvement in reconstruction quality, we made comparisons across two components of the model: 1. Global PS reconstruction (using a uniform model order over the whole 3D image) versus PS-LHR (where the model order is higher in the speech region), 2. Original temporal basis (global, not focused on the speech region) versus the ROT (focusing the ROVir coil combination for the navigator data on the speech region). We had three sets of reconstruction images to compare, (a) Global PS-recon with and original temporal basis, (b) PS-LHR with and original temporal basis, (c) PS-LHR with and ROT. The speech region was selected manually as the fourth quadrant of sagittal view across all slices.From the Fig. 1, we noticed that PS-LHR and ROT both performed better on denoising than the global PS recon. The flickering of brightness in the brain area in Fig .1a can be mostly avoided through PS-LHR and restricting the high rank to the speech region. The ROT also provided better SNR and clearer edges in the dynamics of the moving structures in the speech area.
Examining the temporal dynamics in Fig. 2A, the dynamic noise in the non-target brain region was largely reduced across a range of frequencies through PS-LHR (method b and c) compared to global PS (method a). In the speech region, the reconstruction maintained the high temporal resolution of the dynamic moving structures, matching the behavior of the global PS in this region.
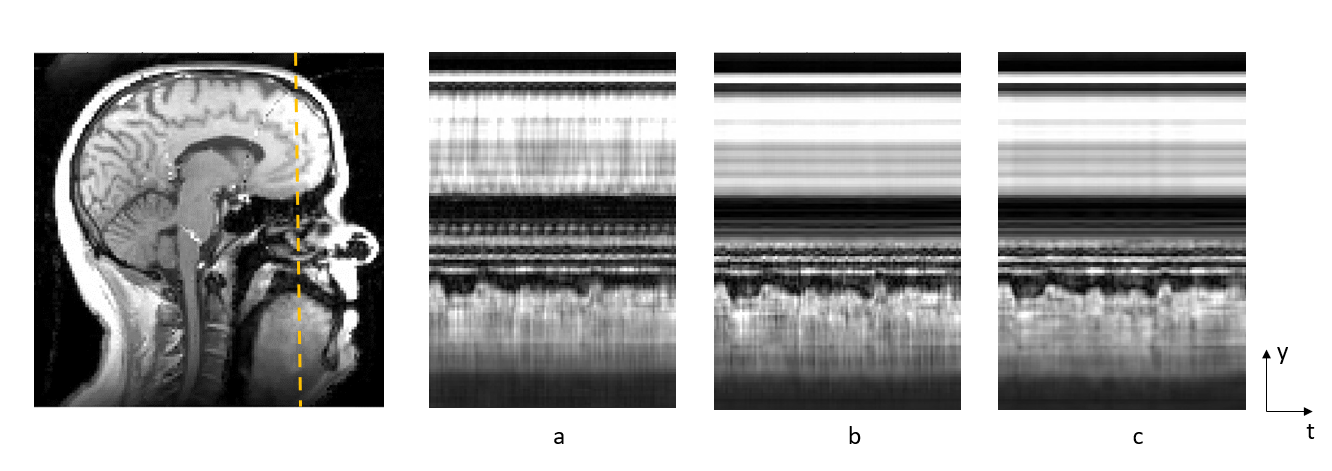
Fig. 3 shows the temporal profiles at the anteroposterior direction of mid-tongue region which reflect the temporal information of reconstructed images. The temporal denoising effect in the non-target regions such as the brain at the top is significant with both PS-LHR methods. By applying PS-LHR with ROT, a further reduction in noise and a better representation of the temporal dynamics is apparent in the speech regions at the bottom.
Discussion
The results have shown the advantages of PS-LHR on reducing high frequency noise in PS model based dynamic speech imaging. Further gains are possible by focusing the temporal navigators on the speech region through the ROT method. These two elements drastically improved the reconstruction quality of large-volume, isotropic, 3D speech imaging and may provide opportunities for further reducing the acquisition time.Conclusion
By applying the PS-model based regional-optimized reconstruction algorithm from highly sparse data, we were able to achieve better SNR and temporal dynamics in dynamic speech MRI.Acknowledgements
The National Institute of Dental & Craniofacial Research of the National Institutes of Health (R01DE027989). The content is solely the responsibility of the authors and does not necessarily represent the official views of the National Institutes of Health. This work was conducted in part at the Biomedical Imaging Center of the Beckman Institute for Advanced Science and Technology at the University of Illinois at Urbana-Champaign.References
1. Fu, M. , Zhao, B. , Carignan, C. , Shosted, R. K., Perry, J. L., Kuehn, D. P., Liang, Z. and Sutton, B. P. (2015), High‐resolution dynamic speech imaging with joint low‐rank and sparsity constraints. Magn. Reson. Med., 73: 1820-1832. doi:10.1002/mrm.25302
2. Liang Z-P. Spatiotemporal imaging with partially separable functions. In Proceedings of IEEE International Symposium on Biomedical Imaging, Washington D.C., USA, 2007. pp. 988–991.
3. Fu, M. , Barlaz, M. S., Holtrop, J. L., Perry, J. L., Kuehn, D. P., Shosted, R. K., Liang, Z. and Sutton, B. P. (2017), High‐frame‐rate full‐vocal‐tract 3D dynamic speech imaging. Magn. Reson. Med., 77: 1619-1629. doi:10.1002/mrm.26248
4. Jin R, Liang ZP, Sutton B. Increasing three-dimensional coverage of dynamic speech magnetic resonance imaging. Proc Intl Soc Magn Reson Med, 2021. p. 4175.
5. Jin R, Shosted RK, Xing F, et al. Enhancing linguistic research through2-mm isotropic 3D dynamic speech MRI optimized by sparse temporal sampling and low-rank reconstruction. Magn Reson Med. 2022;1-13. doi: 10.1002/mrm.29486
6. Y. Liu et al., “Improved low-rank filtering of magnetic resonance spectroscopic imaging data corrupted by noise and B0 field inhomogeneity,” IEEE Trans. Biomed. Eng., vol. 63, no. 4, pp. 841–849, Apr. 2016.
7. Kim, D, Cauley, SF, Nayak, KS, Leahy, RM, Haldar, JP. Region-optimized virtual (ROVir) coils: Localization and/or suppression of spatial regions using sensor-domain beamforming. Magn Reson Med. 2021; 86: 197– 212. https://doi.org/10.1002/mrm.28706
Figures