4944
Resting-state brain functional connectome disruptions in social anxiety disorder
Xun Zhang1 and Qiyong Gong1
1Department of Radiology, Huaxi MR Research Center (HMRRC), West China Hospital of Sichuan University, Chengdu, China
1Department of Radiology, Huaxi MR Research Center (HMRRC), West China Hospital of Sichuan University, Chengdu, China
Synopsis
Keywords: Psychiatric Disorders, fMRI (resting state), gray matter
Social anxiety disorder (SAD) is a prevalent disabling psychiatric condition, for which the underlying neurobiological mechanisms remain poorly understood. Herein, we used group independent component analysis to characterize the functional architecture of brain resting-state networks (RSNs) and investigate between-group differences in intra- and inter-network functional network connectivity (FNC), as well as their associations with clinical characteristics and their potential diagnostic value. As a result, we observed widespread intra-/inter-network FNC abnormalities among high-order and primary perceptual RSNs in SAD, which were correlated to the symptom severity and illness duration, and allowed individual classification of SAD versus healthy controls with significant accuracy.Introduction
As a highly prevalent and disabling disease, social anxiety disorder (SAD) is characterized by disproportionate fear, anxiety and avoidance behavior in social situations, for which the underlying neurobiological mechanisms remain poorly understood. Although aberrant brain regional activities were reported in SAD, the findings have been subject to too small sample sizes, demographic confounders and methodological heterogeneity especially for confounding effects of various task performance and selection biases from regions of interest-based analyses, while little is known about resting-state functional connectivity at the macroscale network level 1. Taking these issues into consideration, the current study aimed to use a multivariate data-driven method to characterize functional network connectivity (FNC) abnormalities in a relatively large and homogenous sample of SAD patients, and assess their potential clinical relevance and diagnostic value at the individual level.Methods
Subjects and image acquisition: This study confirmed to the ethical principles of the Declaration of Helsinki and was approved by the Medical Research Ethics Committee of West China Hospital of Sichuan University. As the power analysis using G Power software indicated that we needed a sample of at least 102 subjects to detect a medium-sized effect (Cohen's d = 0.5, α = 0.05, 1-β = 0.8) for an independent-sample t test 2, 49 non-comorbid adult patients with SAD (aged 24.6 ± 5.3 years; 19 female) and 53 demography-matched healthy controls (HC) (aged 23.4 ± 3.3 years; 22 female) were recruited to obtain high-resolution T1-weighted images and resting-state functional magnetic resonance imaging (rs-fMRI) data using a spoiled gradient-recalled sequence and gradient echo-planar imaging sequence respectively on a 3.0-Tesla MR scanner (Siemens Trio, Erlangen, Germany) with a 12-channel head coil.Image processing: Rs-fMRI data were preprocessed through the Data Processing Assistant for Resting-State fMRI (DPARSF 4.3) 3; then, spatial group independent component analysis (GICA) was performed to parcellate the rs-fMRI data using GIFT software, and the number of independent components (ICs) was estimated automatically by the software, in which spatial GICA decompose the individual data into spatial ICs with a unique time course profile 4. Eventually, 15 out of 24 ICs were characterized as 15 RSNs, including anterior and posterior default mode network, left and right frontoparietal network, dorsal and ventral attention network, anterior and posterior salience network, subcortical network, auditory network, dorsal and ventral sensorimotor network, medial, lateral and posterior visual network (Figure 1).
Network-wise functional connectivity analyses: Voxel-wise comparisons of intra-network FNC between SAD patients and HC were performed using independent-sample t test with age, sex and mean frame-wise displacement (FD) as covariates in SPM12, with a significance threshold of a voxel-wise value of P < 0.001 and a family-wise error‐corrected P < 0.05 at cluster level 5, while between-group differences of inter-network FNC were compared using independent-sample t test after controlling for age, sex and mean FD with a significance threshold of false discovery rate-corrected P < 0.05 6. Furtherly, a partial correlation analysis was conducted to identify the associations between the intra-/inter-network FNC abnormalities and clinical characteristics, and support vector machine (SVM) analysis was performed to explore the potential diagnostic value of intrinsic FNC by testing how well FNC could differentiate SAD versus HC at the individual level 7.
Results
SAD patients showed widespread intra-network FNC abnormalities mainly in the default mode network, the subcortical network and the perceptual system (i.e. sensorimotor, auditory and visual networks) (Figure 2), and large-scale inter-network FNC abnormalities among those high-order and primary perceptual RSNs (Figure 3). Besides, some aberrant FNC signatures were correlated to the symptom severity and disease duration in SAD cohort, suggesting a pathophysiological relevance. Furthermore, the accuracy of SVM classification for SAD versus HC were significantly above chance (P < 0.001); the intra-network FNC demonstrated the best performance with total accuracy 86.7%, sensitivity 91.3% and specificity 88.5% (Figure 4).Discussion
At the level of intra-network FNC, abnormalities in the high-order RSNs such as default mode network and subcortical network may underlie the functional cognitive models of disturbed self-evaluative and self-referential processes (e.g. maladaptive self-focused attention, emotional hyperarousal in combination with defective top-down regulation) 8 and neural approach-avoidance motivation system in SAD 9; while aberrant FNC in the perceptual/sensory system (i.e. sensorimotor, auditory and visual networks) may be related to perceptual impairments and compromised social information processing such as gaze avoidance towards emotional stimuli 10, and abnormal facial emotion processing in SAD 11.At the level of inter-network FNC, dysconnectivity within and across large-scale higher-order cognitive control networks and the primary perceptual system may underlie hypervigilance toward threateningly social stimuli, persistent heightened attentiveness to sensory input, disrupted perceptual analysis of sensory events and dysfunctional cognitive control in SAD 12.
Conclusion
Our findings complement and extend earlier SAD neuroimaging studies by identifying the involvement of distinct patterns of functional synchronization abnormalities within and across large-scale resting-state networks in SAD, which may reflect imbalance of network bottom-up response and top-down regulation in cognitive, emotional and sensory domains. These results provide functional network insights into the neurobiological substrates of SAD, and may advance the development of reliable and objective neurofunctional biomarkers for early diagnosis, targeted intervention and therapeutic efficacy evaluation in SAD.Acknowledgements
This study was supported by National Key R&D Program of China (2022YFC2009900) and the National Natural Science Foundation of China (81621003, 81761128023, 81820108018, 82027808). The funding sources had no involvement in the study design, data collection and analysis, results interpretation or writing of the paper.The authors would also like to express their sincere appreciation to supervisor and colleagues for valuable advice. We also thank all the participants in this study.
References
1. Mizzi S, Pedersen M, Lorenzetti V, et al. Resting-state neuroimaging in social anxiety disorder: a systematic review. Mol Psychiatry. 2022;27:164-179.2. Faul F, Erdfelder E, Lang AG, et al. G*Power 3: a flexible statistical power analysis program for the social, behavioral, and biomedical sciences. Behavior research methods. 2007;39:175-191.
3. Chao-Gan Y, Yu-Feng Z. DPARSF: A MATLAB Toolbox for "Pipeline" Data Analysis of Resting-State fMRI. Front Syst Neurosci. 2010;4:13.
4. Kiviniemi V, Starck T, Remes J, et al. Functional segmentation of the brain cortex using high model order group PICA. Hum Brain Mapp. 2009;30:3865-3886.
5. Woo CW, Krishnan A, Wager TD. Cluster-extent based thresholding in fMRI analyses: pitfalls and recommendations. NeuroImage. 2014;91:412-419.
6. Benjamini Y, Yekutieli D. The control of the false discovery rate in multiple testing under dependency. ANNALS OF STATISTICS. 2001;29:1165-1188.
7. Cortes C, Vapnik V. Support-vector networks. Machine Learning. 1995;20:273-297.
8. Cremers HR, Roelofs K. Social anxiety disorder: a critical overview of neurocognitive research. Wires Cogn Sci. 2016;7:218-232.
9. Xu J, Van Dam NT, Feng C, et al. Anxious brain networks: A coordinate-based activation likelihood estimation meta-analysis of resting-state functional connectivity studies in anxiety. Neurosci Biobehav Rev. 2019;96:21-30.
10. Weeks JW, Howell AN, Goldin PR. Gaze avoidance in social anxiety disorder. Depress Anxiety. 2013;30:749-756.
11. Machado-de-Sousa JP, Arrais KC, Alves NT, et al. Facial affect processing in social anxiety: tasks and stimuli. J Neurosci Methods. 2010;193:1-6.
12. Miskovic V, Schmidt LA. Social fearfulness in the human brain. Neurosci Biobehav Rev. 2012;36:459-478.
Figures
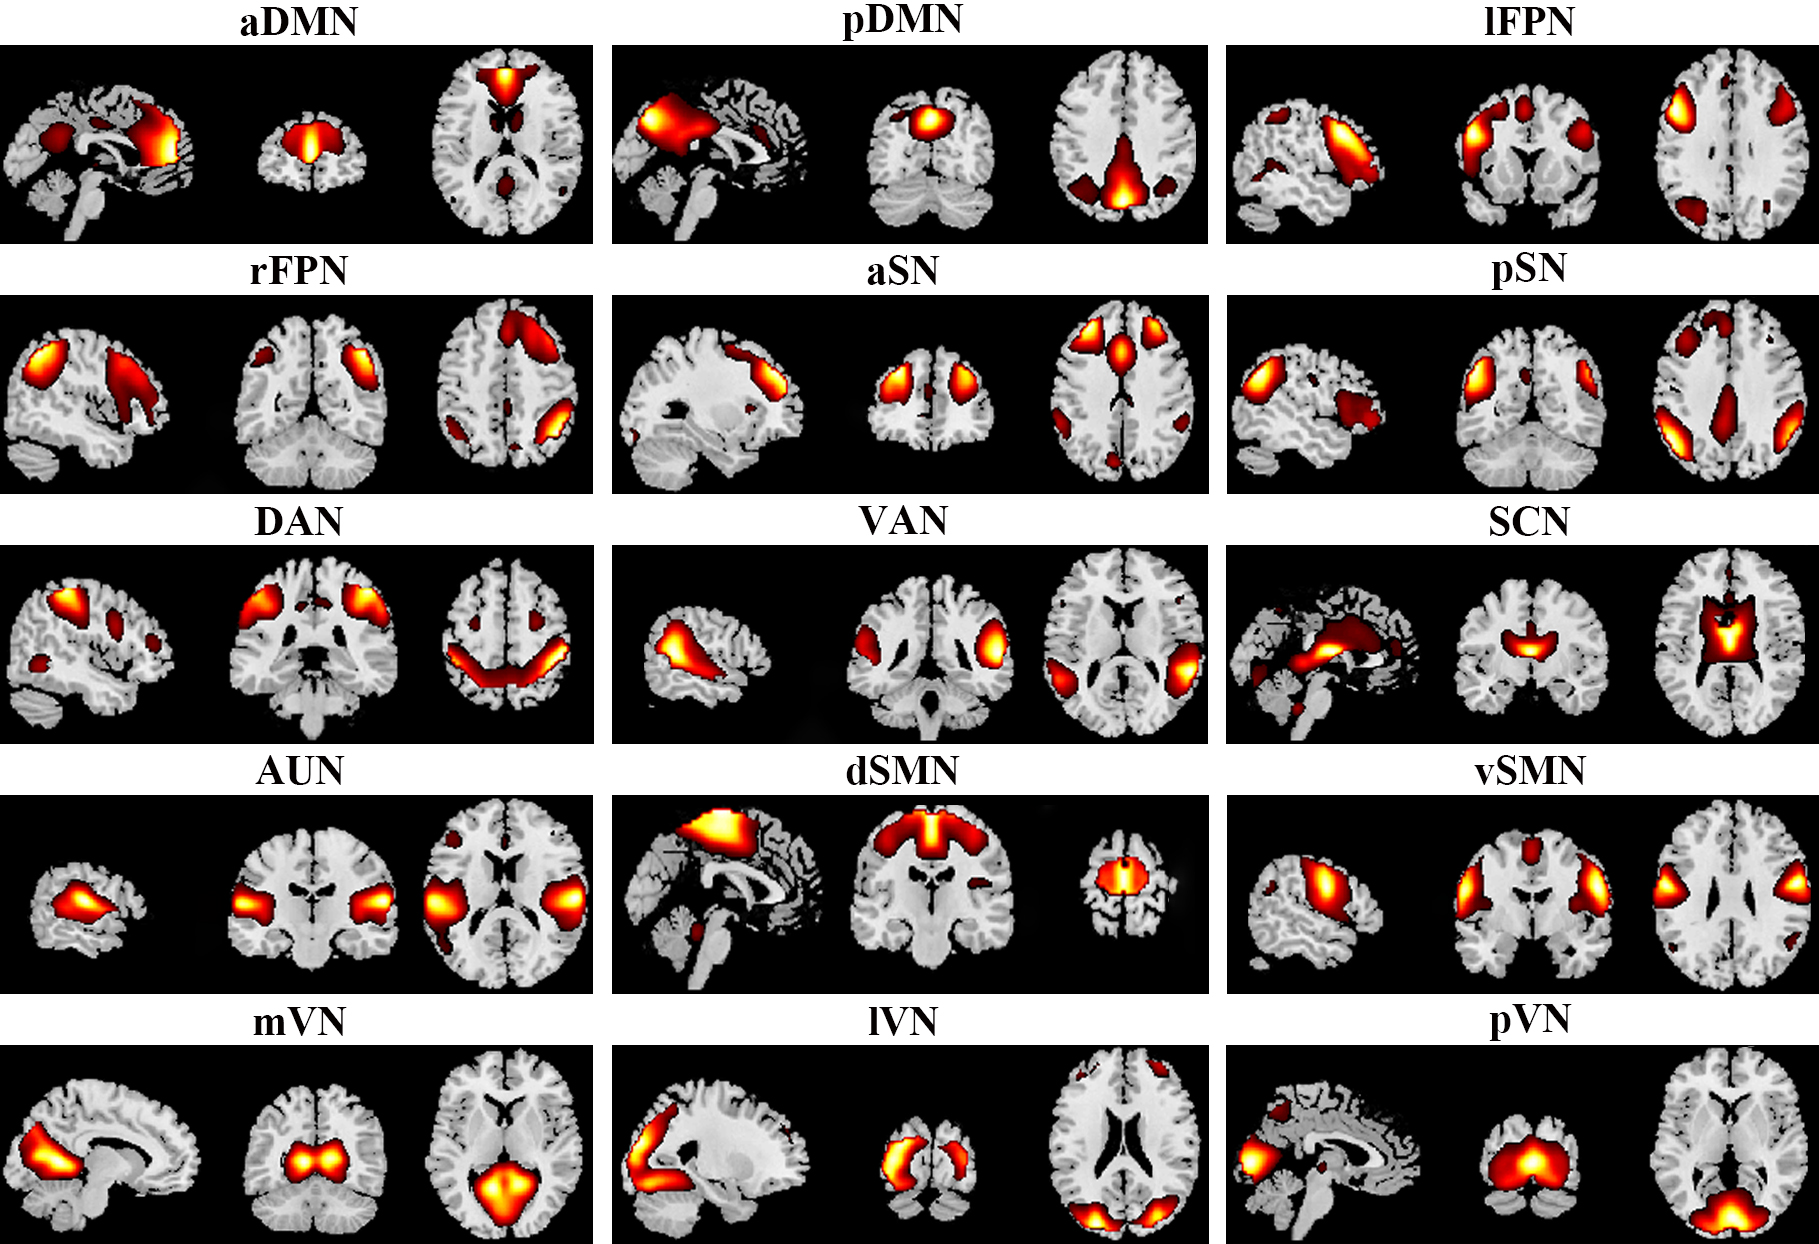
Figure 1. Spatial maps of 15 selected independent components. Abbreviations: aDMN, anterior default mode network; aSN, anterior salience network; AUN, auditory network; DAN, dorsal attention network; dSMN, dorsal sensorimotor network; lFPN, left frontoparietal network; lVN, lateral visual network; mVN, medial visual network; pDMN, posterior default mode network; pSN, posterior salience network; pVN, posterior visual network; rFPN, right frontoparietal network; SCN, subcortical network; VAN, ventral attention network; vSMN, ventral sensorimotor network.
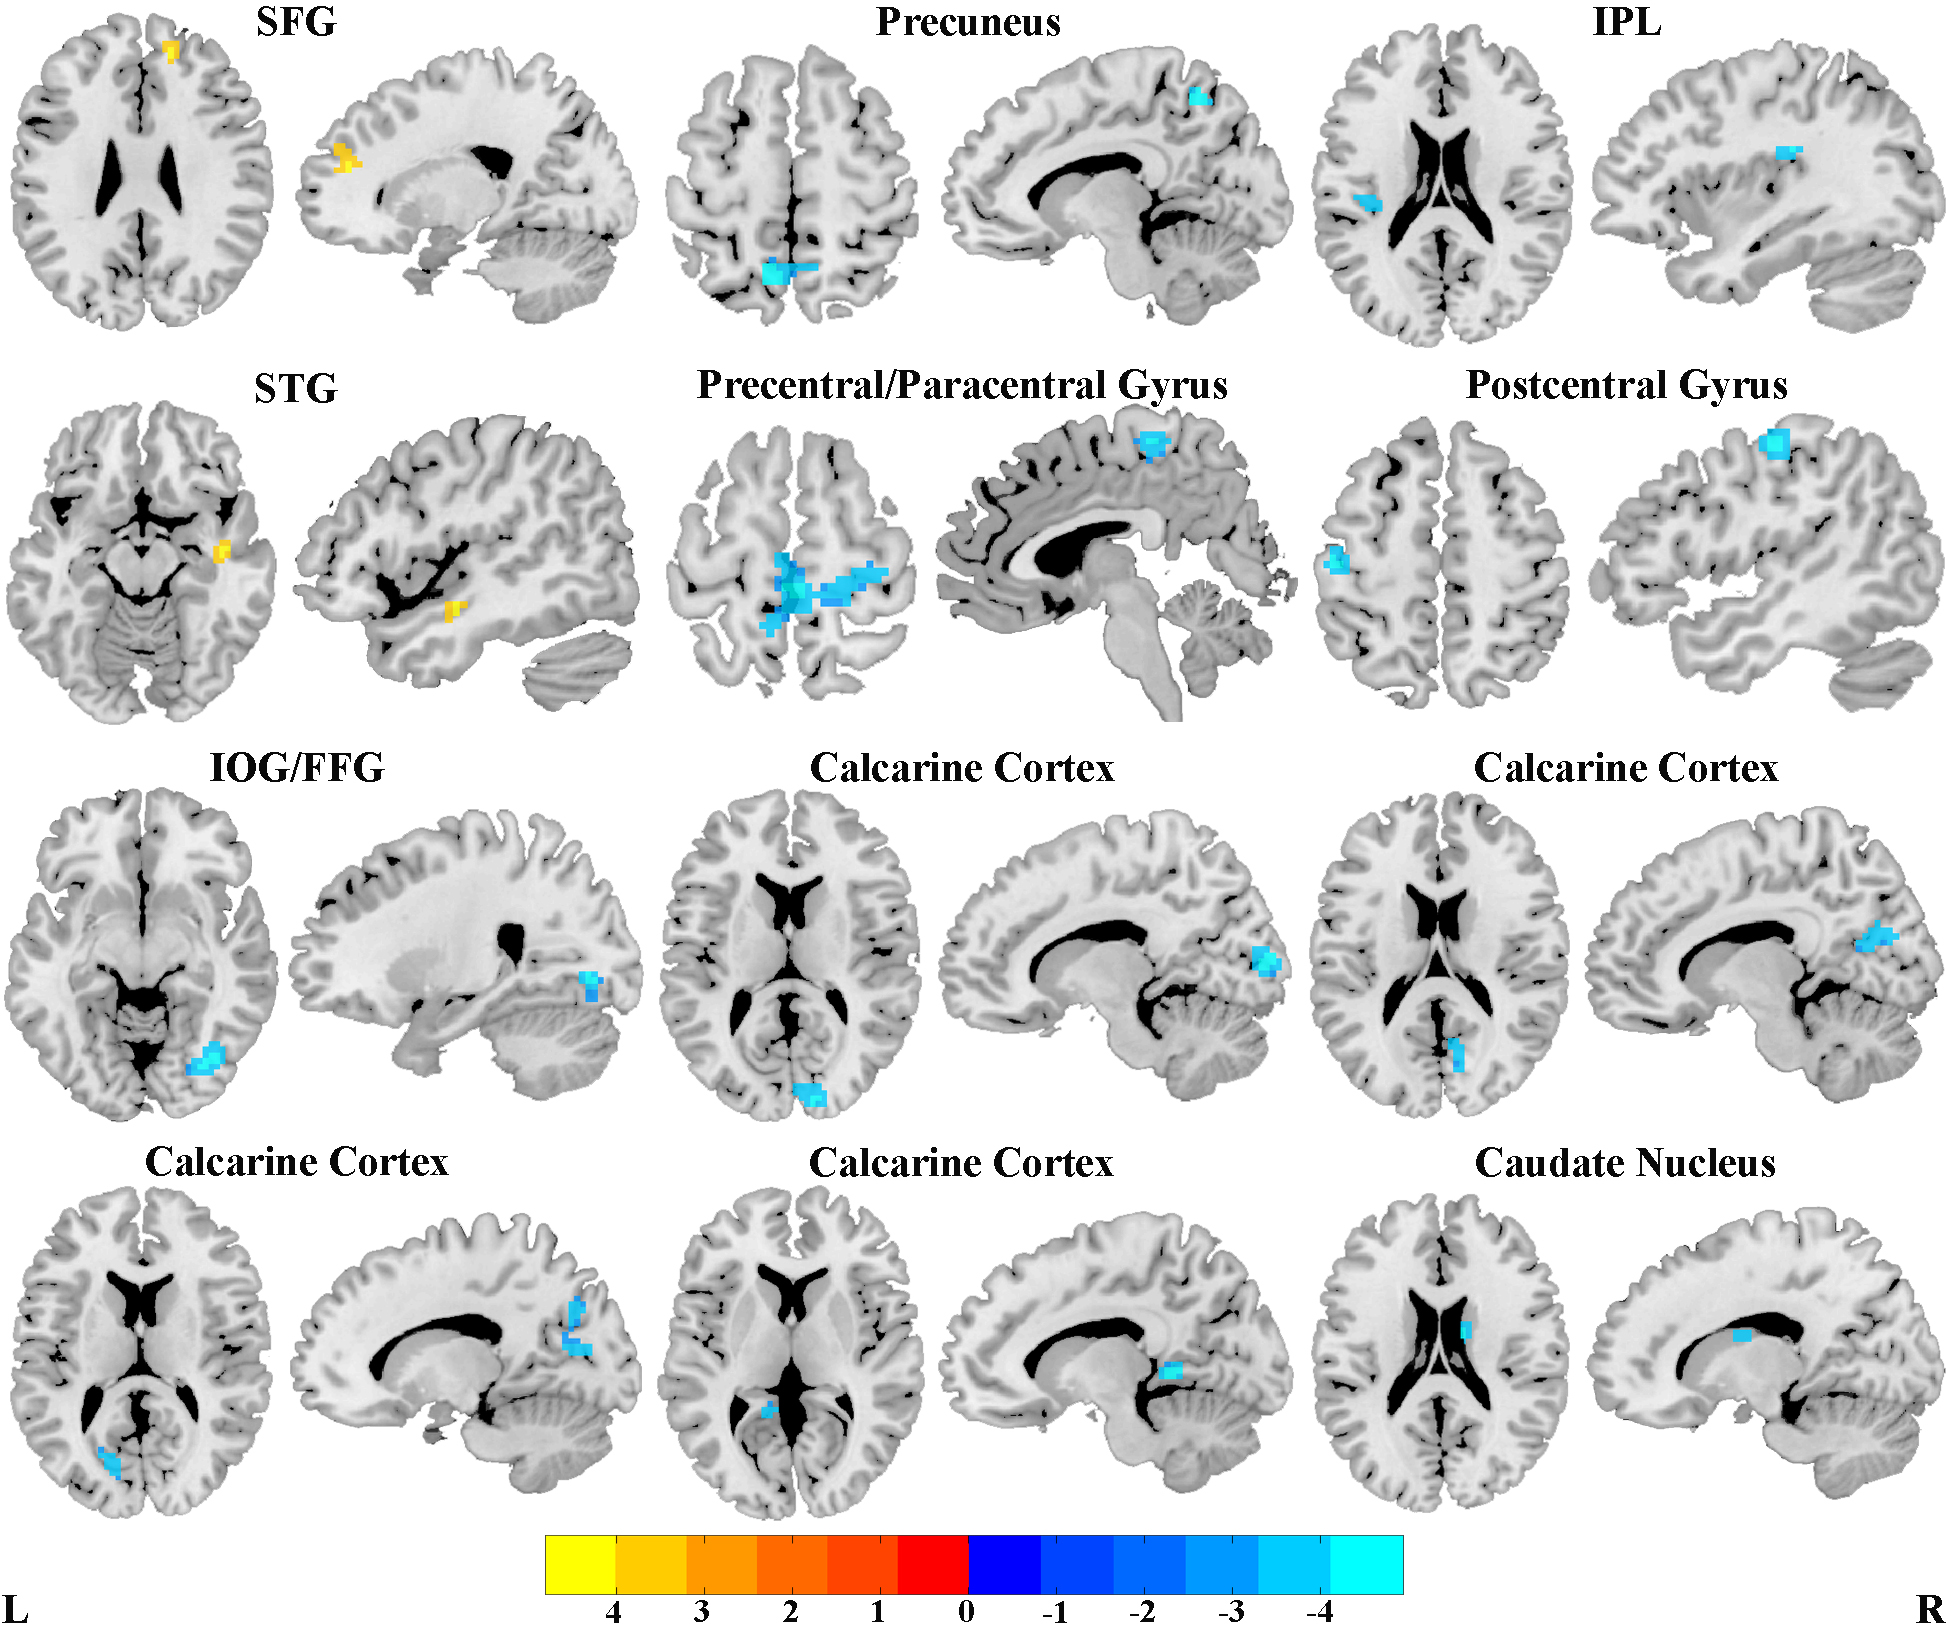
Figure 2. Brain regions with significant differences of intrinsic intra-network functional connectivity between social anxiety disorder patients and healthy controls.
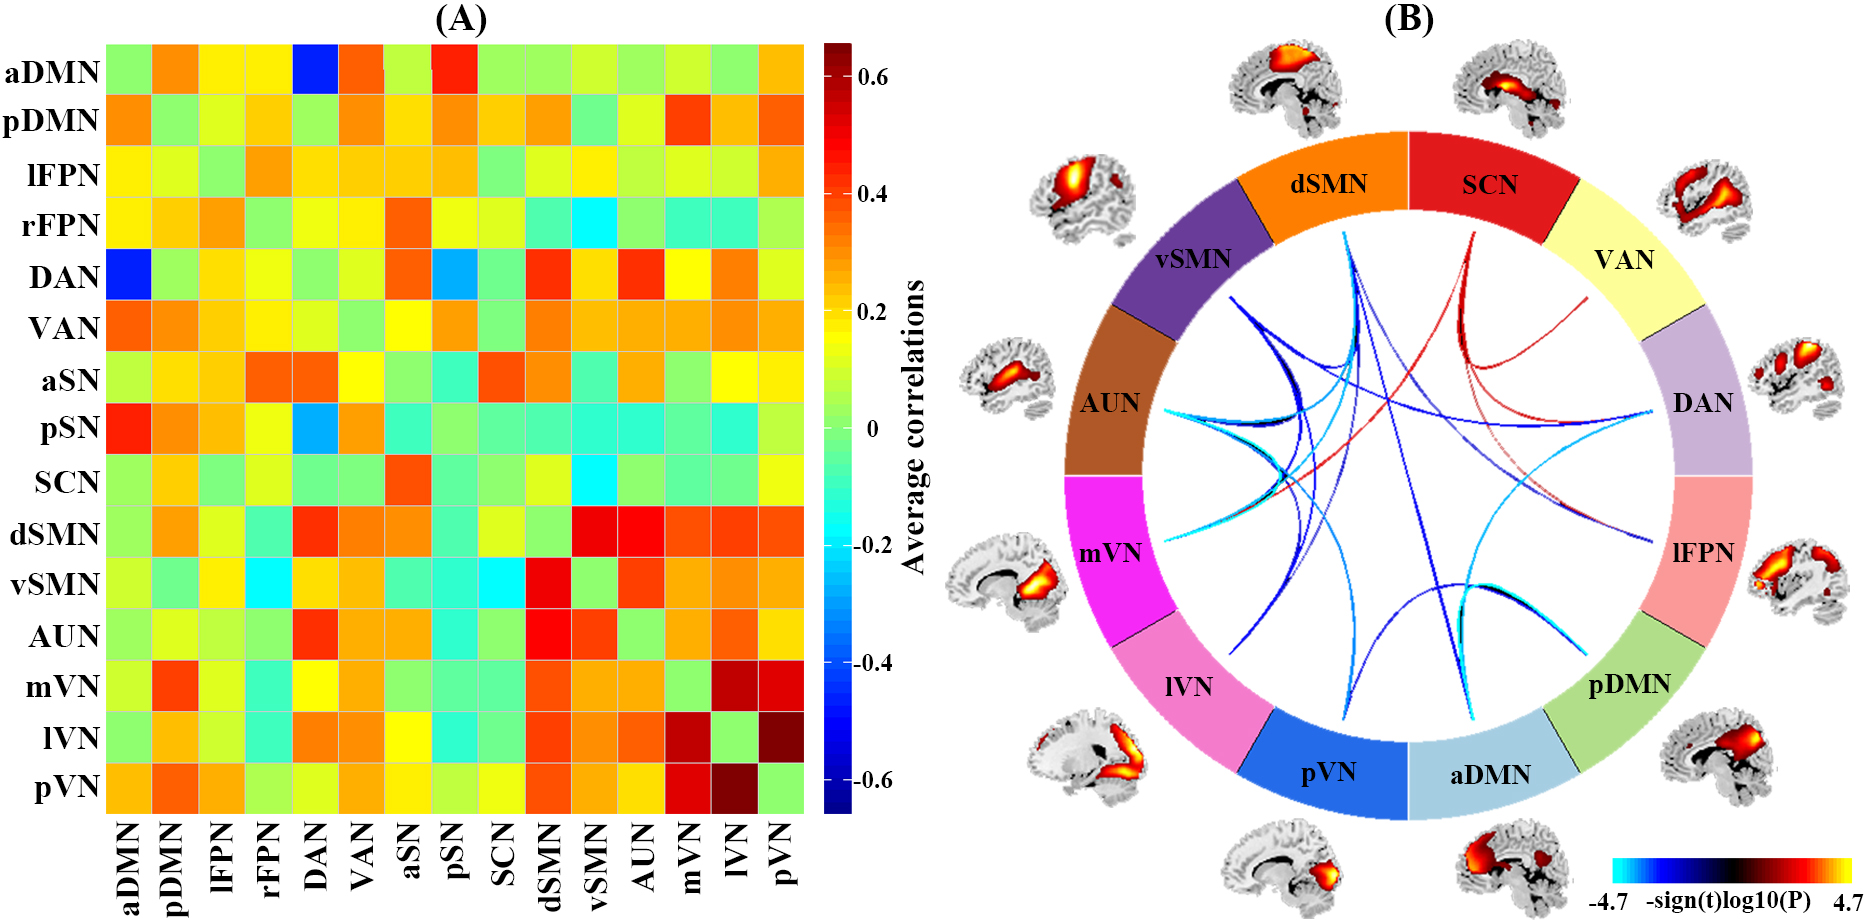
Figure 3. Results of inter-network functional connectivity analyses. (a) Inter-network functional connectivity matrix. (b) Between-group differences of inter-network functional connectivity between social anxiety disorder patients and healthy controls.
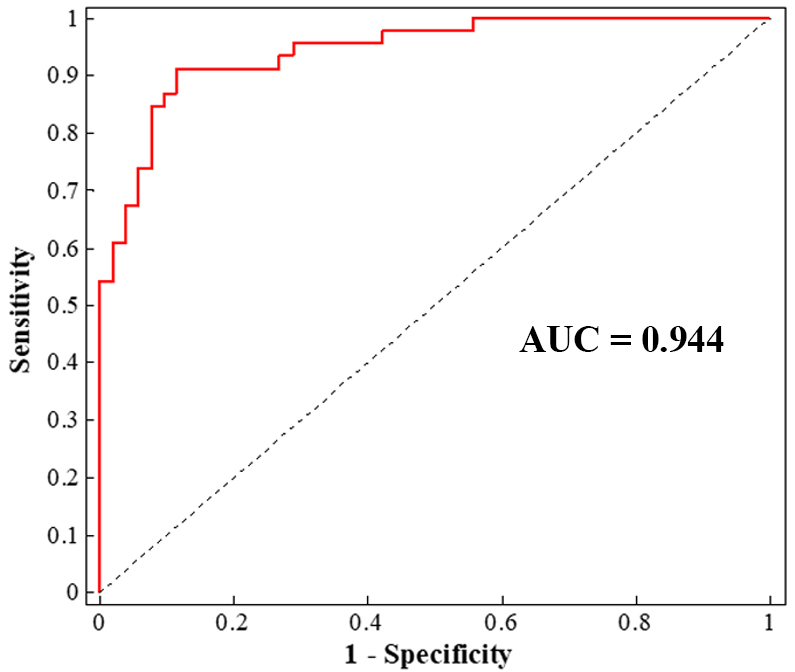
Figure 4.Single-subject classification of social anxiety disorder patients versus healthy controls.
DOI: https://doi.org/10.58530/2023/4944