4942
White matter alterations in patients with major depressive disorder: A Quantitative synthetic MRI Study1Medical Imaging Department, Nanfang Hospital, Guangzhou, China, 2MR Research, GE Healthcare, Beijing, China, Beijing, China, 3Department of Radiology, the First Affiliated Hospital of Kunming Medical University, Kunming, China, 4Department of Radiology, Zengcheng Branch of Nanfang Hospital, Guangzhou, China, 5Department of Radiology, First People's Hospital of Foshan, Foshan, China
Synopsis
Keywords: Psychiatric Disorders, Brain, Major depressive disorder; white matter microstructure
Major depressive disorder (MDD) is a severe mental disorder with unclear pathophysiology mechanism. The present study aimed explore white matter (WM) microstructure alterations in MDD patients using synthetic MRI technique. The results showed shorter T1 relaxation time in several deep WM regions, while extensive myeline content was found in left anterior limb of internal capsule in patients with MDD. Thus, we concluded that WM alterations caused by MDD can be revealed by quantitative MRI parameters.Introduction
Major depressive disorder (MDD) a chronic mental disorder leading to the abnormalities of affect and mood, cognition, and psychomotor activity. Yet, its physiological and pathological mechanisms are not fully understood1. White matter (WM), which connects regions of the brain anatomically and functionally, has been considered to play an important part in MDD2. However, the alterations of WM microstructure, which can be revealed by quantitative MRI parameters (T1, T2, etc.)3, have not been well investigated in MDD patients. Previous study proposed a novel technique, named synthetic MRI (SyMRI), which can obtain B1-corrected T1 mapping and T2 mapping images in a single 5-6 min scanning4. Therefore, the present aimed to quantify T1 and T2 values of brain WM in patients with MDD using the SyMRI technique.Methods
Sixteen patients with MDD (age: 18 to 34 years; gender: 2 males and 14 females) and 49 healthy control (HC) subjects (age: 21 to 35 years; gender: 16 males and 33 females) were recruited from Nanfang Hospital. No difference in age or gender was found between the two groups (Table 1). This study was approved by the local ethics committee and all participants singed informed consent forms prior the study.MRI data was obtained on a 3.0T scanner (SIGNA Architect GE Healthcare, WI, USA) using 48-channel head coils. For each participant, T1-weight (T1w) images with an isotropic resolution of 1.00 mm were acquired using a sagittal three-dimensional magnetization prepared rapid gradient echo (MP-RAGE) sequence. Quantitative MRI parameters were acquired using the SyMRI technique which is based on an axial two-dimensional multiple-dynamic multiple-echo (MDME) sequence. The major parameters of MDME sequence included: repetition time = 10,205.0 ms; echo time =11.3 ms; flip angle = 20°; echo train length = 16; image resolution = 2.0 mm×2.0 mm; and slice thickness/gap = 2/0 mm.
The T1 and T2 relaxation time in each WM region was obtained as follow: (1) the postprocessing software (SyntheticMR, v11.2.2) was used to calculate T1-, T2- and myelin- mapping (T1m, T2m and Myn) images. (2) Liner rigid transformation matrix between T1m and T1w and non-linear warped images between T1w images and T1w template images in MNI were calculated using the Advanced Normalization Tools (ANTs). (3) Considering T1m, T2m and Myn images were in the spaced, the above linear transformation matrix and non-linear warped images were applied to T2m and Myn images to achieve MNI space transformation. (4) Mean T1 value, T2 value and myelin content in each WM region were extracted using the JHU DTI-based white-matter atlas. Independent samples t-tests and nonparametric tests were used to compare quantitative variables, while the Chi-square test was used to compare qualitative variables. All the statistical analysis was performed in SPSS (v26.0, IBM Corporation, Armonk, New York).
Results
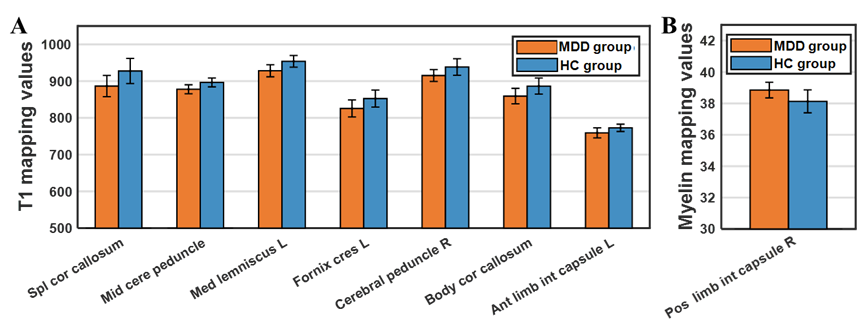
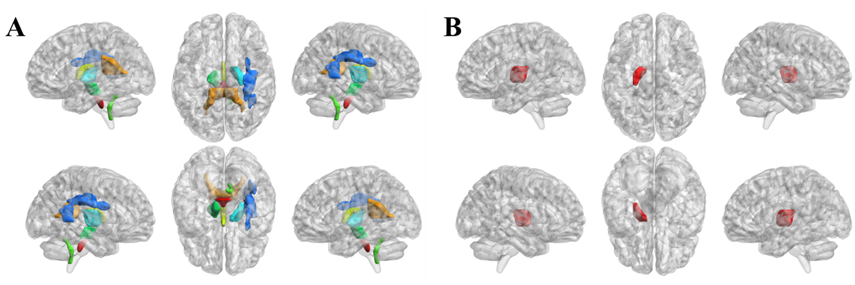
The difference in quantitative MRI parameters between MDD and HC groups were showed in Table 2 and Fig. 1. And corresponding WM regions with group difference were showed in Fig. 2. Compared with HC subjects, decreased T1 relaxation time in several WM regions were observed, while no T1 increase was found. Additionally, lower myelin content was found in left anterior limb of internal capsule in the MDD group. There was no WM area with altered T2 relaxation time found in MDD.Discussion
In the present, several WM regions showed decreased T1 mapping value in MDD. Iron deposition in gray matter, which is related to T1 decrease, has been reported in MDD and shows positive correlation with depression severity5. Increased iron content has also found in some neurodegeneration disease, such as multiple sclerosis6. Thus, the observation of shorter T1 relaxation time in WM could be associated with iron deposition, which may lead to cognitive impairment in MDD patients. Moreover, WM regions with shorter T1 were mainly located in deep WM regions that contain plenty of association and projection fiber bundles. Considering that these fiber bundles connect to several long-distance brain regions, the T1 alterations in these WM areas may contribute to wide brain dysfunction. Interestingly, increased myeline content was found in left anterior limb of internal capsule in MDD group. It may indicate the underlying compensation mechanism in MDD.Conclusion
The quantitative MR imaging could reflect the WM microstructure alterations, which can extend our knowledge about the brain changes in MDD patients.Acknowledgements
This study was supported by the National Natural Science Foundation of China grant 82172012.References
1. Cuijpers P, Stringaris A, Wolpert M. Treatment outcomes for depression: challenges and opportunities. Lancet Psychiatry. 2020;7(11):925–927.
2. Kieseppä T, Eerola M, Mäntylä R, et al. Major depressive disorder and white matter abnormalities: A diffusion tensor imaging study with tract-based spatial statistics. J Affect Disorders. 2010;120(1–3):240–244.
3. Lebel C, Deoni S. The development of brain white matter microstructure. Neuroimage. 2018;182207–218.
4. Warntjes JBM, Leinhard OD, West J, Lundberg P. Rapid magnetic resonance quantification on the brain: Optimization for clinical usage. Magn Reson Med. 2008;60(2):320–329.
5. Yao S, Zhong Y, Xu Y, et al. Quantitative Susceptibility Mapping Reveals an Association between Brain Iron Load and Depression Severity. Front Hum Neurosci. 2017;11442.
6. Wisnieff C, Ramanan S, Olesik J, Gauthier S, Wang Y, Pitt D. Quantitative susceptibility mapping (QSM) of white matter multiple sclerosis lesions: Interpreting positive susceptibility and the presence of iron. Magn Reson Med. 2015;74(2):564–570.
Figures