4941
Quantitative Study of Brain Iron Deposition in Major Depression Disorder1Department of Radiology, Qilu Hospital of Shandong University, Jinan, China, 2Department of Anatomy and Neurobiology, Cheeloo College of Medicine, Shandong University, Jinan, China, 3MR Research China, GE Healthcare, Beijing, China, 4Department of Orthopedic Surgery, Qilu Hospital of Shandong University, Jinan, China
Synopsis
Keywords: Psychiatric Disorders, Quantitative Susceptibility mapping
The occurrence of depression may be related to the accumulation of iron in the brain. T1-weighted images were linearly registered into the QSM space, and then six regions of interest (ROIs) were obtained using the automated segmentation pipeline. Susceptibility values of major depression disorder (MDD) and healthy control (HC) groups were compared using the two-sided Student's t-test. The susceptibility of the left amygdala and right putamen in MDD patients were significantly increased, and positively correlated with the severity of depression and insomnia, respectively. The increased iron in the left amygdala may be a new biomarker for MDD.Introduction
Depression is a common illness worldwide, characterized by severe and persistent low mood, often accompanied by anxiety, physical discomfort and sleep disturbances, which negatively affect people's regular lives1. Previous researches found that lower serum ferritin concentration potentially disrupted the iron supply in the brain, which contributed to the emergence of depression disorders in adolescents2. Some neuroimaging studies also demonstrated that elevated concentration of iron in the brain may be associated with the occurrence of depression3–5. Although these results are inconsistent, they all suggest a strong link between abnormal iron levels in the brain and depression, which needs further investigation. Quantitative susceptibility mapping (QSM) is a promising MRI technique that has been proposed to quantify the spatial distribution of magnetic susceptibility in biological tissues, which correlates positively with the average iron levels in brain tissue and can identify iron deposition in the brain, particularly in gray matter (GM) nucleus. Therefore, this study aimed to quantitatively evaluate the iron content of critical brain regions in major depression disorder (MDD) patients using QSM, and to examine the potential of this technique in distinguishing between MDD patients and healthy control (HC) subjects.Materials and Methods
Subjects32 patients (17 males, 15 females, aged 24.21 ± 4.43) with MDD and 32 HC participants (17 males, 15 females, aged 23.03 ± 2.76) were enrolled for QSM MRI scans to measure the brain iron. Patients were scored using the 17-item Hamilton Rating Scale for Depression (HAMD-17) and the Insomnia Severity Index (ISI) to assess the degree of depression and insomnia. Each subject underwent structural brain MRI and QSM measurements.
MRI experiments
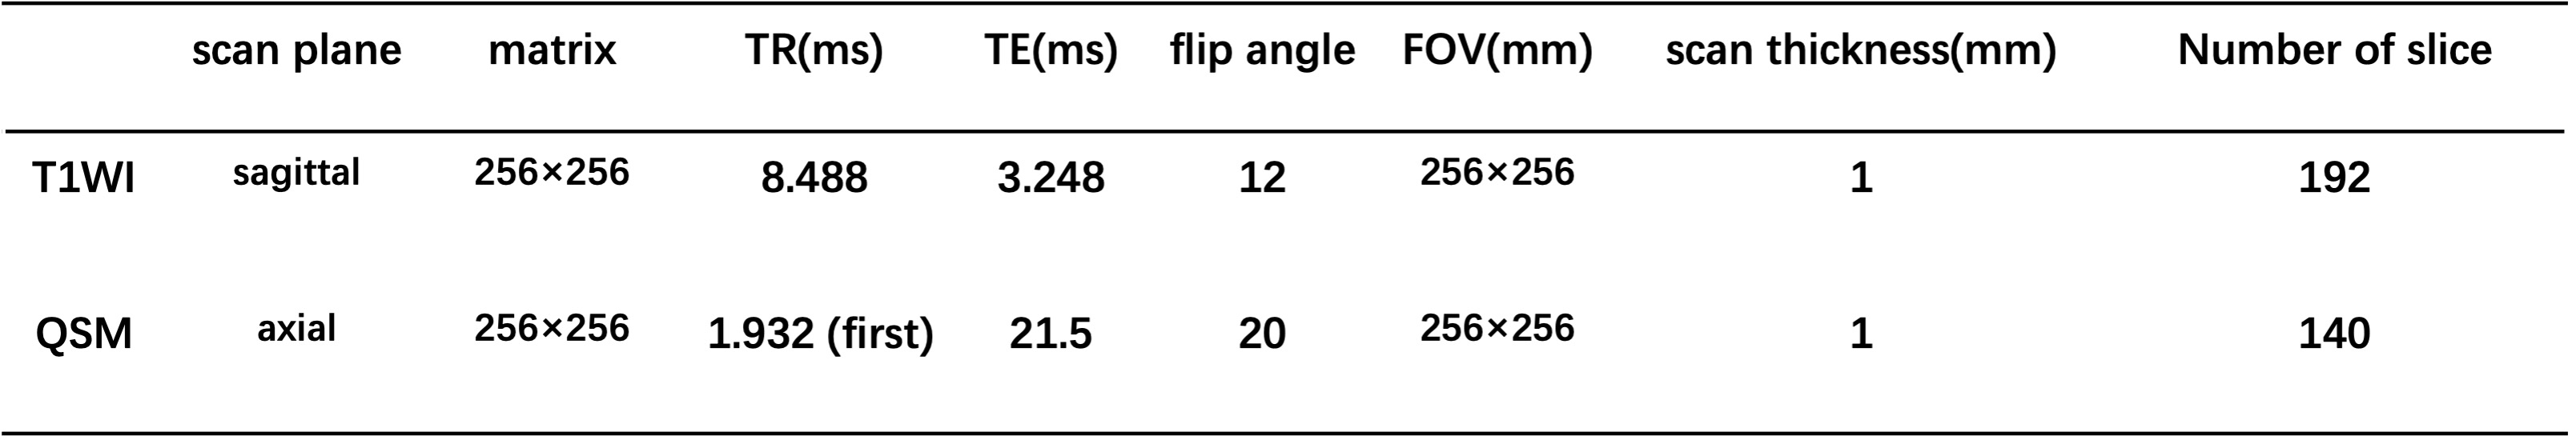
All experiments were performed on a 3.0T MRI scanner (GE Discovery MR750, USA) with a 24-channel head coil. In addition to routine brain T1W MRI, QSM imaging was also performed for each participant. Three-dimensional spoiled gradient echo-based QSM imaging was performed for each participant with scan parameters as follows: number of TEs = 8 (first TE = 1,932 msec, TE interval = 4.6 msec), TR = 21.5 msec, FOV = 256 mm × 256 mm, flip angle = 20°, matrix size = 256 × 256, slice thickness = 1 mm, number of slices =140, scanning time = 4 minutes 38 seconds. The detailed sequence parameters can be seen in the Table1.
Image analysis
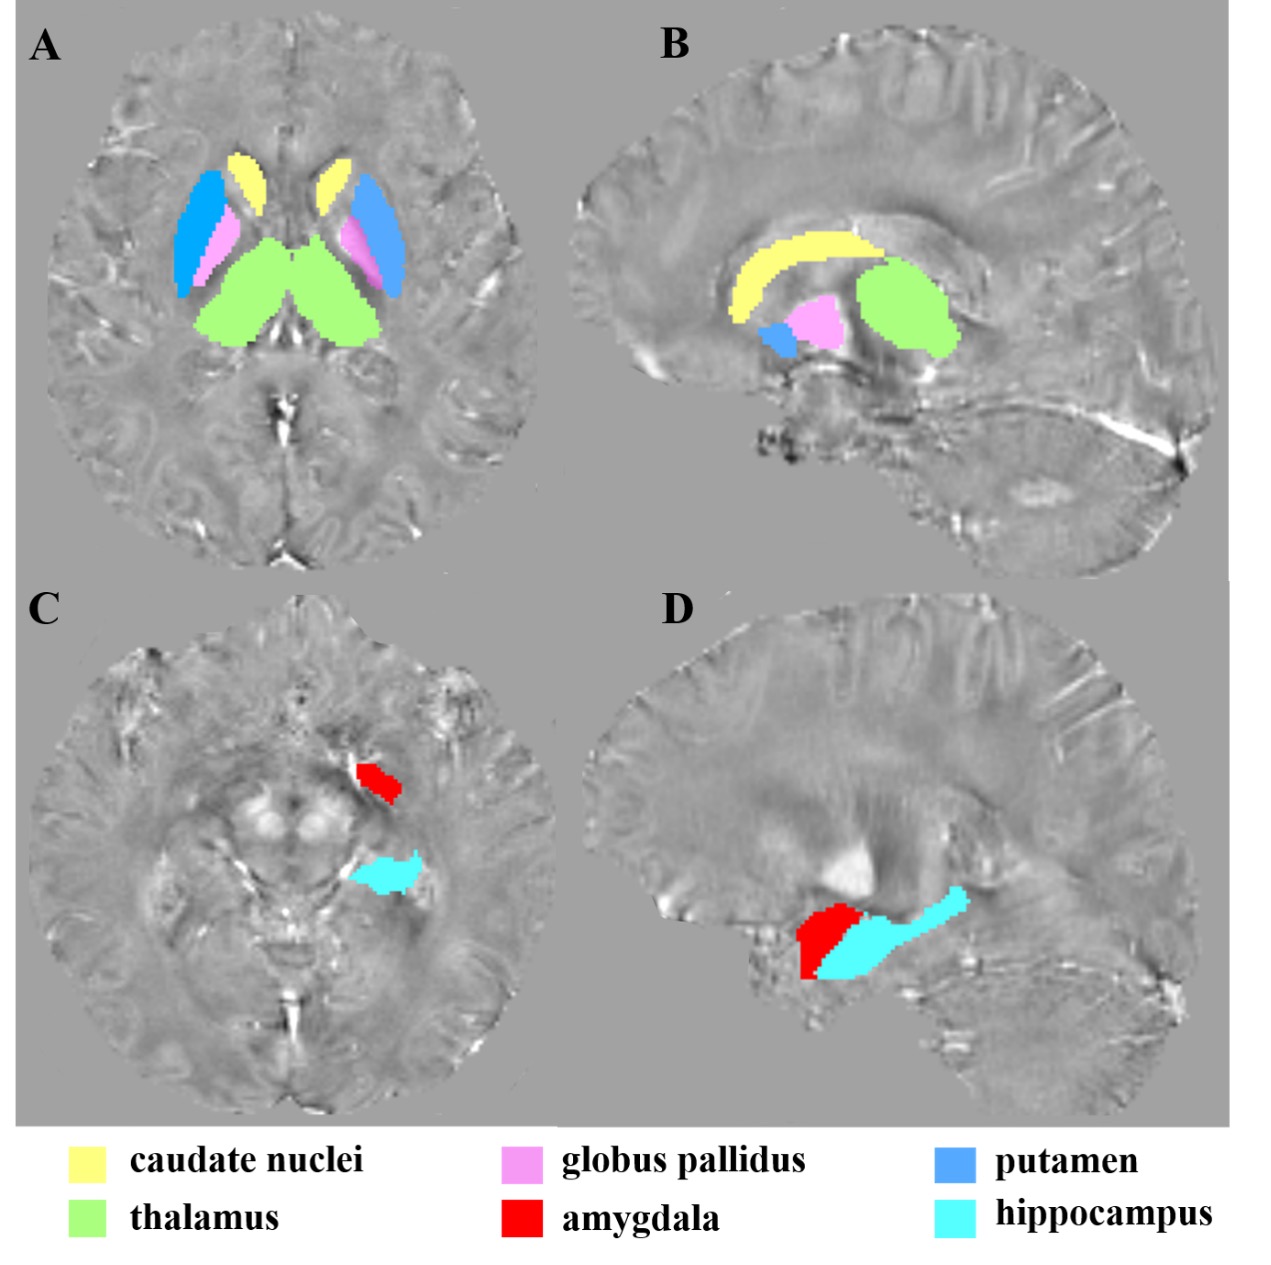
QSM maps were calculated from magnitude and phase data using STI Suite6. T1-weighted images were also obtained and coregistered to the QSM space using FSL FLIRT for brain segmentation. Then, a fast and accurate deep learning-based neuroimaging pipeline was used for the automated segmentation of structural brain MRI scans, quantifying tissue magnetic susceptibility (iron measure) in each parcellation region. Here, the advanced deep learning architecture was specifically tailored to precisely segment both cortical and subcortical structures and capable of dividing the whole brain into 95 classes7. From the brain parcellation map, mean susceptibility values of six regions of interest (ROIs) were obtained (Figure1), including the amygdala, hippocampus, thalamus, caudate, putamen, and globus pallidus, and used to make a representative comparison of concentration of iron in the brain between MDD and HC groups.
Statistical analysis
SPSS software, version 22.0 (IBM, Armonk, New York) was used for statistical analysis. In our analysis, we tested the normality of distributions using the Shapiro–Wilk test before further statistical detection, and used standard parametric statistics to draw statistical inferences only when a Gaussian distribution was confirmed for each dependent variable. Susceptibility differences of the ROIs in MDD patients and HC subjects were compared using two-sided Student's t-test. Pearson's correlation analysis was separately performed to assess the relationships of susceptibility with HAMD and ISI scores. Significant threshold was set at p < 0.05.
Results
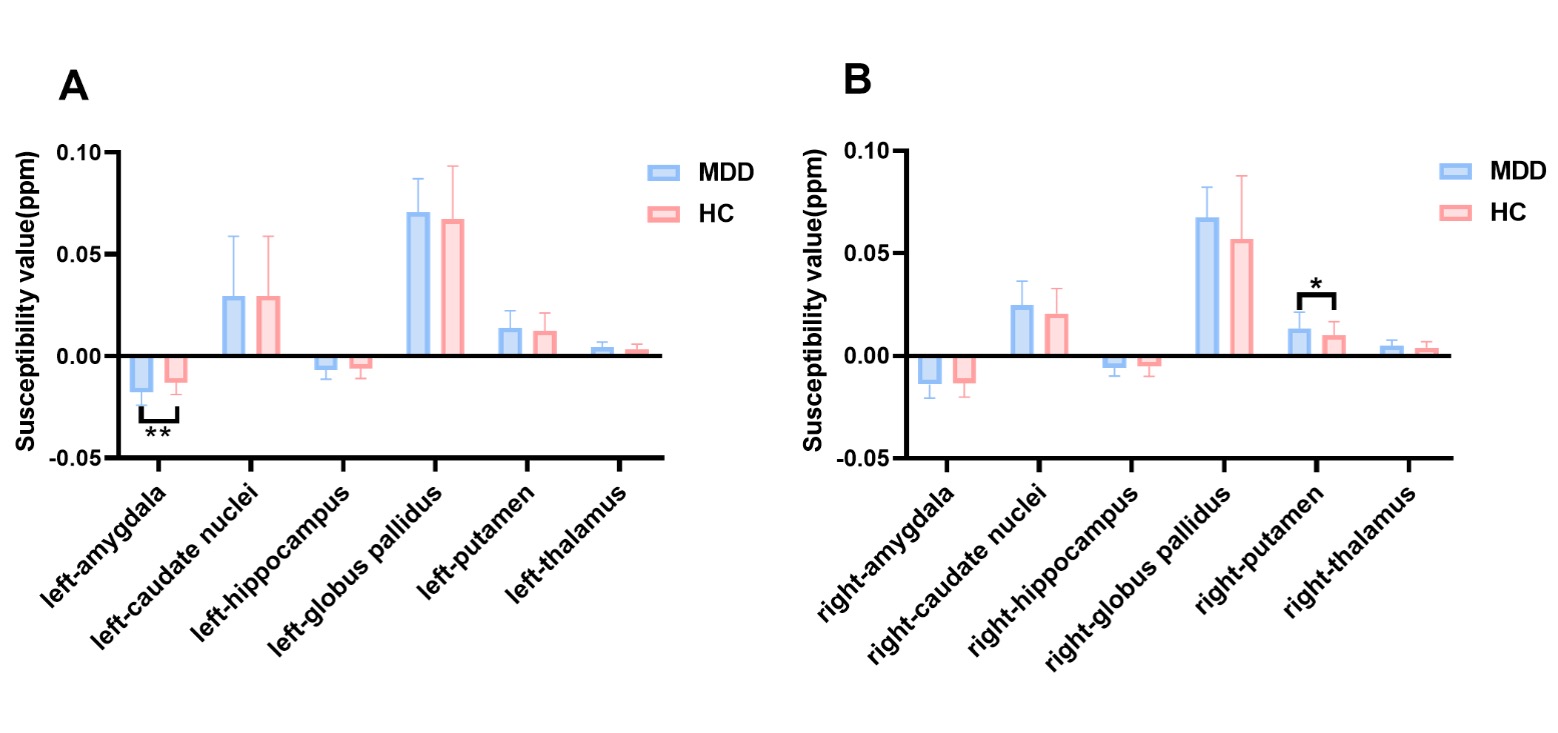
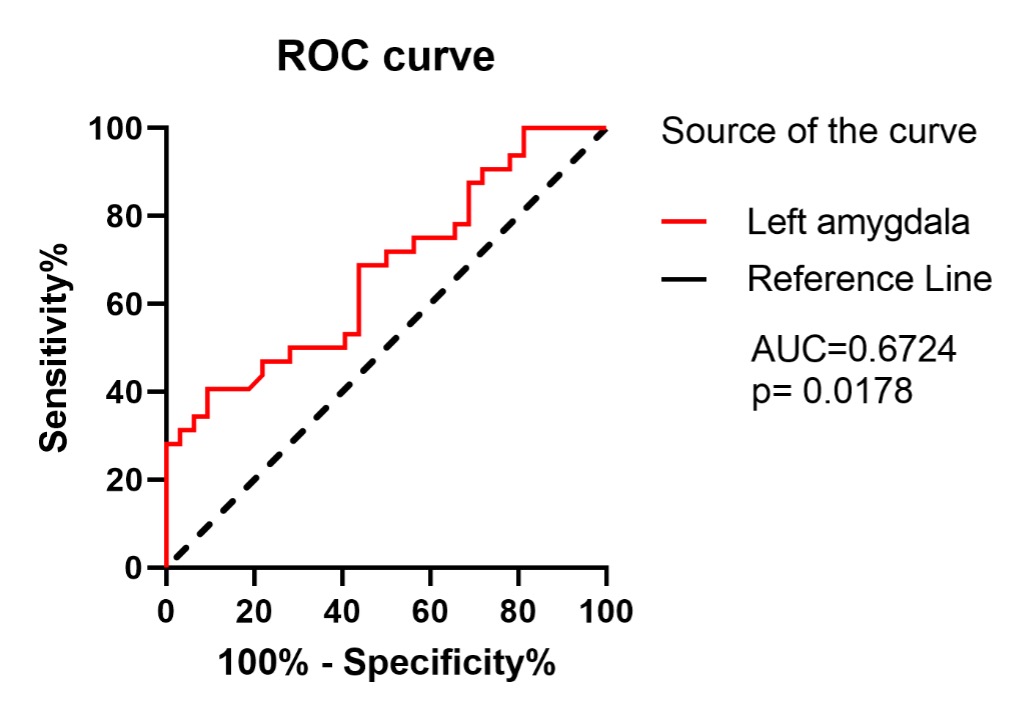
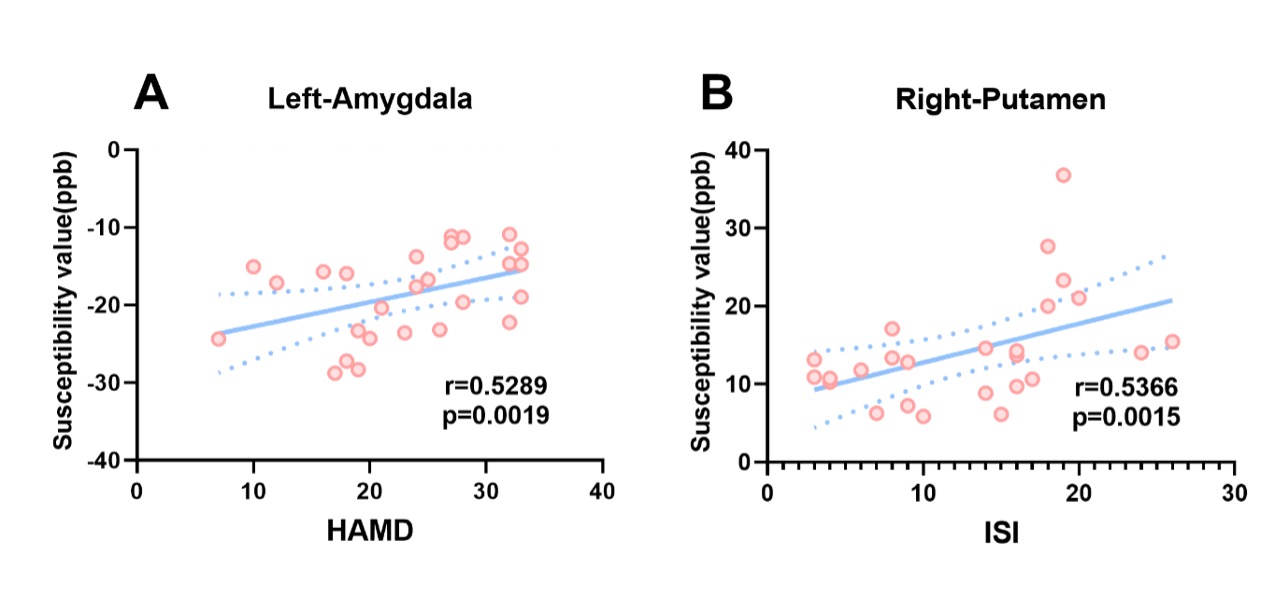
The group differences of susceptibility value in the six ROIs between MDD patients and HC subjects were compared and statistical significance was only found in the left amygdala (p=0.0032) and right putamen (p=0.0300) (Figure2). That is, in MDD, the susceptibility value in the left amygdala and right putamen was significantly increased compared with control participants. Furthermore, ROC analysis of susceptibility value in the left amygdala was able to distinguish MDD patients from HC subjects well (Figure 3). In addition, the relationships between the susceptibility values of ROIs and the clinical features of MDD were measured using correlation analysis. Figure 4 demonstrates there were positive correlations between the brain iron concentration in the left amygdala and the severity of depression as indicated by the HAMD-17 scores, as well as between the susceptibility values of the right putamen and the severity of insomnia as indicated by the ISI scores.Discussion and conclusions
In this study, compared with the HC subjects, the left amygdala and right putamen exhibited increased iron deposition in the MDD patients, indicating the abnormal iron metabolism in deep GM nucleus may be related to the occurrence of MDD. In addition, the iron concentration of the left amygdala and right putamen in patients with MDD was positively correlated with HAMD and ISI scores, respectively, suggesting symptoms in depressed patients, like insomnia, may be related to iron deposition in deep nuclei.Therefore, our findings may provide a new biomarker for the diagnosis of depression and the investigation of its pathophysiological mechanism.Acknowledgements
We thank Dingdang for her accompany with us.References
1. Gong Q, He Y. Depression , Neuroimaging and Connectomics:A Selective Overview. Biol Psychiatry. 2015;77:223-235.
2. Abbas M, Gandy K, Salas R, Devaraj S, Calarge CA. Iron deficiency and internalizing symptom severity in unmedicated adolescents: A pilot study. Psychol Med. 2021. doi:10.1017/S0033291721004098
3. Zhang W, Zhou Y, Li Q, et al. Brain Iron Deposits in Thalamus Is an Independent Factor for Depressive Symptoms Based on Quantitative Susceptibility Mapping in an Older Adults Community Population. Front Psychiatry. 2019;10(October):1-8. doi:10.3389/fpsyt.2019.00734
4. Duan X, Xie Y, Zhu X, et al. Quantitative Susceptibility Mapping of Brain Iron Deposition in Patients With Recurrent Depression. Psychiatry Investig. 2022;19(8):668-675. doi:10.30773/pi.2022.0110
5. Yao S, Zhong Y, Xu Y, et al. Quantitative susceptibility mapping reveals an association between brain iron load and depression severity. Front Hum Neurosci. 2017;11(August):1-8. doi:10.3389/fnhum.2017.00442
6. Li Wei, Avram A V., Wu B, Xiao X, Liu C. Integrated Laplacian-based phase unwrapping and background phase removal for quantitative susceptibility mapping. NMR Biomed. 2014;27(2):219-227. doi:10.1002/nbm.3056.Integrated
7. Henschel L, Conjeti S, Estrada S, et al. FastSurfer - A fast and accurate deep learning based neuroimaging FastSurfer - A fast and accurate deep learning based neuroimaging. Neuroimage. 2020;219:117012. doi:10.1016/j.neuroimage.2020.117012.FastSurfer
Figures