4937
Predictive diagnosis of Major Depressive Disorder using integrated NMR based metabolomics and logistic regression model approach1Department of NMR, All India Institute of Medical Sciences (AIIMS), New Delhi, India, 2Department of Psychiatry, All India Institute of Medical Sciences (AIIMS), New Delhi, India
Synopsis
Keywords: Psychiatric Disorders, Spectroscopy, NMR based metabolomics, Logistic regression analysis, blood serum, neuroinflammation
The current diagnosis for Major Depressive disorder (MDD) is dependent on symptomatic clusters and resulting high error rates. The study identifies a panel of biomarkers using 1H NMR spectroscopy and logistic regression prediction modelling. The VIP score of >1.5 and S-plot based on OPLS-DA depicted 4 significant metabolites (phosphocreatine, phosphocholine, glycerophosphocholine and glutamine) indicating abnormalities in energy and lipid metabolism. Phosphocreatine showed the highest AUC of 0.875 with 90% sensitivity and specificity, while with a combination of 4 metabolites, the AUC increased to 0.927 with 96.3% sensitivity and 87.5% specificity, which may act as a supplementary diagnostic tool for MDD.Introduction:
Major depressive disorder (MDD) is a severe psychiatric illness globally. The diagnosis of MDD is dependent on symptomatic clusters which results in a high error rate due to the heterogeneity of symptoms. This necessitates a need for a high throughput technique to identify biomarkers leading to developing objective diagnostic and therapeutic approaches. Metabolomics possesses great potential for the diagnosis of depression. Few GC and LC MS-based metabolomics studies have reported biomarkers for depression pertaining to neurotransmitters, lipids, and amino acids1. Though NMR-based metabolomics has higher reproducibility, however, there are only limited studies in MDD2,3. The MDD patients with suicidal ideation showed differential levels of lipids and amino acids compared to controls using NMR2. NMR-based metabolomics and least squares-support vector machine have been used for the predictive diagnosis of MDD3. However, to the best of our knowledge, there is no study to date that has identified the combinatorial biomarkers for diagnosis of MDD using 1H NMR based metabolomics and stepwise logistic regression model prediction approach.Aim:
The present study investigated the combinatorial biomarker for diagnosis of MDD using 1H NMR spectroscopy and logistic regression model prediction approach.Materials and Methods:
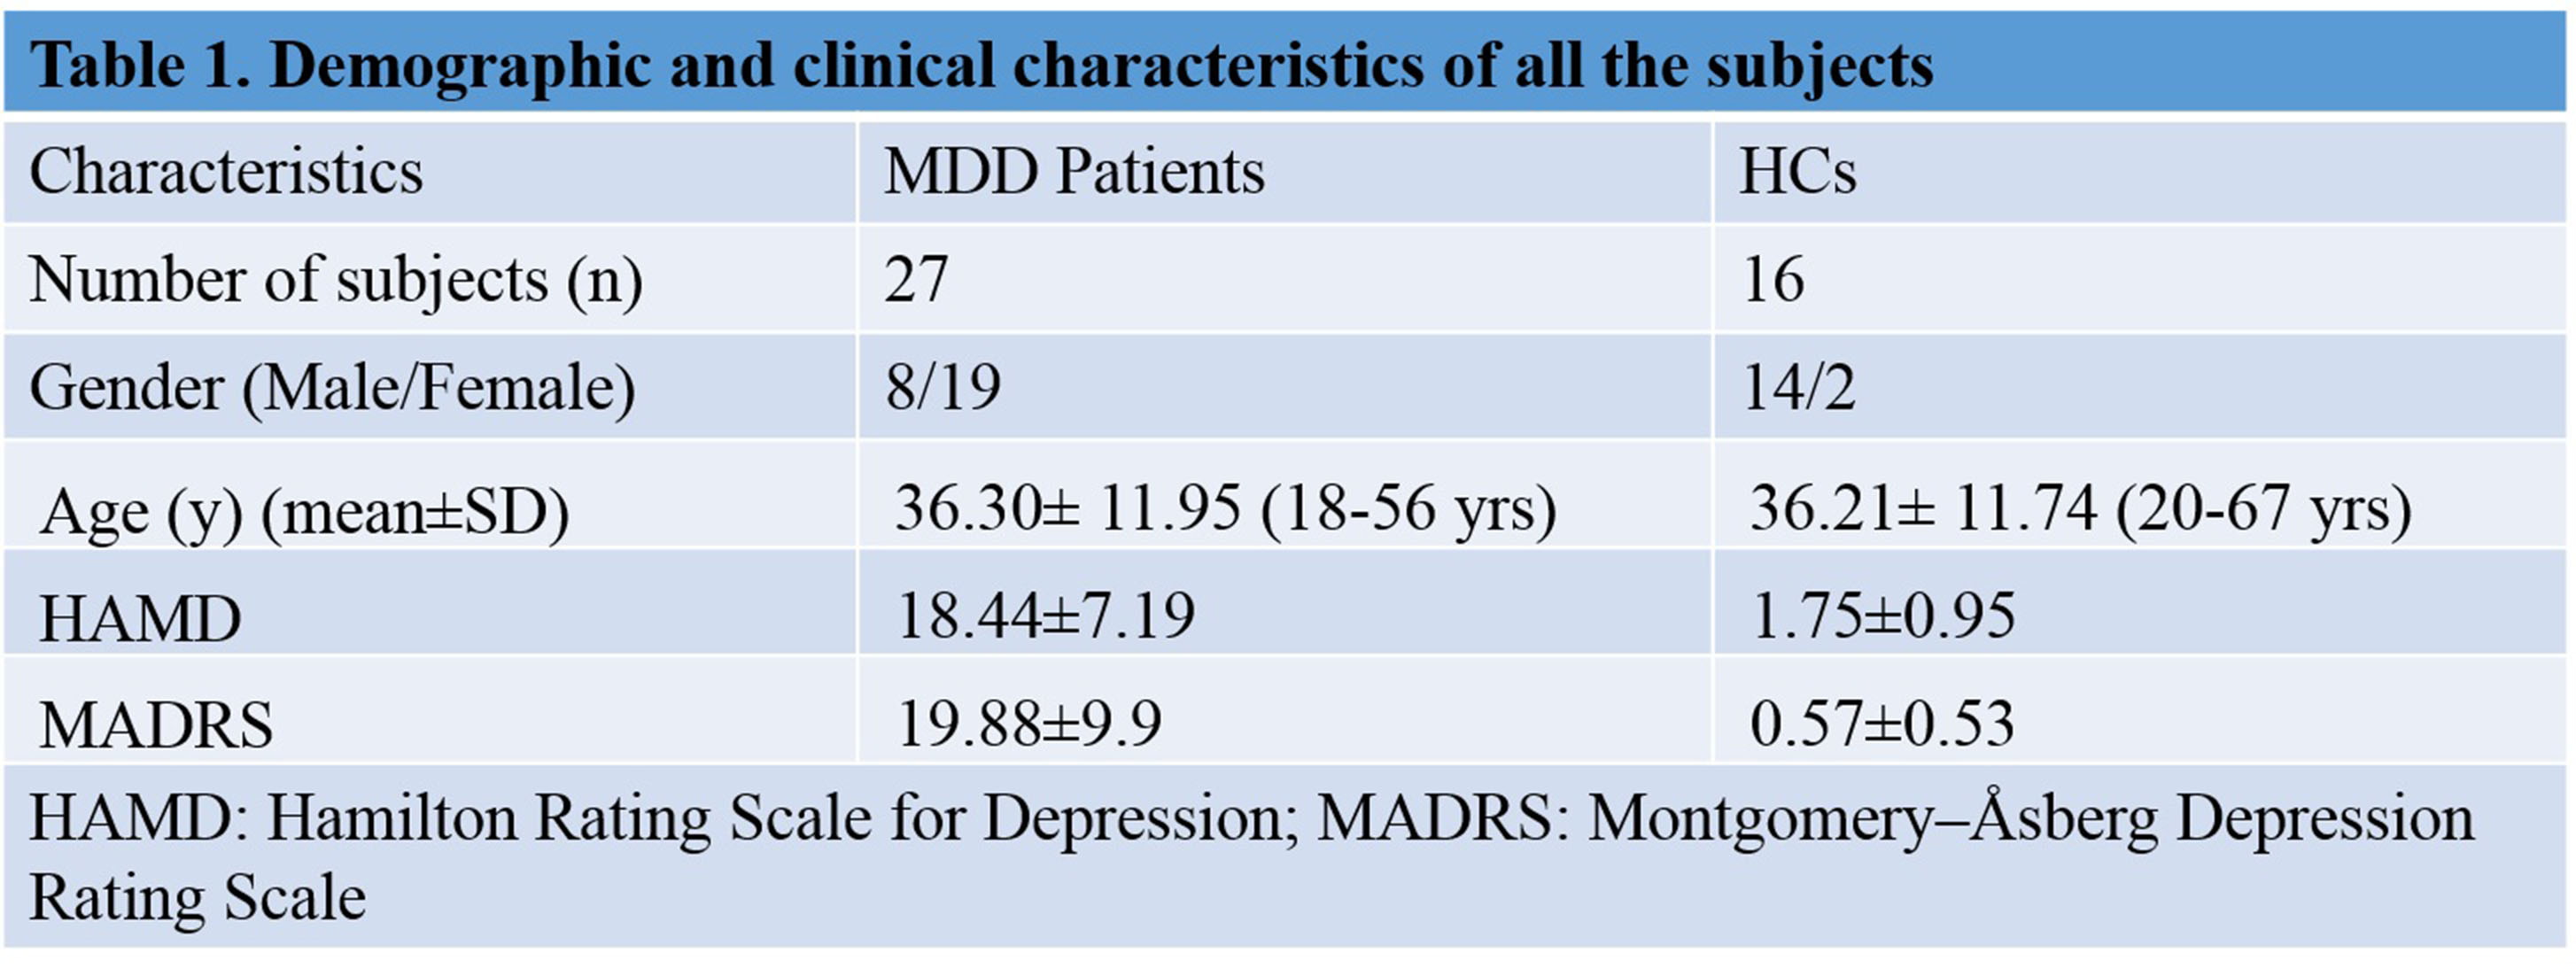
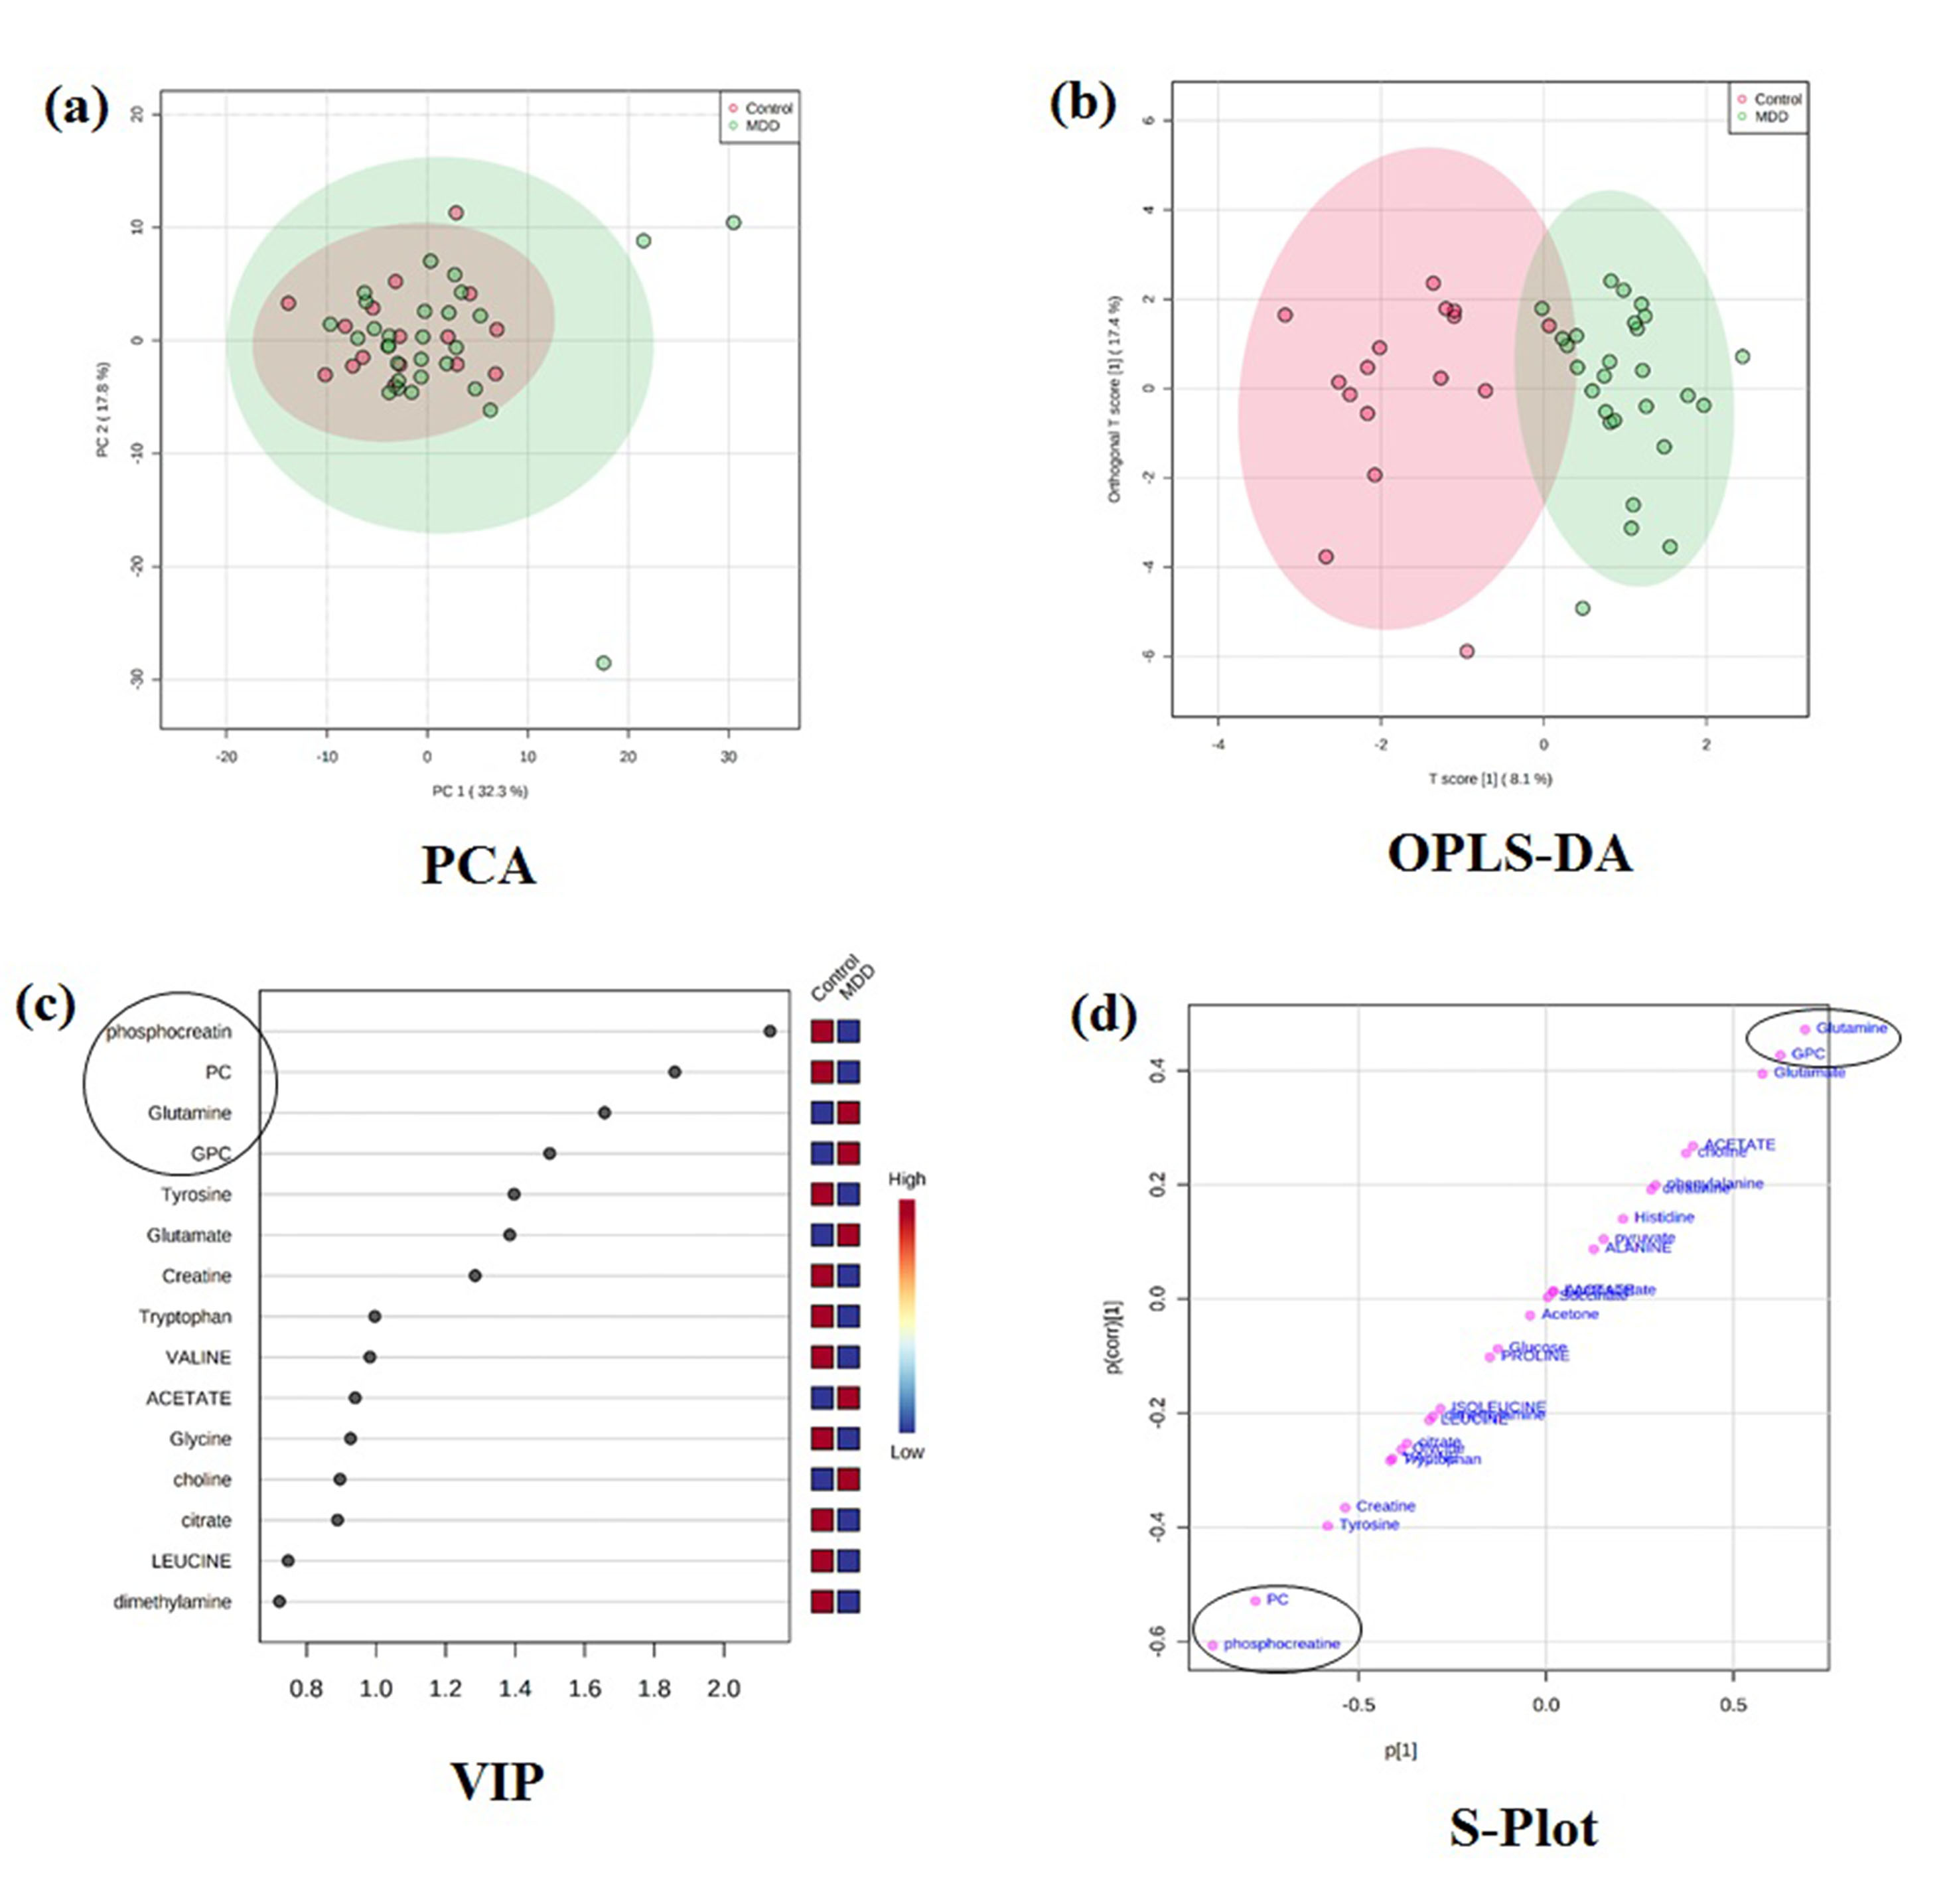
Treatment naïve MDD patients (n=27, HAM-D>8 and MADRS>7 age 33.96± 11.80 yrs; 8 males, 19 Females) were recruited from the Department of Psychiatry, All India Institute of Medical Sciences (AIIMS), New Delhi. Healthy volunteers (n=16, 14 males, 2 females, mean age 34.75 ± 13.84) with no neurological/psychiatric disease were recruited as controls. The study has been approved by the institute ethics committee and written informed consent was obtained. Blood samples were collected in the morning pre-prandially after overnight fasting and serum was separated by centrifugation at 2000 g for 10 min at 40C and was stored at −800C until NMR analysis. 1D CPMG pulse sequences were performed at 298 K on a 700 MHz spectrometer (Agilent Technologies, Santa Clara, CA, USA) with 64 scans and a relaxation delay of 5 s with a spin echo time (τ) of 16 ms. The concentration of the metabolites was determined using Chenomx NMR Suite 7.5 software. Mann-Whitney U test was used for comparison of the concentrations between groups and presented as median with interquartile range. P < 0.05 was considered significant. The data were normalized using log transformation and auto-scaling. Further, Principal component analysis (PCA) and orthogonal partial least squares discriminant analysis (OPLS-DA) was carried out. Based on the Variable Importance of Projection (VIP) and S plot, the potential metabolites differentiating 2 groups were identified. The selected metabolites were then used to construct the prediction model using logistic regression to identify the best metabolite combination. The accuracy of the model was evaluated using the receiver-operating characteristic (ROC) curve using metaboanalyst software (http://www.metaboanalyst.ca).Results:
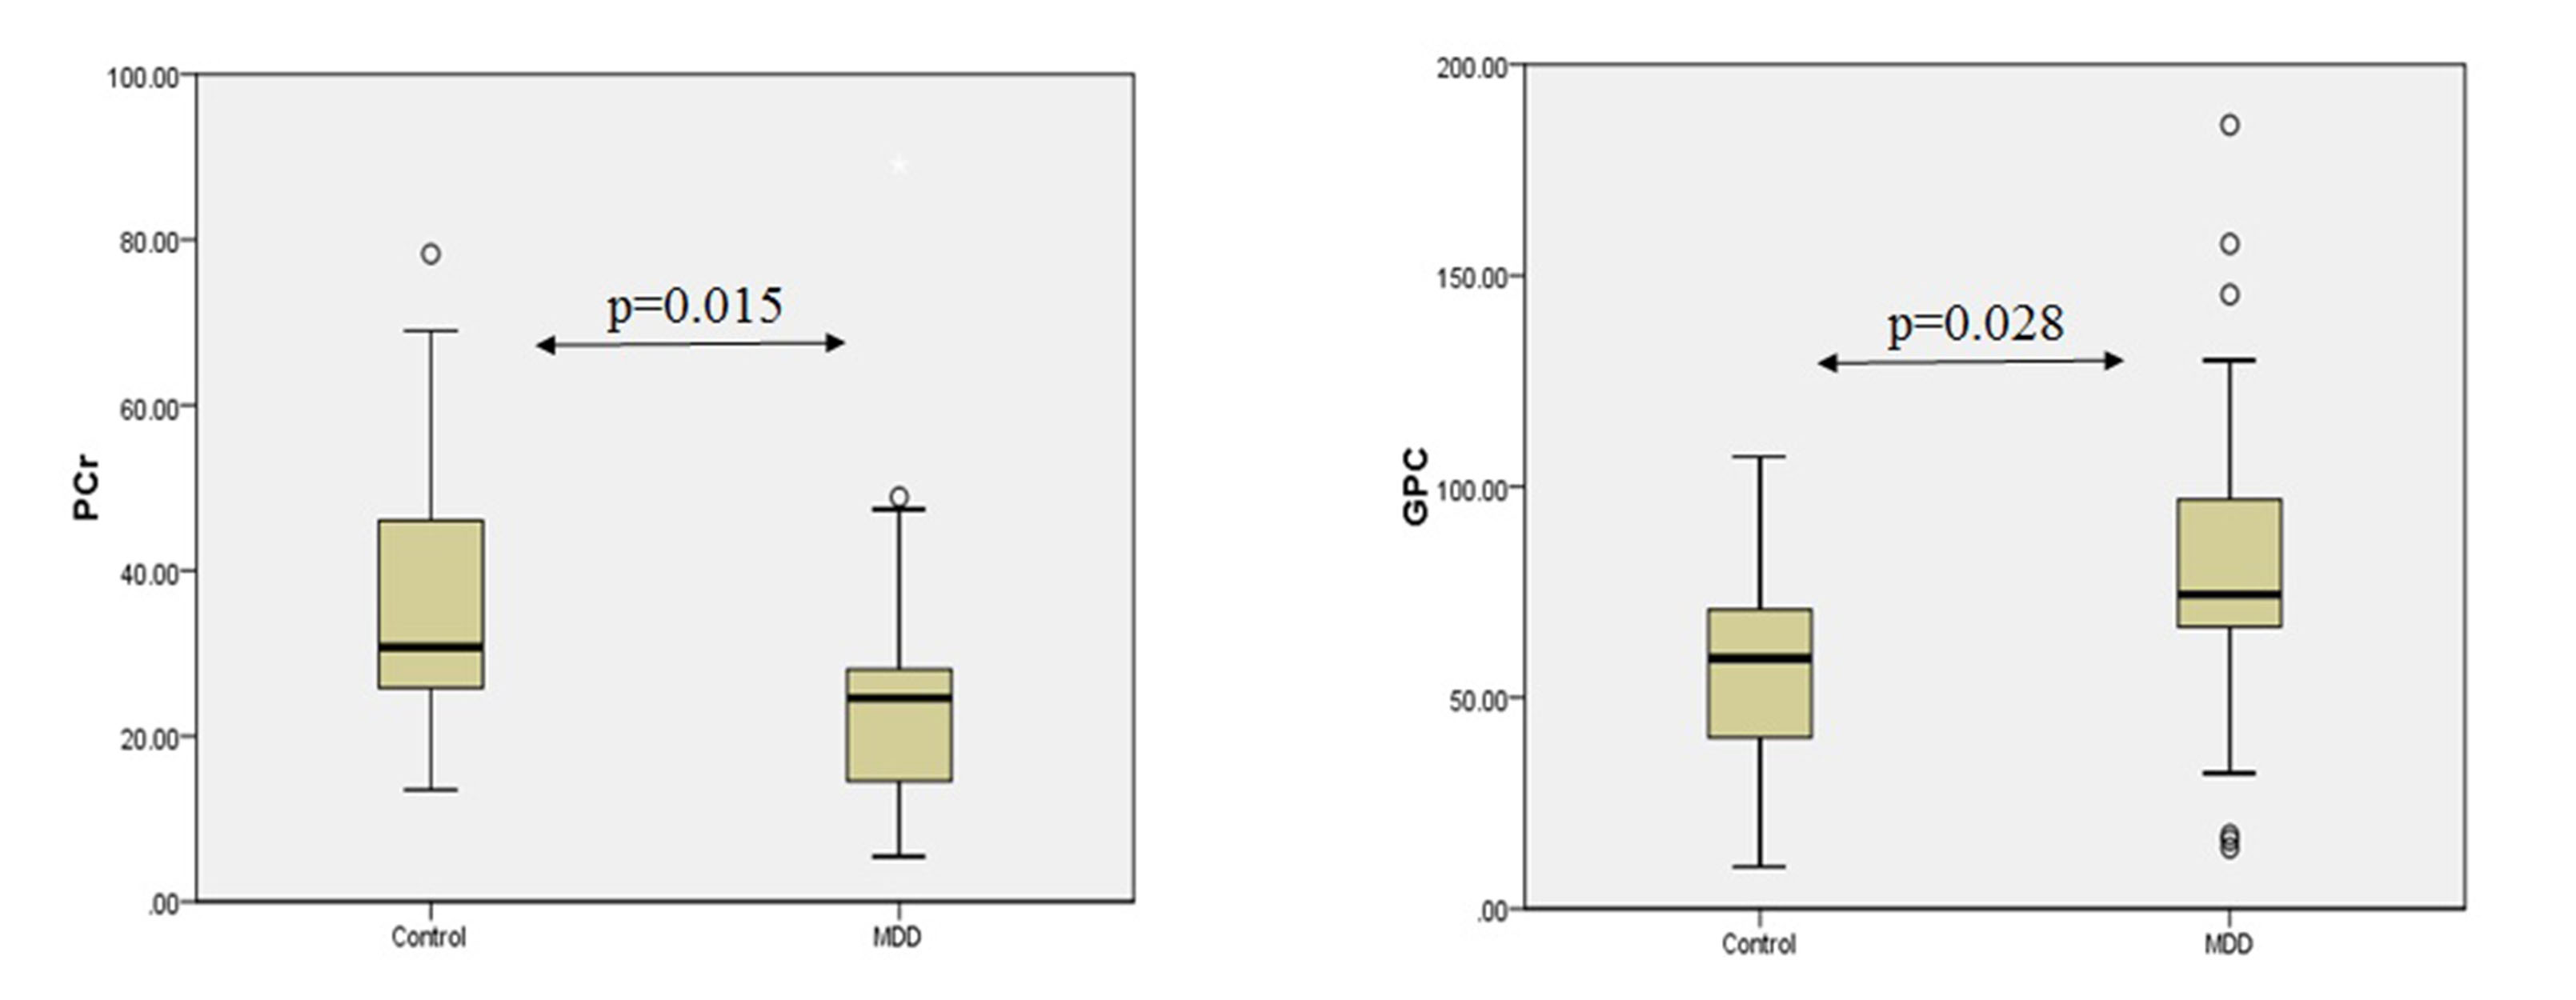
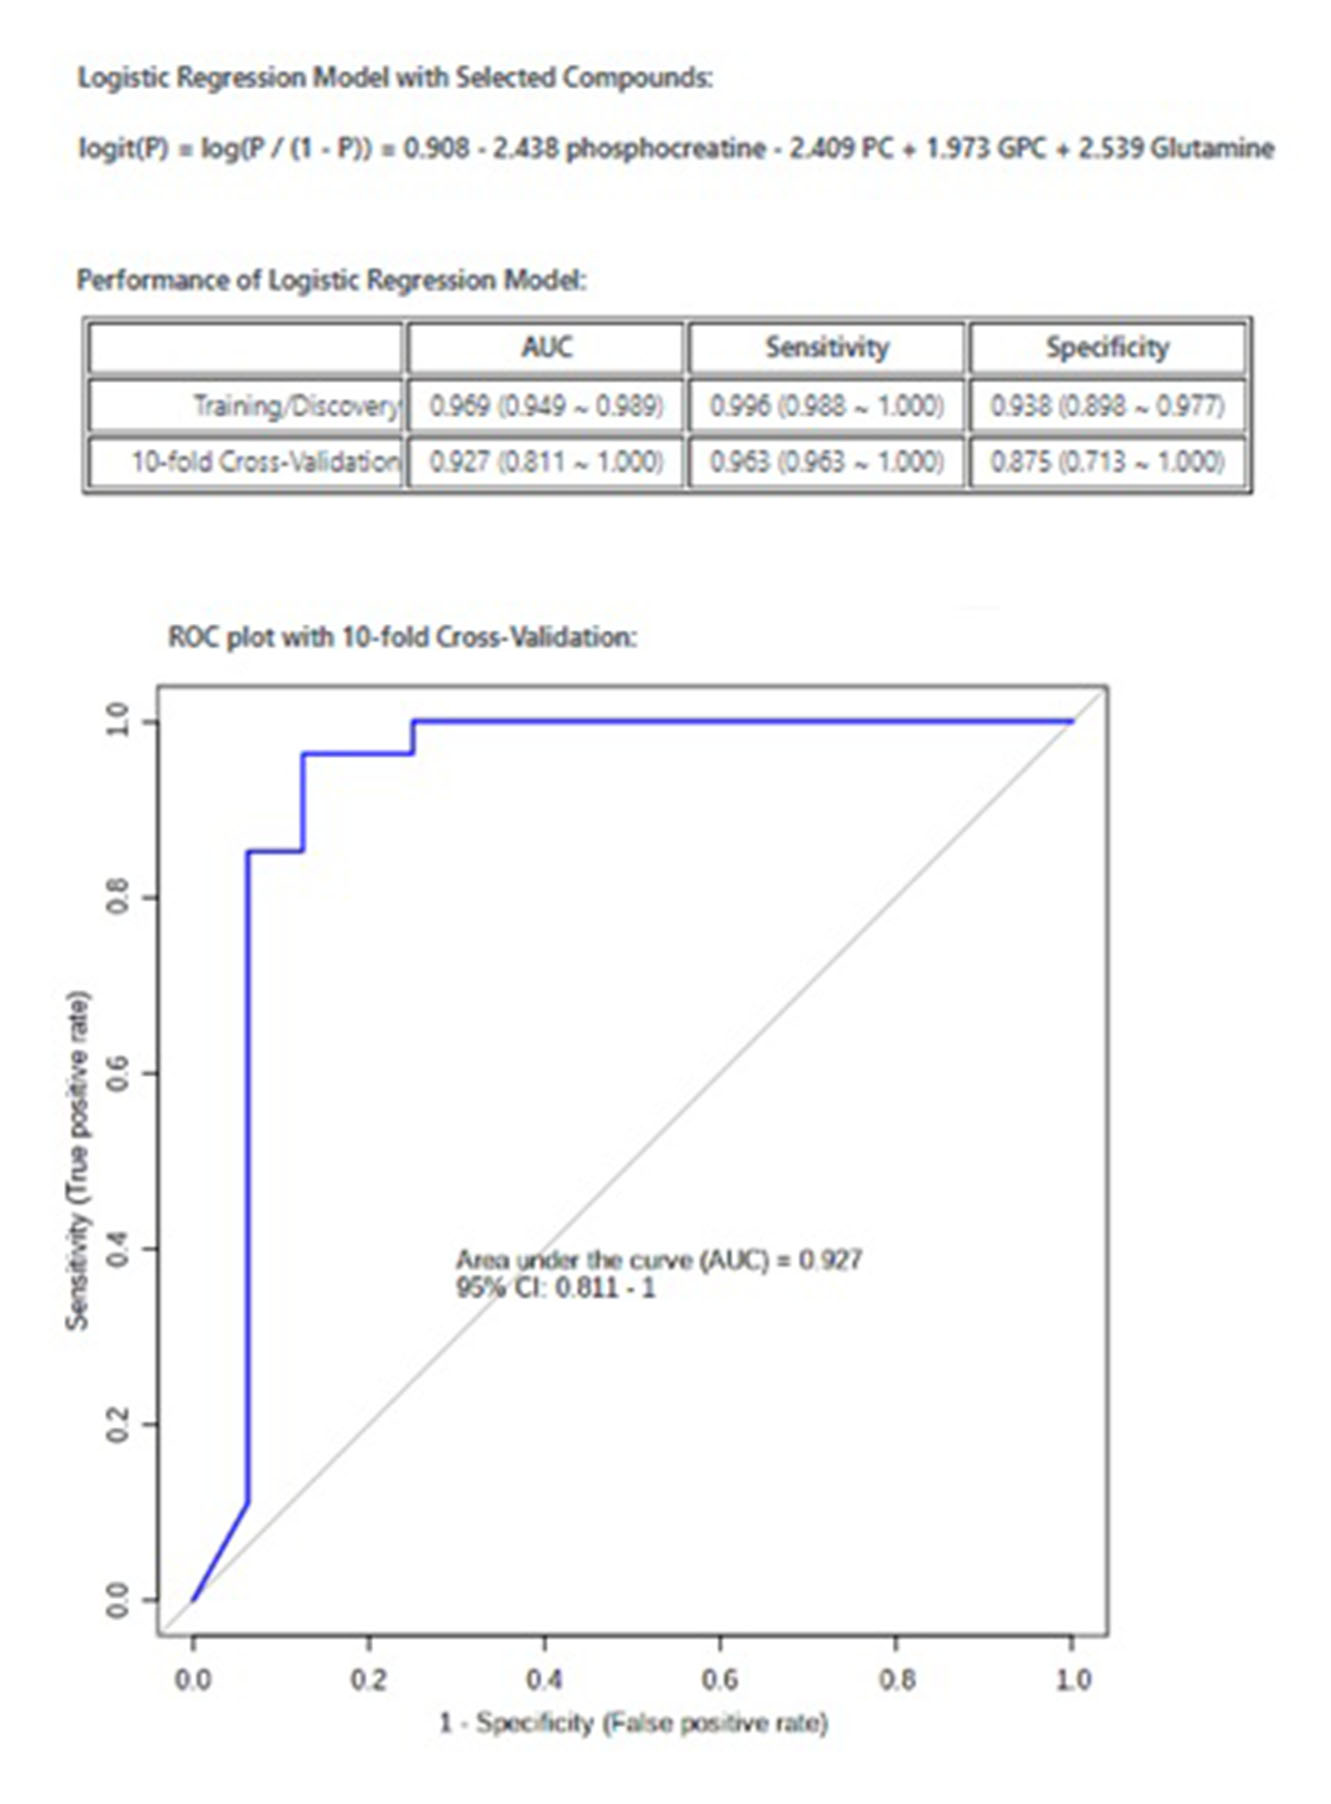
Demographic characteristics of MDD patients are presented in Table 1. The OPLS-DA score plot showed a clear demarcation of control and MDD group (Figure. 1b). Based on VIP score >1.5 and S-plot, four metabolites i.e. phosphocreatine (PCr), phosphocholine (PC), glycerophoshocholine (GPC) and glutamine (Gln) were identified (Figure. 1c and 1d). PCr was significantly reduced (p=0.015), while GPC was increased (p=0.028) in MDD patients compared to healthy controls (HCs) (Figure 2). Among the 4 metabolites PCr was identified as top ranked candidate, with an AUC of 0.875 with 90% sensitivity and 90% specificity (Figure. 3). Using logistic regression-based predictive modeling, with a combination of 4 metabolites the AUC was increased to 0.927, and 96.3% sensitivity and 87.5% specificity (Figure. 4).Discussion:
MDD cause changes at the cellular, molecular, tissue, and organ level thus leading to metabolic perturbations. Our data indicated a significantly increased concentration of GPC in MDD patients compared to HCs. Abnormal energy and lipid metabolism may play a vital role in the pathogenesis of depression. It has been reported that the activity of the phospholipase A2 gene was increased in depression patients4. GPC is formed from phosphatidylcholine and lysophosphatidylcholine (LPC) via phospholipase A2 and lysophospholipase. An earlier study reported an increase in LPC in patients with MDD using LC-MS5. Further, it has been documented that LPC may promote oxidative stress via the 5-lipoxygenase pathway6. Thus, an increased GPC seen in our study might be related to oxidative stress in MDD patients. This is further supported by the fact that oxidative stress is an underlying cause of the pathogenesis of depression and its severity7. Further, we observed decreased PCr in MDD patients compared to HCs. Altered mitochondrial function due to mitochondrial DNA depletion has been associated with depression8. The abnormalities in mitochondrial function may result in reduced ATP synthesis. Since PCr is formed from creatine and ATP by the enzyme creatine kinase, hence, a decrease in the level of PCr in MDD might be probably related to the decrease in ATP synthesis.Conclusion:
Our data indicated abnormalities in the energy and lipid metabolism in patients with MDD. Additionally, the combinational biomarkers (PCr, PC, GPC, and Gln) identified via logistic regression predictive modeling obtained from NMR spectroscopy can be used as a supplementary diagnostic tool for MDD, however, the study needs to be carried out in more patients prior to translating it to clinical settings.Acknowledgements
The authors would like to acknowledge the extramural funding from the Department of Science and Technology (DST) (FILE NO.CRG/20l9/002709), New Delhi, India.References
1. Paige, L. A., Mitchell, M. W., Krishnan, K. R., Kaddurah-Daouk, R., & Steffens, D. C. (2007). A preliminary metabolomic analysis of older adults with and without depression. International journal of geriatric psychiatry, 22(5), 418–423. https://doi.org/10.1002/gps.1690
2. Zheng, P., Gao, HC., Qi, ZG. et al. Peripheral metabolic abnormalities of lipids and amino acids implicated in increased risk of suicidal behavior in major depressive disorder. Metabolomics 9, 688–696 (2013). https://doi.org/10.1007/s11306-012-0474-9
3. Zheng H, Zheng P, Zhao L, et al. Predictive diagnosis of major depression using NMR-based metabolomics and least-squares support vector machine. Clin Chim Acta. Published online 2017. doi:10.1016/j.cca.2016.11.039
4. Papadimitriou, G. N., Dikeos, D. G., Souery, D., Del-Favero, J., Massat, I., Avramopoulos, D., Blairy, S., Cichon, S., Ivezic, S., Kaneva, R., Karadima, G., Lilli, R., Milanova, V., Nöthen, M., Oruc, L., Rietschel, M., Serretti, A., Van Broeckhoven, C., Stefanis, C. N., & Mendlewicz, J. (2003). Genetic association between the phospholipase A2 gene and unipolar affective disorder: a multicentre case-control study. Psychiatric genetics, 13(4), 211–220. https://doi.org/10.1097/00041444-200312000-00004
5. Liu, X., Zheng, P., Zhao, X., Zhang, Y., Hu, C., Li, J., Zhao, J., Zhou, J., Xie, P., & Xu, G. (2015). Discovery and validation of plasma biomarkers for major depressive disorder classification based on liquid chromatography-mass spectrometry. Journal of proteome research, 14(5), 2322–2330. https://doi.org/10.1021/acs.jproteome.5b00144
6. Zou, Y., Kim, D. H., Jung, K. J., Heo, H. S., Kim, C. H., Baik, H. S., Yu, B. P., Yokozawa, T., & Chung, H. Y. (2009). Lysophosphatidylcholine enhances oxidative stress via the 5-lipoxygenase pathway in rat aorta during aging. Rejuvenation research, 12(1), 15–24. https://doi.org/10.1089/rej.2008.0807
7. Michel, T. M., Pülschen, D., & Thome, J. (2012). The role of oxidative stress in depressive disorders. Current pharmaceutical design, 18(36), 5890–5899. https://doi.org/10.2174/138161212803523554
8. Stine, O. C., Luu, S. U., Zito, M., & Casanova, M. (1993). The possible association between affective disorder and partially deleted mitochondrial DNA. Biological psychiatry, 33(2), 141–142. https://doi.org/10.1016/0006-3223(93)90317-7
Figures