4933
The Hippocampus-Amygdala Complex Show Altered Structural Covariance Properties in Never-treated Patients with First-Episode Depression
Lianqing Zhang1, Xinyue Hu1, Mengyue Tang1, Hui Qiu1, Yongbo Hu1, Yingxue Gao1, Hailong Li1, Weihong Kuang2, and Xiaoqi Huang1
1Huaxi MR Research Center (HMRRC), Functional and molecular imaging Key Laboratory of Sichuan Province, Department of Radiology, West China Hospital, Sichuan University, Chengdu 610041, China, Chengdu, China, 2Department of Psychiatry, West China Hospital of Sichuan University, Chengdu, PR ChinaMRRC), Functional and molecular imaging Key Laboratory of Sichuan Province, Department of Radiology, West China Hospital, Sichuan University, Chengdu 610041, China, Chengdu, China
1Huaxi MR Research Center (HMRRC), Functional and molecular imaging Key Laboratory of Sichuan Province, Department of Radiology, West China Hospital, Sichuan University, Chengdu 610041, China, Chengdu, China, 2Department of Psychiatry, West China Hospital of Sichuan University, Chengdu, PR ChinaMRRC), Functional and molecular imaging Key Laboratory of Sichuan Province, Department of Radiology, West China Hospital, Sichuan University, Chengdu 610041, China, Chengdu, China
Synopsis
Keywords: Psychiatric Disorders, Neuroscience, hippocampus, amygdala
The hippocampus and amygdala are densely interconnected structures that work together in multiple affective and cognitive processes that are important to the etiology of major depressive disorder. By constructing a network based on the volumetric covariation among subfields/subregions within the hippocampus-amygdala complex, we found the topologic properties within localized network of the hippocampus-amygdala complex were disrupted in never-treated patients with first-episode depression. The current study provided the first evidence of atypical structural covariance network within the hippocampus-amygdala complex in patients with early stage of MDD, which could be a potential biomarker in the future psychoradiological practices.Introduction
Psychoradiological evidence accumulated in recent decades has emphasized the importance of the hippocampus and the amygdala in the neuropathology of major depressive disorder (MDD)(1). The hippocampus and the amygdala are heavily interconnected structures that subserve integrated cognitive and affective functions; in this capacity, they are commonly referred to as the hippocampus-amygdala complex(2). Furthermore, both the hippocampus and amygdala consist of histologically and functionally heterogeneous subfields/subregions that are unevenly altered in patients with MDD (3).In the current study, we aimed to conduct a volumetric structural covariance analysis of hippocampal and amygdala subfield/subregion volumes to identify MDD-related abnormalities in their intrinsic structural networks. The assumption of this approach is that patterns of covariation in the volume of brain regions (“structural covariance”) measured across a population are linked to both structural and functional networks of the brain(4).
Methods
123 first-episode, medication-naïve MDD patients and 81 age- and sex-matched healthy controls (HCs) for the present study, and their written informed consent was obtained from all participants (Table 1). Acute illness severity was assessed using the 17-item Hamilton Rating Scale for Depression (HAMD) and the 14-item Hamilton Rating Scale for Anxiety (HAMA). High-resolution T1-weighted images were obtained using a magnetization-prepared rapid gradient-echo sequence (TR/TE = 1900/2.2 ms; inversion time= 900 ms; flip angle = 9°) via a 3.0-T MRI system (Trio, Siemens, Erlangen, Germany). Images were automatically preprocessed using FreeSurfer software (v. 6.0) (http://surfer.nmr.mgh.harvard.edu/) with the standard recon-all process, and the segmentation of hippocampal subfields and amygdala subregions was automatically performed using a special module in FreeSurfer. Intracranial volume (ICV), volumes of 9 subregions in the amygdala and 12 subfields in the hippocampus were obtained (Fig 1).The structure covariance network (SCN) within the hippocampus-amygdala complex was constructed using Brain Analysis using Graph Theory (BRAPH; version 1.00; http://braph.org/) (Mijalkov et al. 2017). A weighted, undirected structural connectivity matrix was built for each group, with nodes defined as subfields of the hippocampus and subregions of the amygdala, and edges defined as the partial correlation coefficients between volumes of each pair of subfields/subregions adjusted for age, sex, education level and ICV (Figure 2). Global network metrics were calculated to measure small-worldness (small-worldness index), network segregation (modularity), integration (characteristic path length), centrality (average degree) and resilience (assortativity coefficient). Nodal network metrics were also calculated for each node in the network to measure segregation (clustering coefficient), integration (global efficiency) and centrality (betweenness centrality). The difference of these topological metrics were compared between groups using nonparametric permutation test with 1000 permutations, and false discovery rate (FDR) method was used to correct for multiple comparisons across subfields/subregions and topological metrics.
Results
The differences in global network metrics between patients with MDD and HCs were shown in table 2. Patients with MDD showed decreased characteristic path length (p=0.029), modularity (p=0.004) and small-worldness (p<0.001). However, the small-worldness index in both groups was less than 1, suggesting that the hippocampus-amygdala complex network didn’t have a small-world organization.Multiple subregions in the left amygdala showed significantly decreased clustering coefficient (left corticoamygdaloid transition area, lateral nucleus, basal nucleus and paralaminar nucleus, FDR-corrected p<0.05) and decreased global efficiency (left corticoamygdaloid transition area, anterior amygdaloid area, basal nucleus, accessory basal nucleus and paralaminar nucleus, FDR-corrected p<0.05) in patients with MDD when compared to HCs. In contrast, the left hippocampal tail showed significantly increased clustering coefficient and global efficiency in patients with MDD (FDR-corrected p<0.05). Only the left cortical nucleus of the amygdala showed significantly increased betweenness centrality(FDR-corrected p<0.05, Figure 3 ).
Discussion and Conclusion
Patients with MDD showed decreased characteristic path length and modularity, suggesting higher network integration and segregation within the hippocampus-amygdala complex in patients than in HCs. Compared with findings from the whole-brain network analyses, our findings suggest that the pattern of structural network organization within the hippocampus-amygdala complex is distinct from the pattern of global network organization in MDD, which highlights the importance of studying localized networks(5). These findings add to previous work that reported MDD-related subfield/subregional-level neuroanatomical alterations in the hippocampus and amygdala.We also found that selective subregions in the left amygdala showed decreased measures of network segregation and integration, but the left hippocampal tail showed significant increase in these measurements. These findings suggest that the left hippocampal tail could be an abnormal hub in the hippocampus-amygdala network in patients with MDD which is worth further study. Alterations in nodal graph metrics were lateralized on the left hemisphere, which is in line with previous task-based fMRI studies (6). Our findings further demonstrated lateralized amygdala abnormalities in terms of topological characteristics within the hippocampus-amygdala complex.
In summary, with a relatively large sample of first-episode, never-treated patients with MDD, we demonstrated for the first time that topological properties of the structural covariance network in the hippocampus-amygdala complex were changed in this population. These findings may suggest common neural substrates that control the development of multiple subfields/subregions within the hippocampus-amygdala complex, which could be a potential biomarker in future psychoradiological practices.
Acknowledgements
This study is supported by grants from 1.3.5 Project for Disciplines of Excellence, West China Hospital, Sichuan University (ZYJC21041) and Clinical and Translational Research Fund of Chinese Academy of Medical Sciences (2021-I2M-C&T-B-097).References
1. Front Med. 2021 Aug;15(4):528-540.
2. Neuron. 2022 Apr 20;110(8):1416-1431.e13.
3. Biol Psychiatry. 2019 Mar 15;85(6):487-497.
4. NeuroImage. 2018 Oct 1;179:357-372.
5. Clin Psychol Rev. 2021 Apr;85:102000.
6. Brain Res Brain Res Rev. 2004 May;45(2):96-103.
Figures
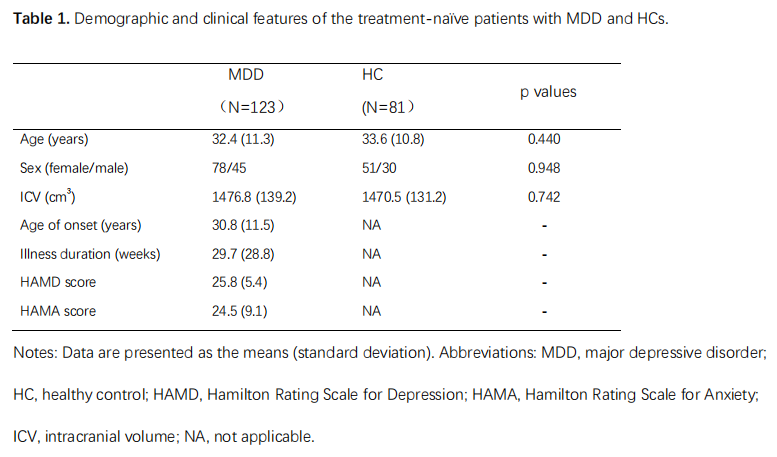
Table 1. Demographic
and clinical features of the treatment-naïve patients with MDD
and HCs.
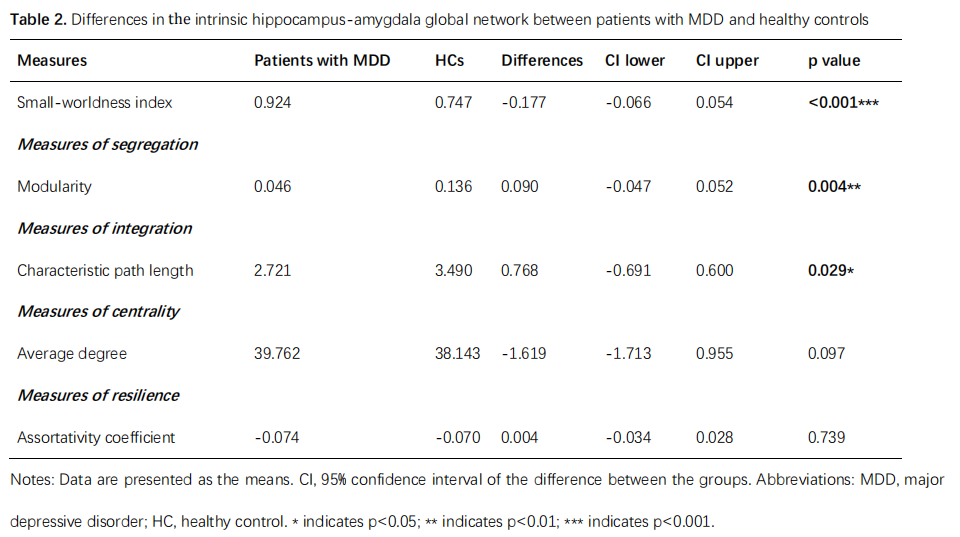
Table 2. Differences in the
intrinsic hippocampus-amygdala global network properties between patients
with MDD and healthy controls
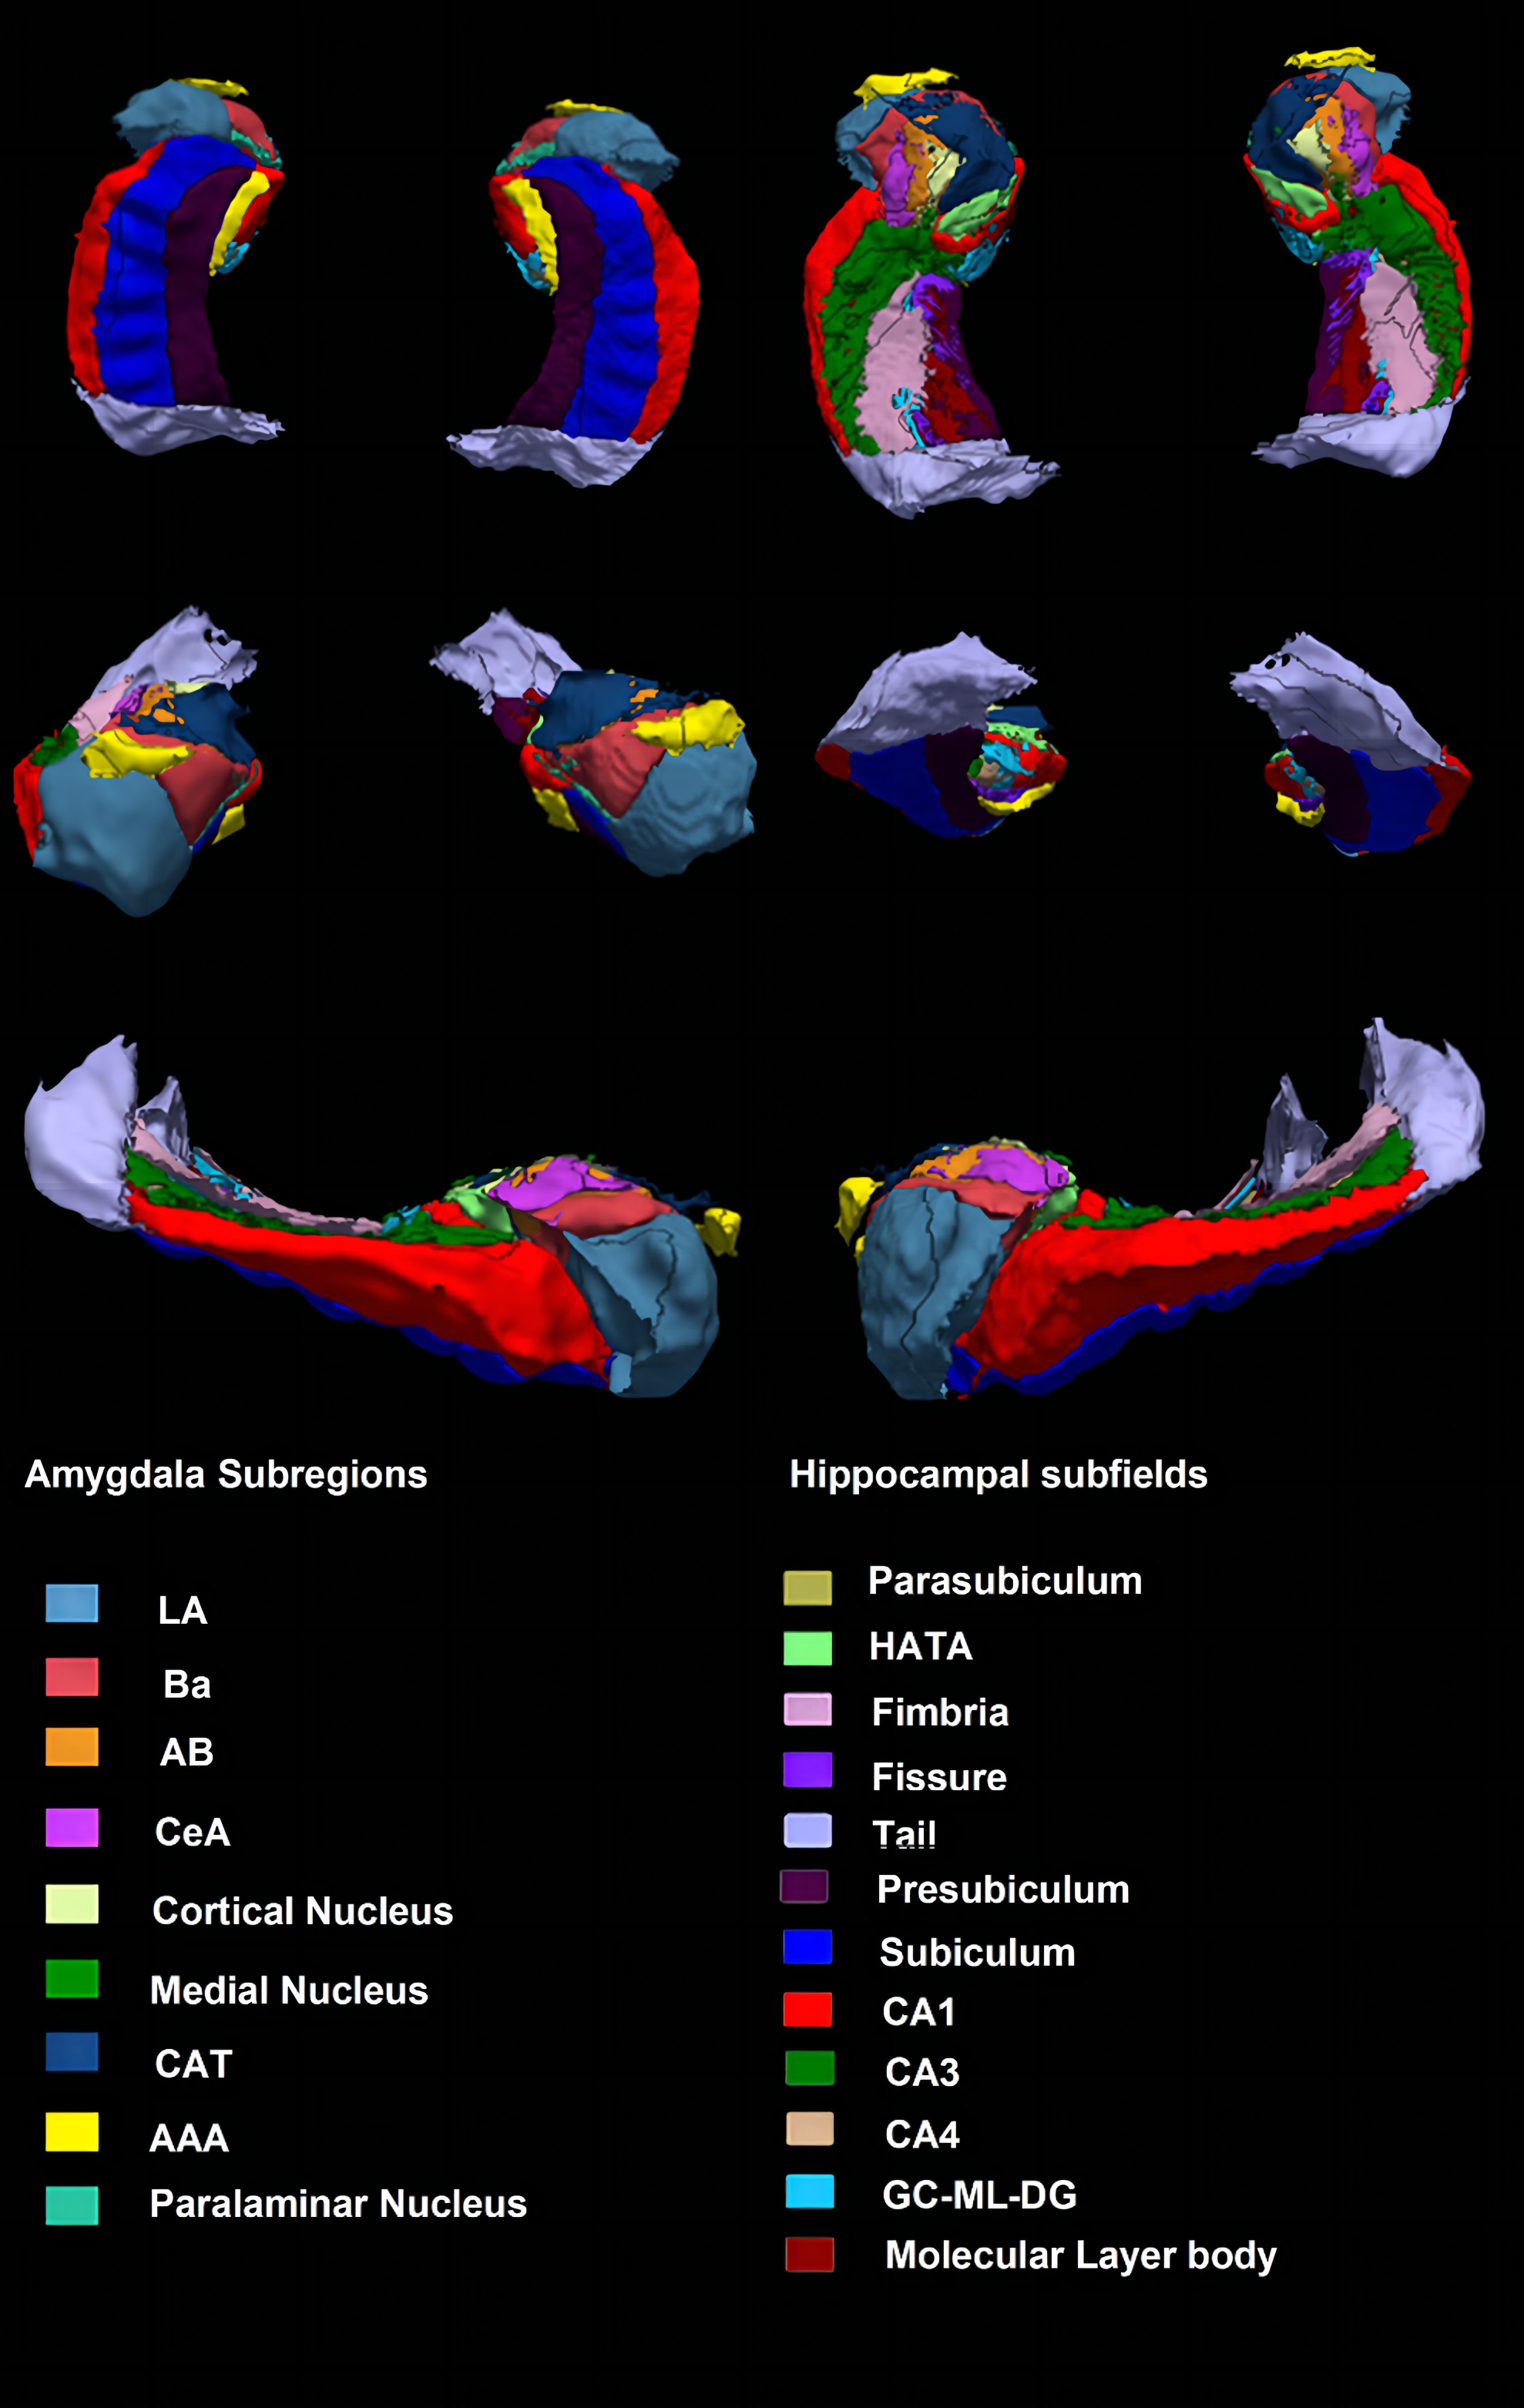
Figure 1. An example of amygdala and
hippocampal segmentation in a healthy subject. Abbreviations: LA, lateral nucleus; Ba, basal nucleus; AB,
accessory basal nucleus; CeA, central nucleus; CAT, corticoamygdaloid
transition area; AAA, anterior amygdaloid area; HATA, hippocampus-amygdala transition area; GC-ML-DG, granule cell and molecular layers of the dentate gyrus; CA, cornu ammonis.
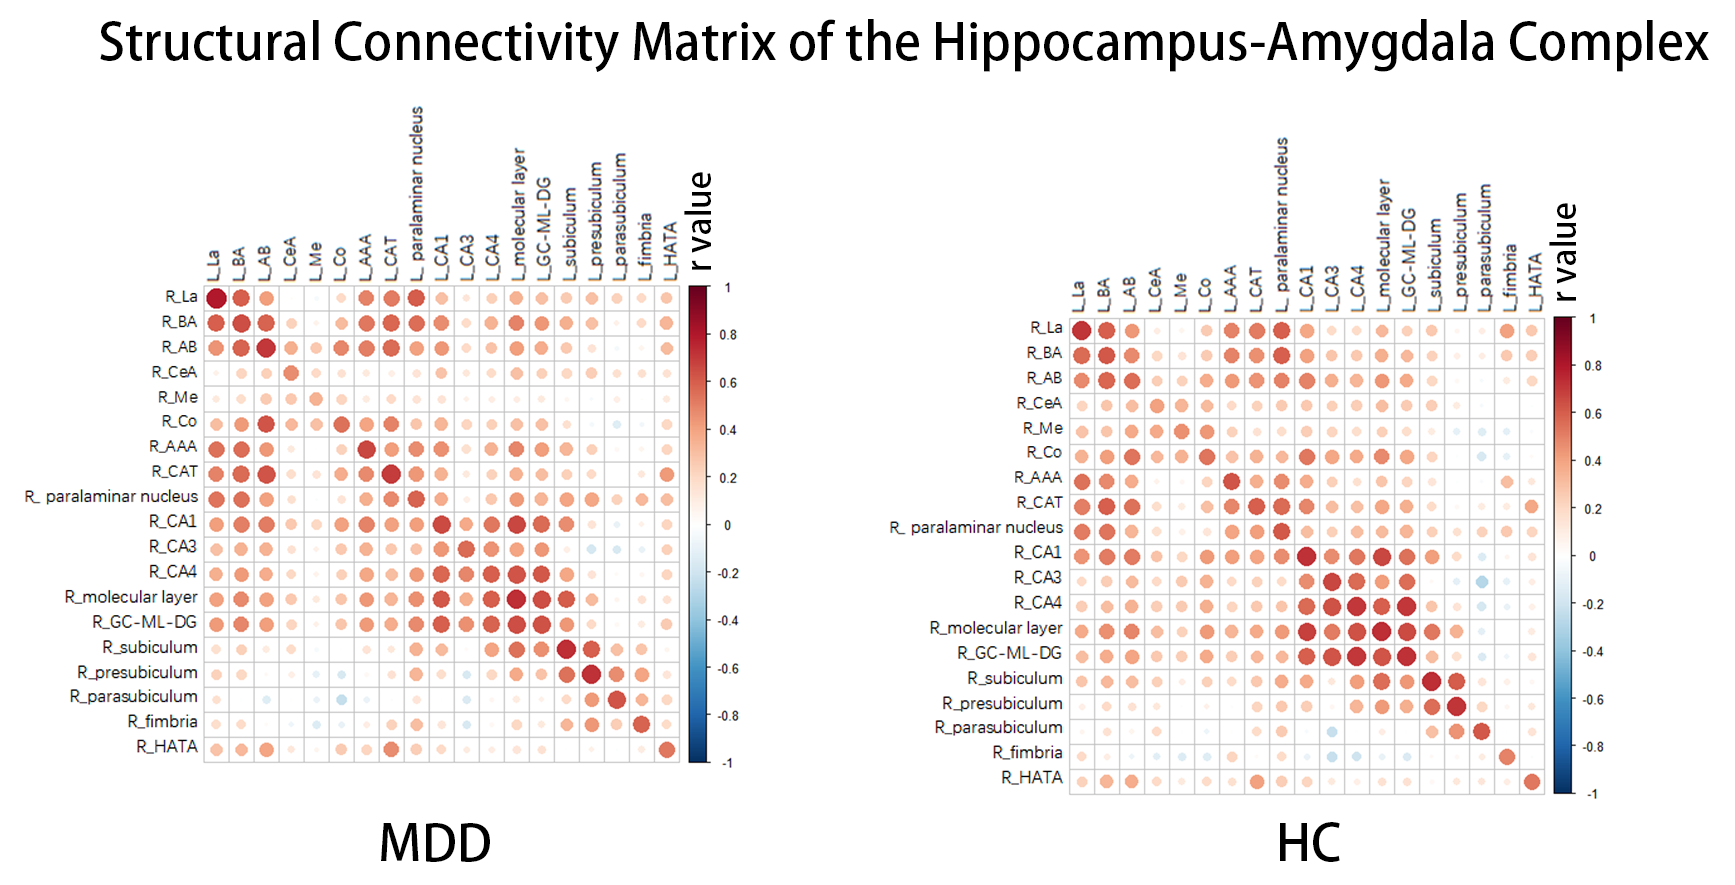
Figure 2. A Weighted structural connectivity matrix was built for each group with edges
defined as the partial correlation coefficients between volumes of each pair of
subfields/subregions. Abbreviations: L, left; R, right; LA, lateral nucleus; Ba, basal nucleus; AB, accessory basal nucleus; CeA, central nucleus; CAT, corticoamygdaloid transition area; AAA, anterior amygdaloid area; Me, medial nucleus; Co, cortical nucleus; HATA, hippocampus-amygdala transition area; GC-ML-DG, granule cell and molecular layers of the dentate gyrus; CA, cornu ammonis.
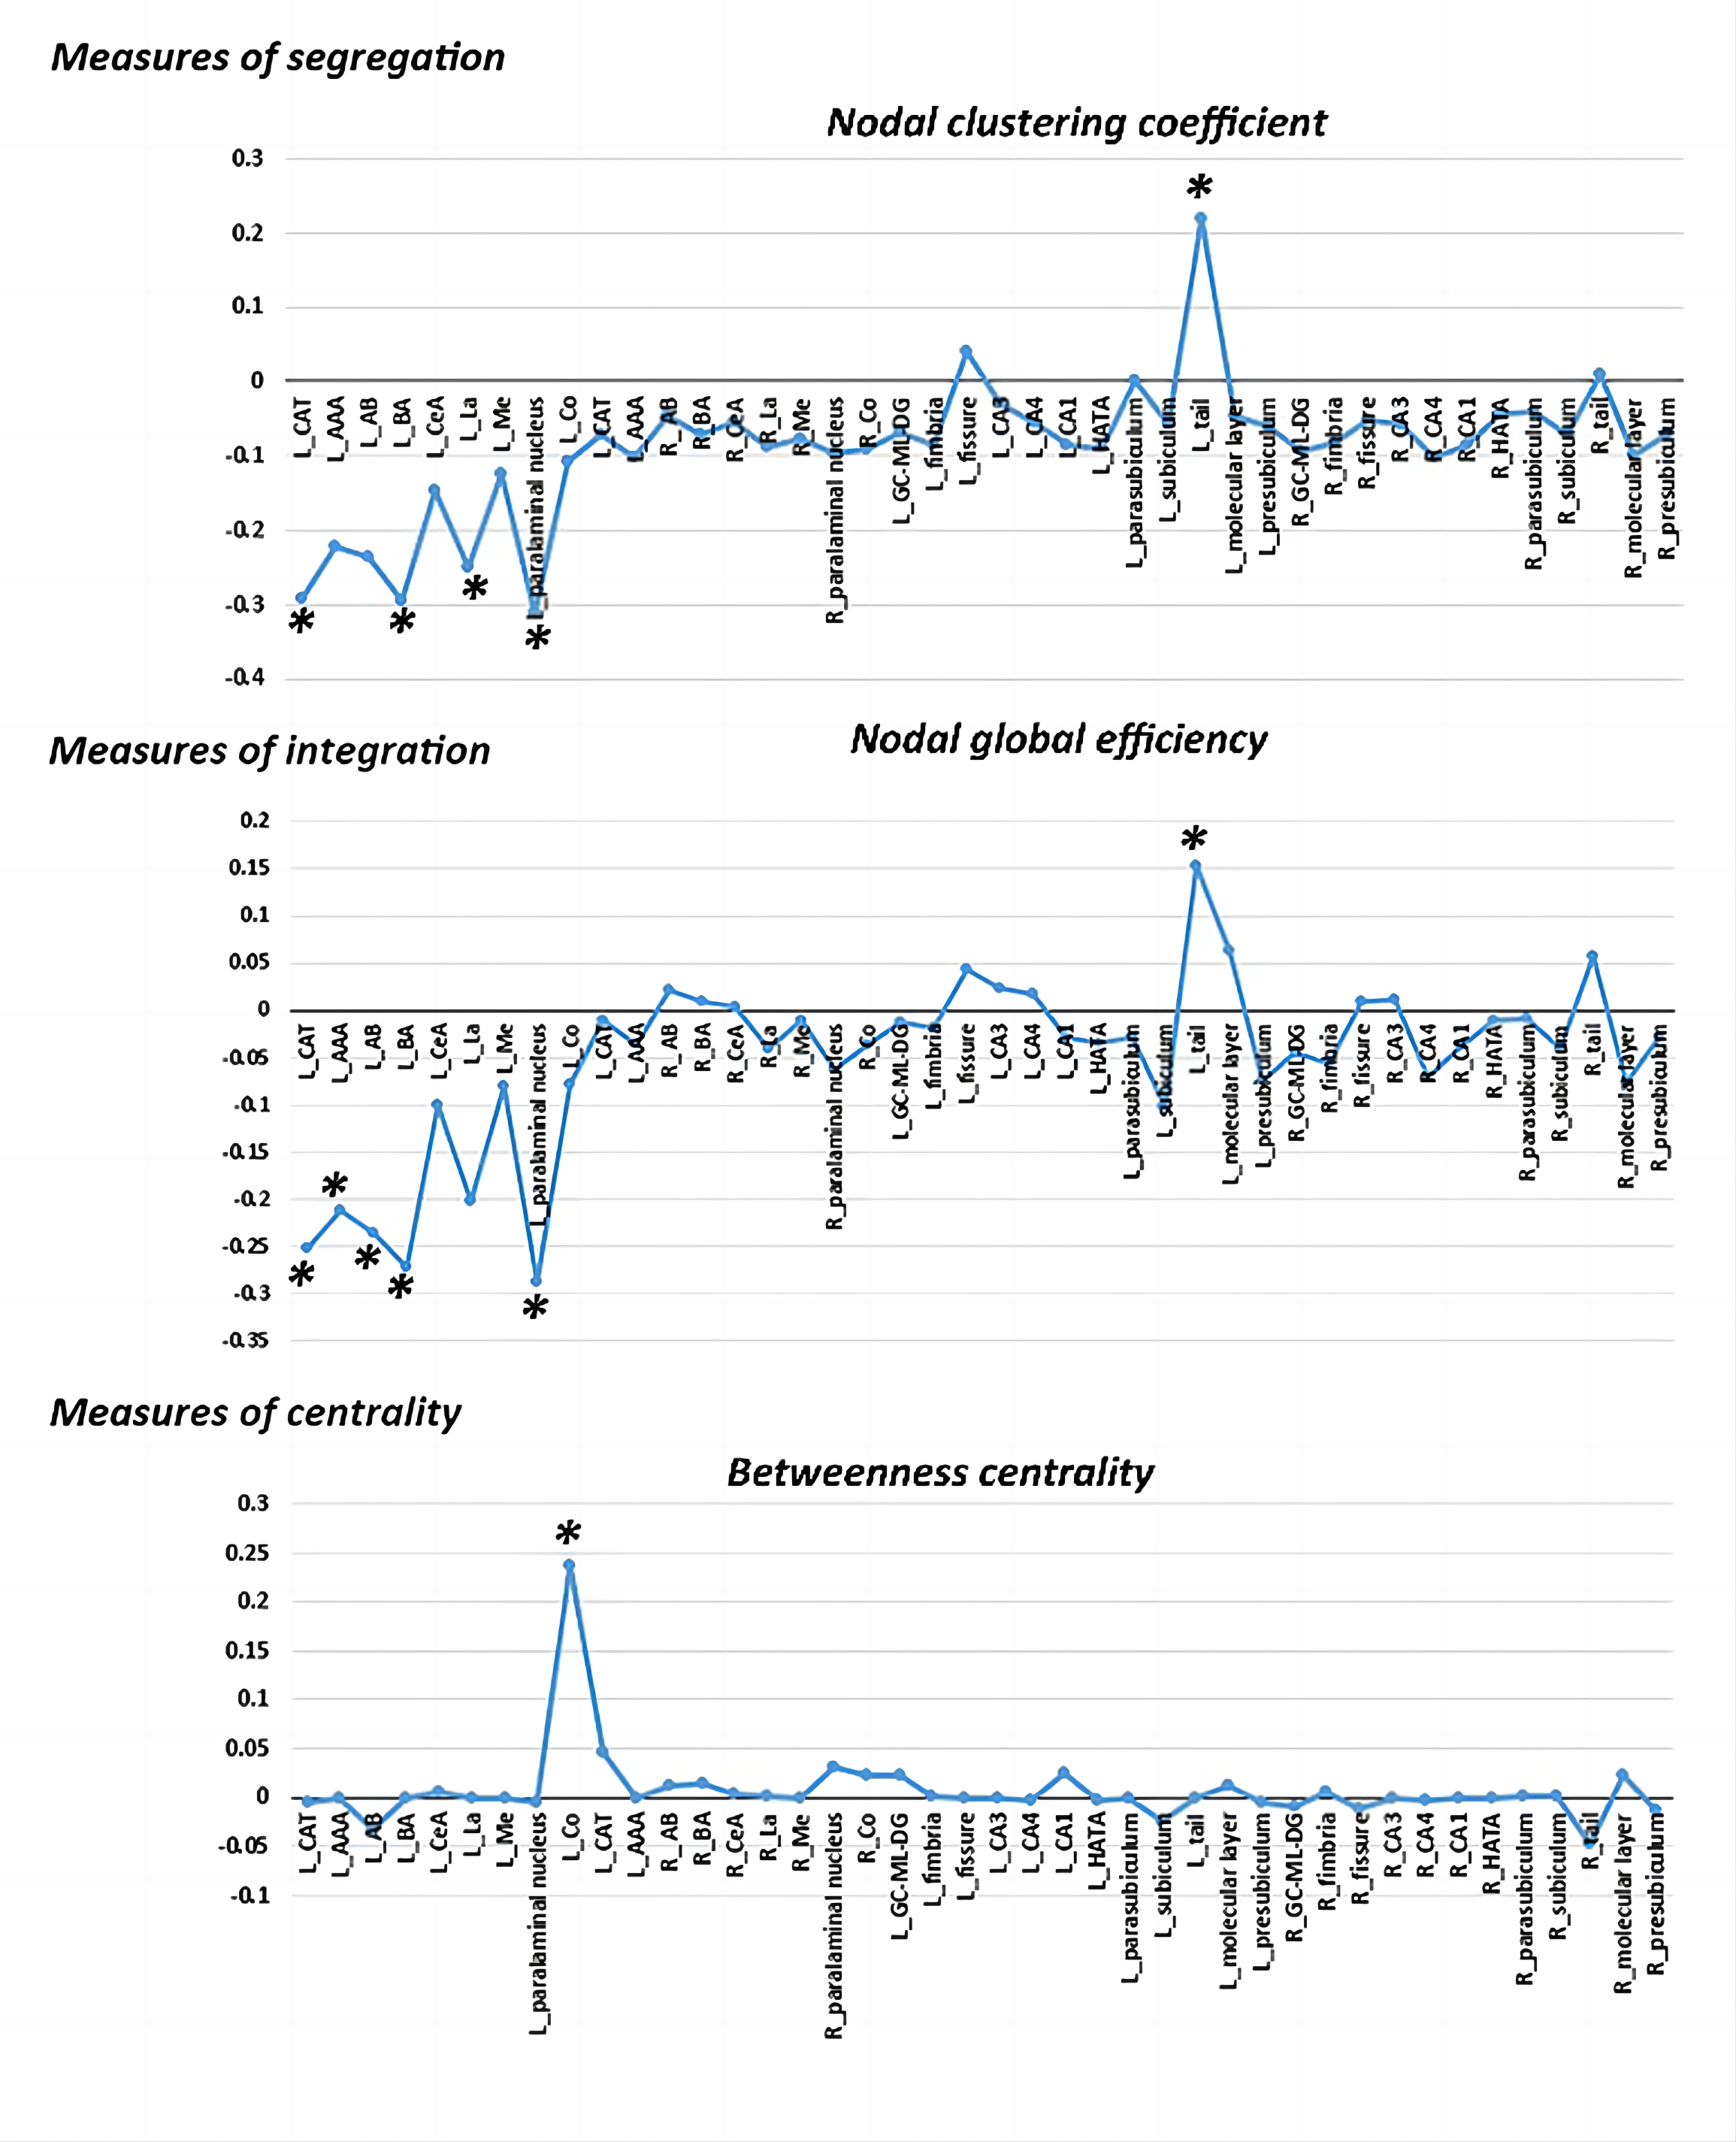
Figure 3. The differences in the topological properties of each node within the structural covariance network of the hippocampus-amygdala complex between MDD patients and HCs. Abbreviations: L, left; R, right; LA, lateral nucleus; Ba, basal nucleus; AB, accessory basal nucleus; CeA, central nucleus; CAT, corticoamygdaloid transition area; AAA, anterior amygdaloid area; Me, medial nucleus; Co, cortical nucleus; HATA, hippocampus-amygdala transition area; GC-ML-DG, granule cell and molecular layers of the dentate gyrus; CA, cornu ammonis. * indicates FDR-corrected p<0.05.
DOI: https://doi.org/10.58530/2023/4933