4932
Evaluation of different multi-echo combinations on objective depression prognosis in an emotional face-matching task1Electrical Engineering, Eindhoven University of Technology, Eindhoven, Netherlands, 2Department of Research and Development, Epilepsy Centre Kempenhaeghe, Heeze, Netherlands, 3Philips Research, Eindhoven, Netherlands, 4Department of Psychiatry, Amsterdam University Medical Center, Amsterdam, Netherlands, 5Department of Biomedical Engineering, Eindhoven University of Technology, Eindhoven, Netherlands, 6Philips Healthcare, Best, Netherlands
Synopsis
Keywords: Psychiatric Disorders, fMRI (task based), Multi-echo imaging
Objective prognosis of major depressive disorder (MDD) based on functional MRI (fMRI) biomarkers remains problematic due an abundance of physiological and motion confounders. Multi-echo imaging enhances the BOLD sensitivity while reducing signal loss. Here, we evaluate the effect of different multi-echo combinations on MDD symptom improvement prediction in an emotional face-matching fMRI task. We demonstrate improved signal quality and activation contrast for multi-echo combinations in the amygdala and hippocampus and predict 3-months and 6-months MDD symptom improvement with 91% and 87% accuracy, respectively. These results highlight the benefits of novel multi-echo acquisitions for prognosis in psychiatric disorders.Introduction
Objective prognosis of major depressive disorder (MDD) based on functional MRI (fMRI) remains challenging, partly due to an abundance of physiological and motion confounders and susceptibility artifacts in deeper located subcortical and inferior anterior regions1–4. Increased amygdala activity during negative emotional face-matching tasks is often reported in patients with MDD5–8. Yet, studies predicting longitudinal symptom improvement in MDD are scarce9,10. Multiband multi-echo acquisitions improve the BOLD sensitivity, reduce signal losses in regions prone to susceptibility artifacts and allow for improved spatial or temporal resolution11. In this work we acquired multi-echo scans of an emotion face-matching task with the aim of predicting 3-months and 6-months MDD symptom improvement. The signal quality, activation contrasts and symptom improvement prediction performance was compared between several echo combination schemes.Methods
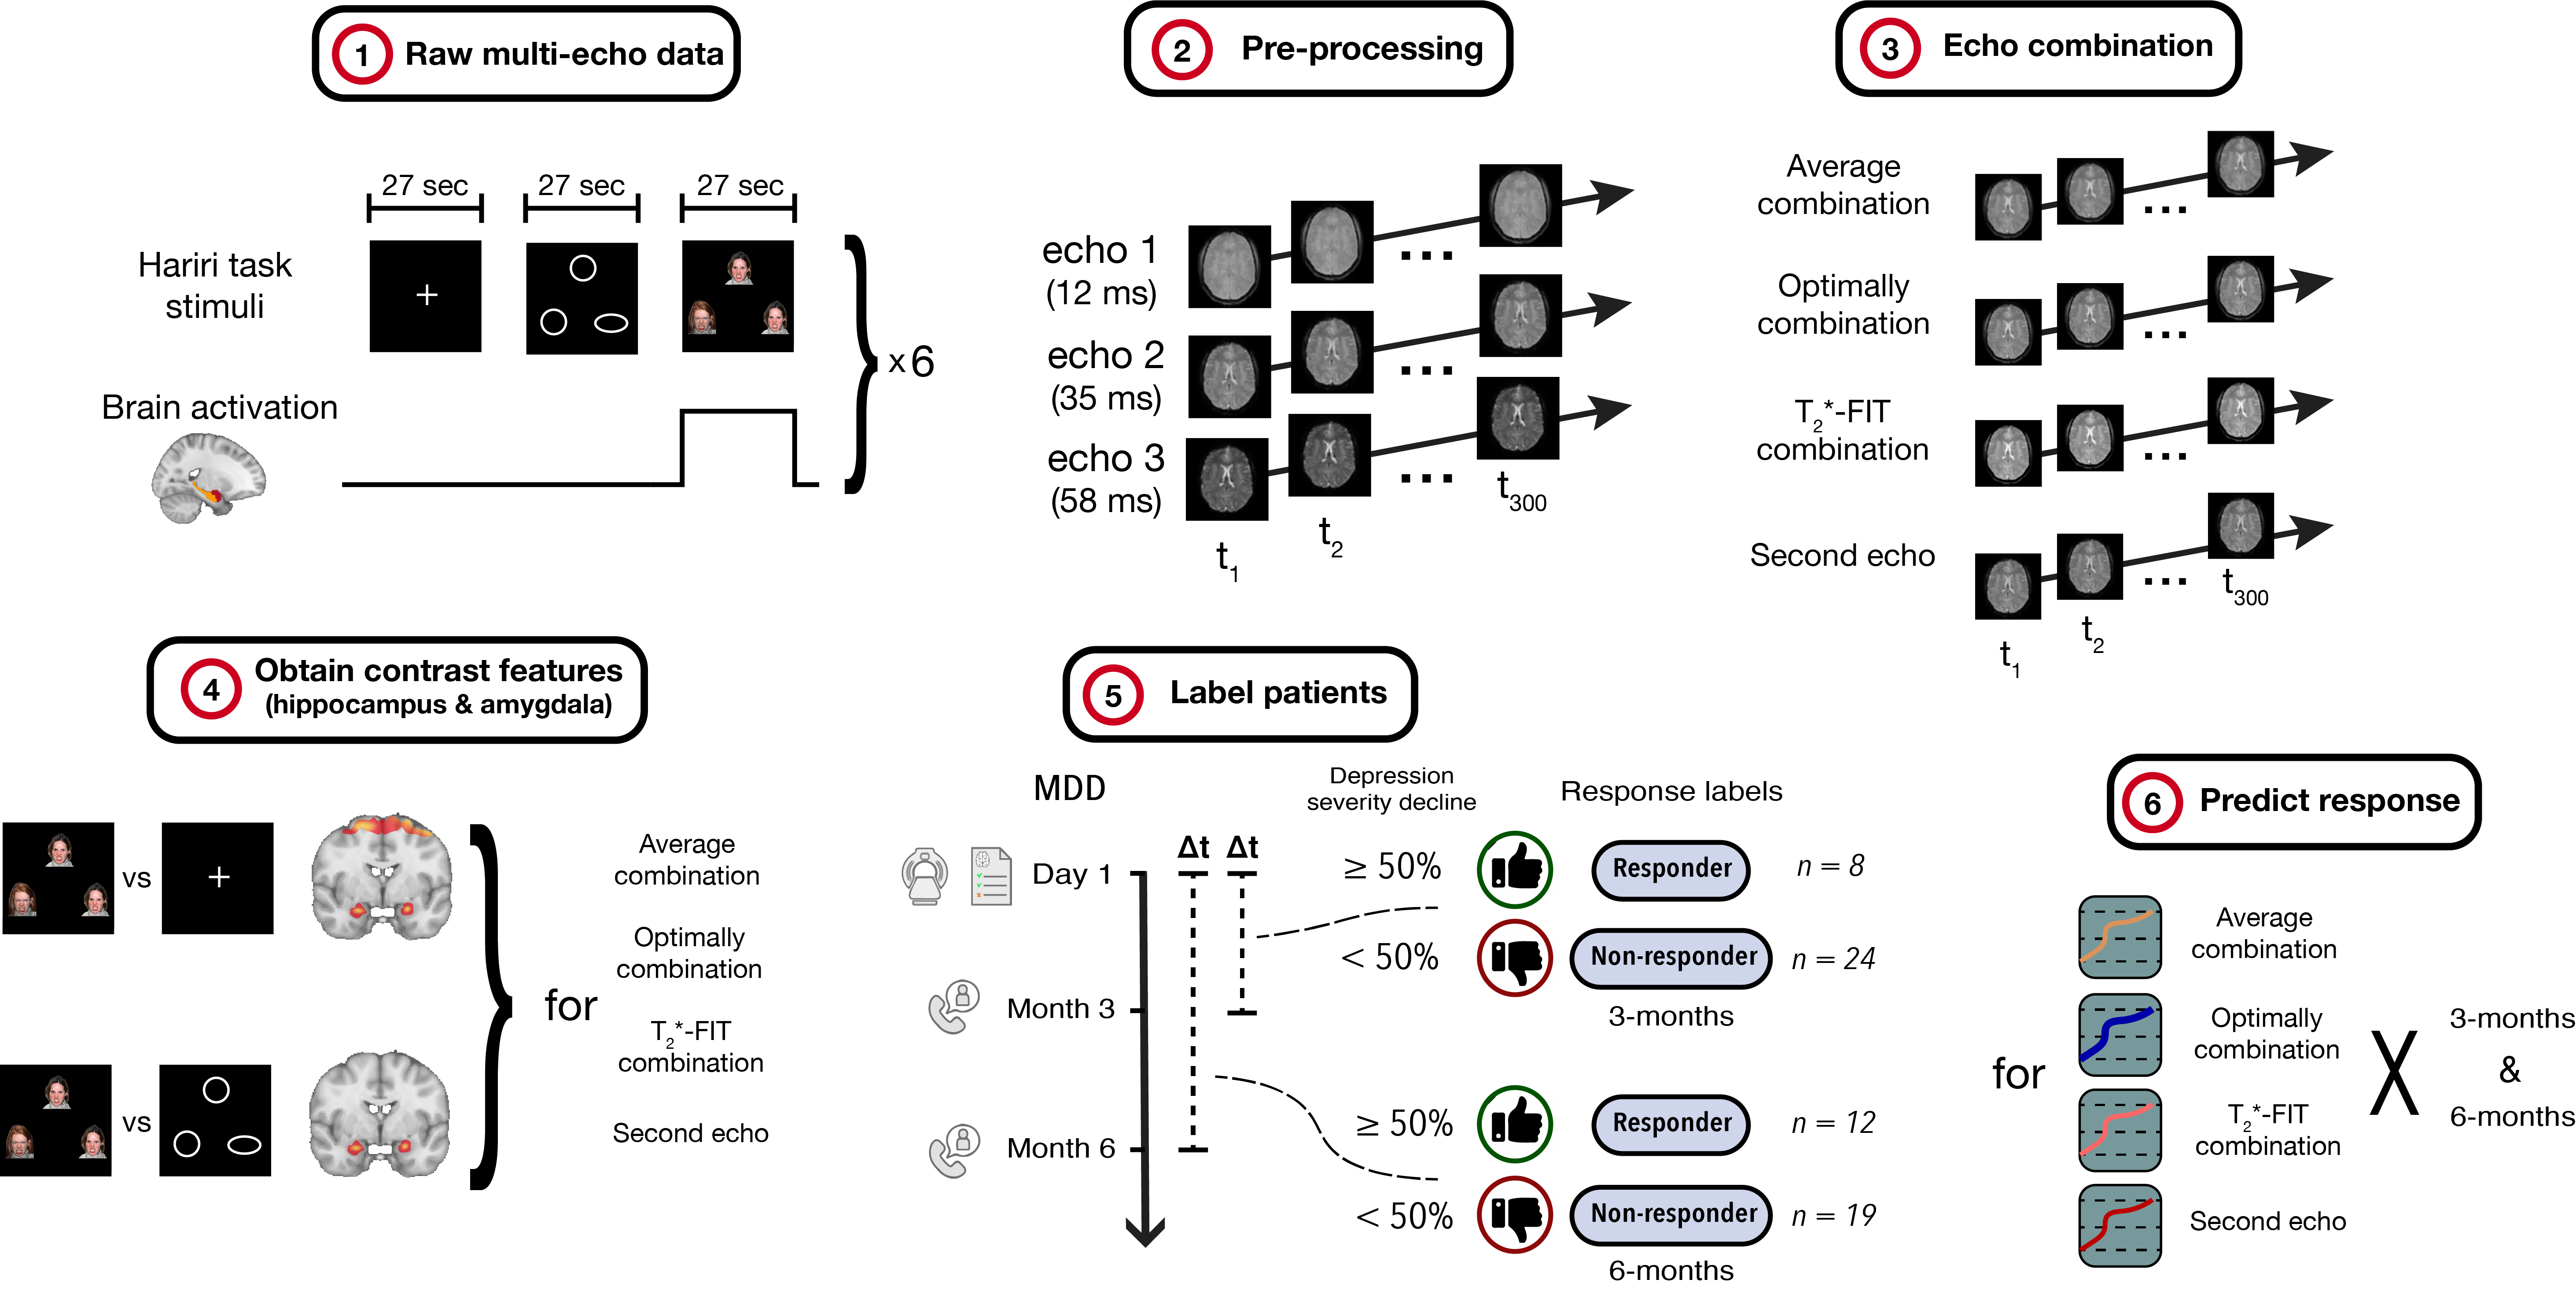
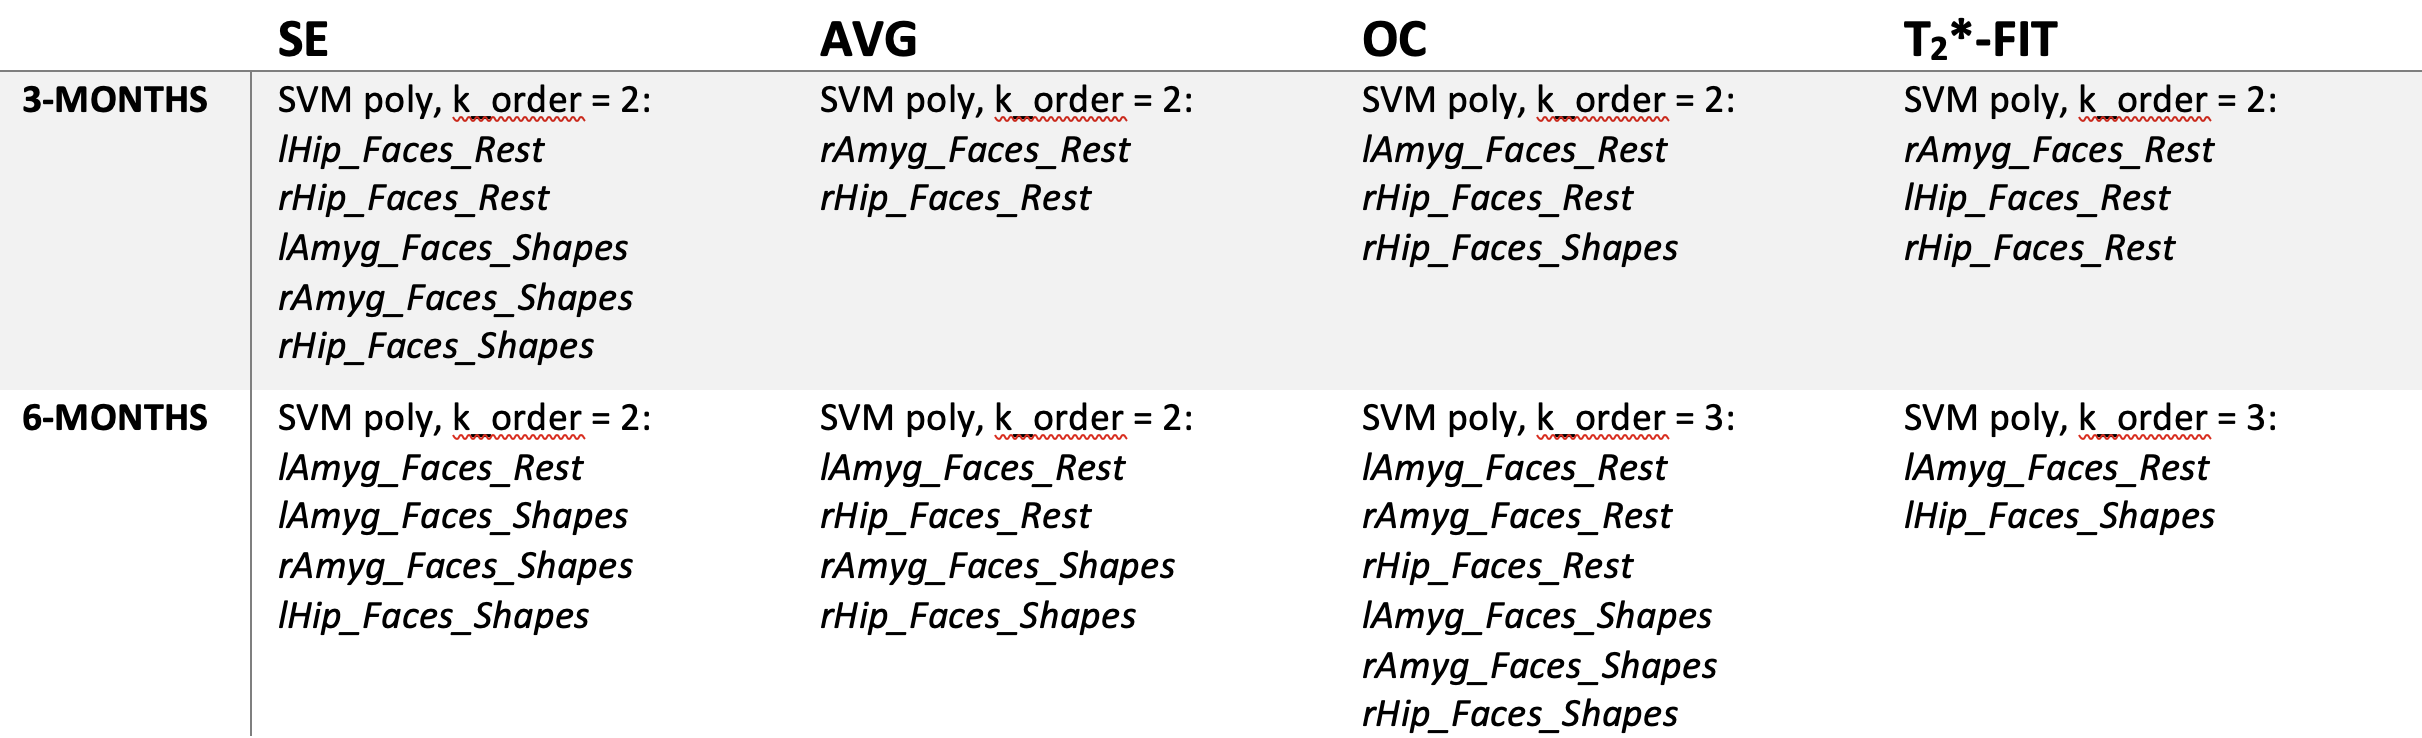
Thirty-two MDD patients (age 43.8 ± 13.4 years, 20 females) were included after assessment by a board-certified psychiatry resident. Exclusion criteria included concurrent neurological or psychiatric disorders, more than 3 previous episodes, a current episode longer than 2 years and previous electro-stimulation treatment. All patients received an MRI examination at baseline. The Hamilton Depression Rating Scale (HDRS) was obtained at baseline, 3-months and 6-months follow-up to assess depression severity. T1-weighted and task-based fMRI images were acquired using a Philips Achieva dStream 3T scanner. Parameters for the T1-weighted scan include a 1 x 1 x 1 mm voxel resolution, TR = 8.1 ms, TE = 3.7 ms and compressed SENSE factor 4.6. The fMRI images were acquired using an echo-planar imaging sequence with a 2.3 x 2.3 x 2.7 mm voxel resolution, 380 volumes, TR = 1350 ms, TE = 11.3, 31.8, 52.3 ms, multiband factor 3, SENSE factor 2.5. The echo images were slice timing corrected and realigned before being combined by a weighted average. Weight estimation was based on several combination schemes: average weighting (Avg) and T2*-based weighting with T2* maps calculated over all volumes12 (“optimally combined”, OC) or per volume13 (T2*-FIT). Additionally, the second echo (SE) was analysed as reference. Subsequently, the coregistered T1-weighted and fMRI images were normalized to MNI space. The latter were smoothed with a 5mm full-width at half-maximum kernel. During the fMRI scan, patients performed the Hariri task14, a well-validated emotional face-matching paradigm that includes blocks of rest, shapes and sad or angry faces. T-value contrast maps were calculated for faces-rest and faces-shapes conditions. A general linear model was fitted including externally monitored cardiac- and respiratory-derived regressors and motion confounders. Patients with a HDRSfollow-up ≤ 50% compared to HDRSbaseline were classified as responder, whereas the others were labelled as non-responder15,16. Binary classification between response groups was performed using polynomial support vector machine (kernel order 2-4) and decision tree (max splits 2-4) classifiers and validated by leave-one-out cross validation. The features were activation contrasts of faces-rest and faces-shapes in both amygdalae and hippocampi, derived from each ME combination and SE. Classifications were run for each ME combination and SE separately. A schematic of the methodology is shown in Figure 1.Results
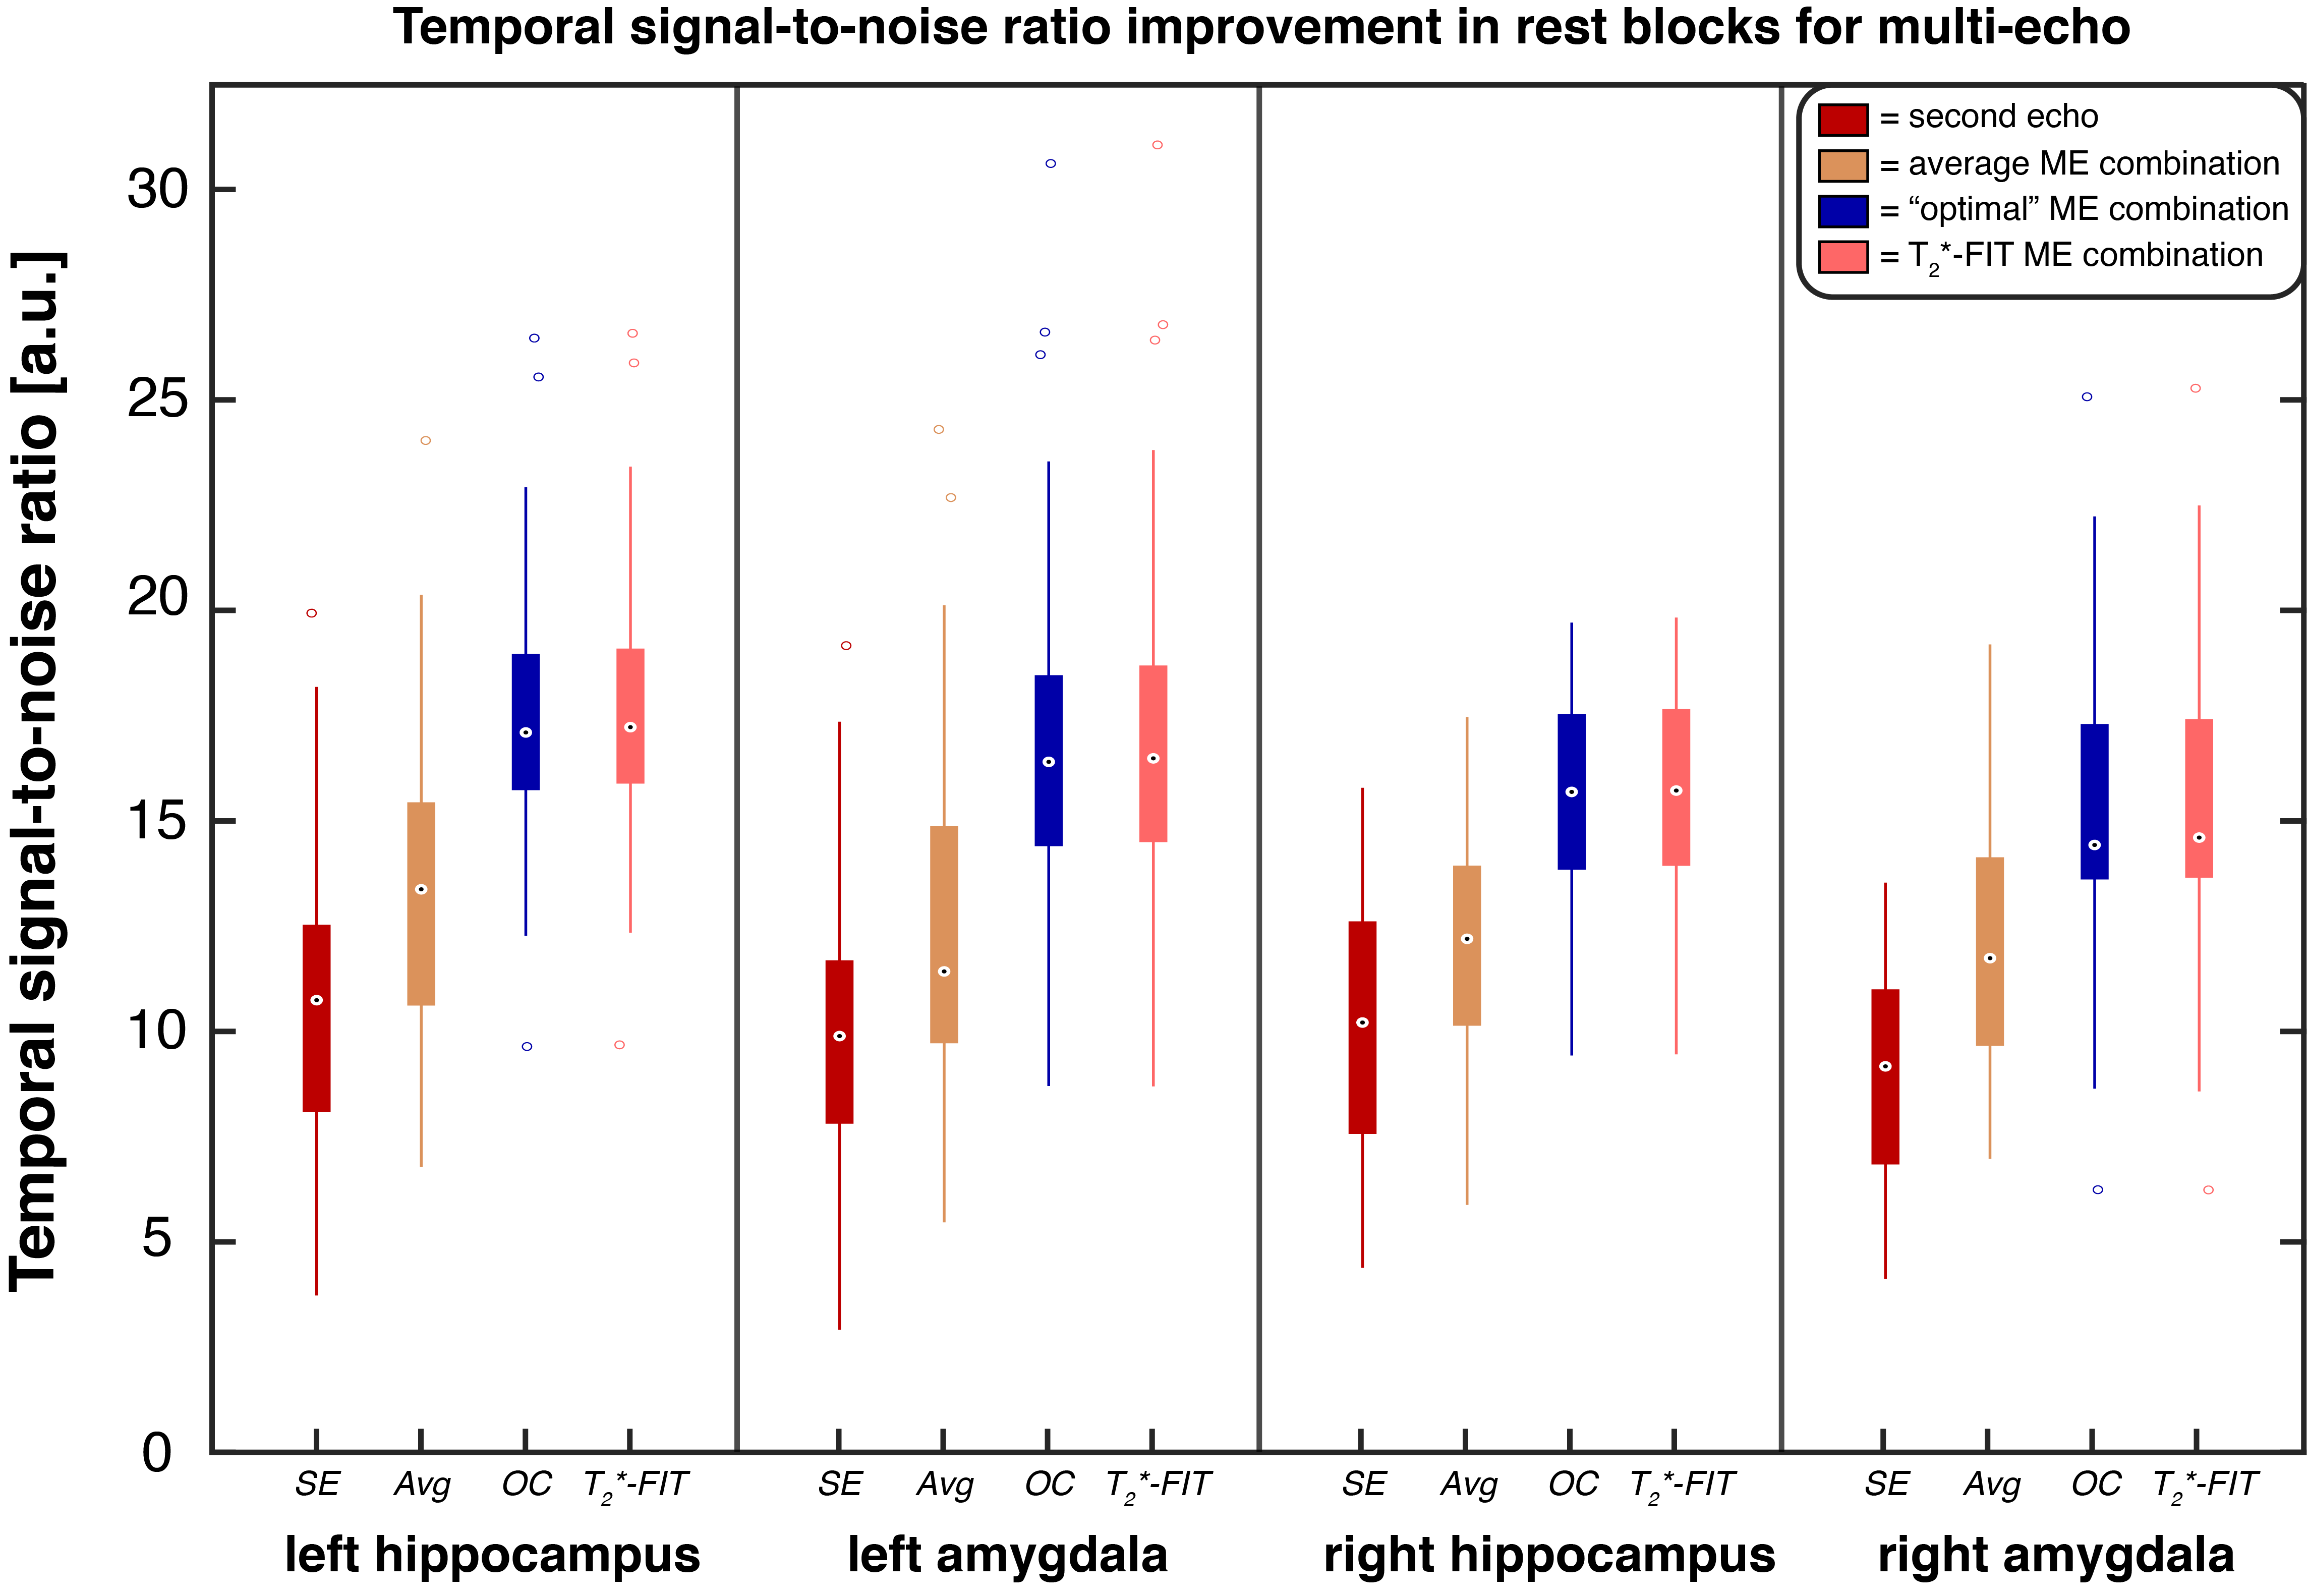
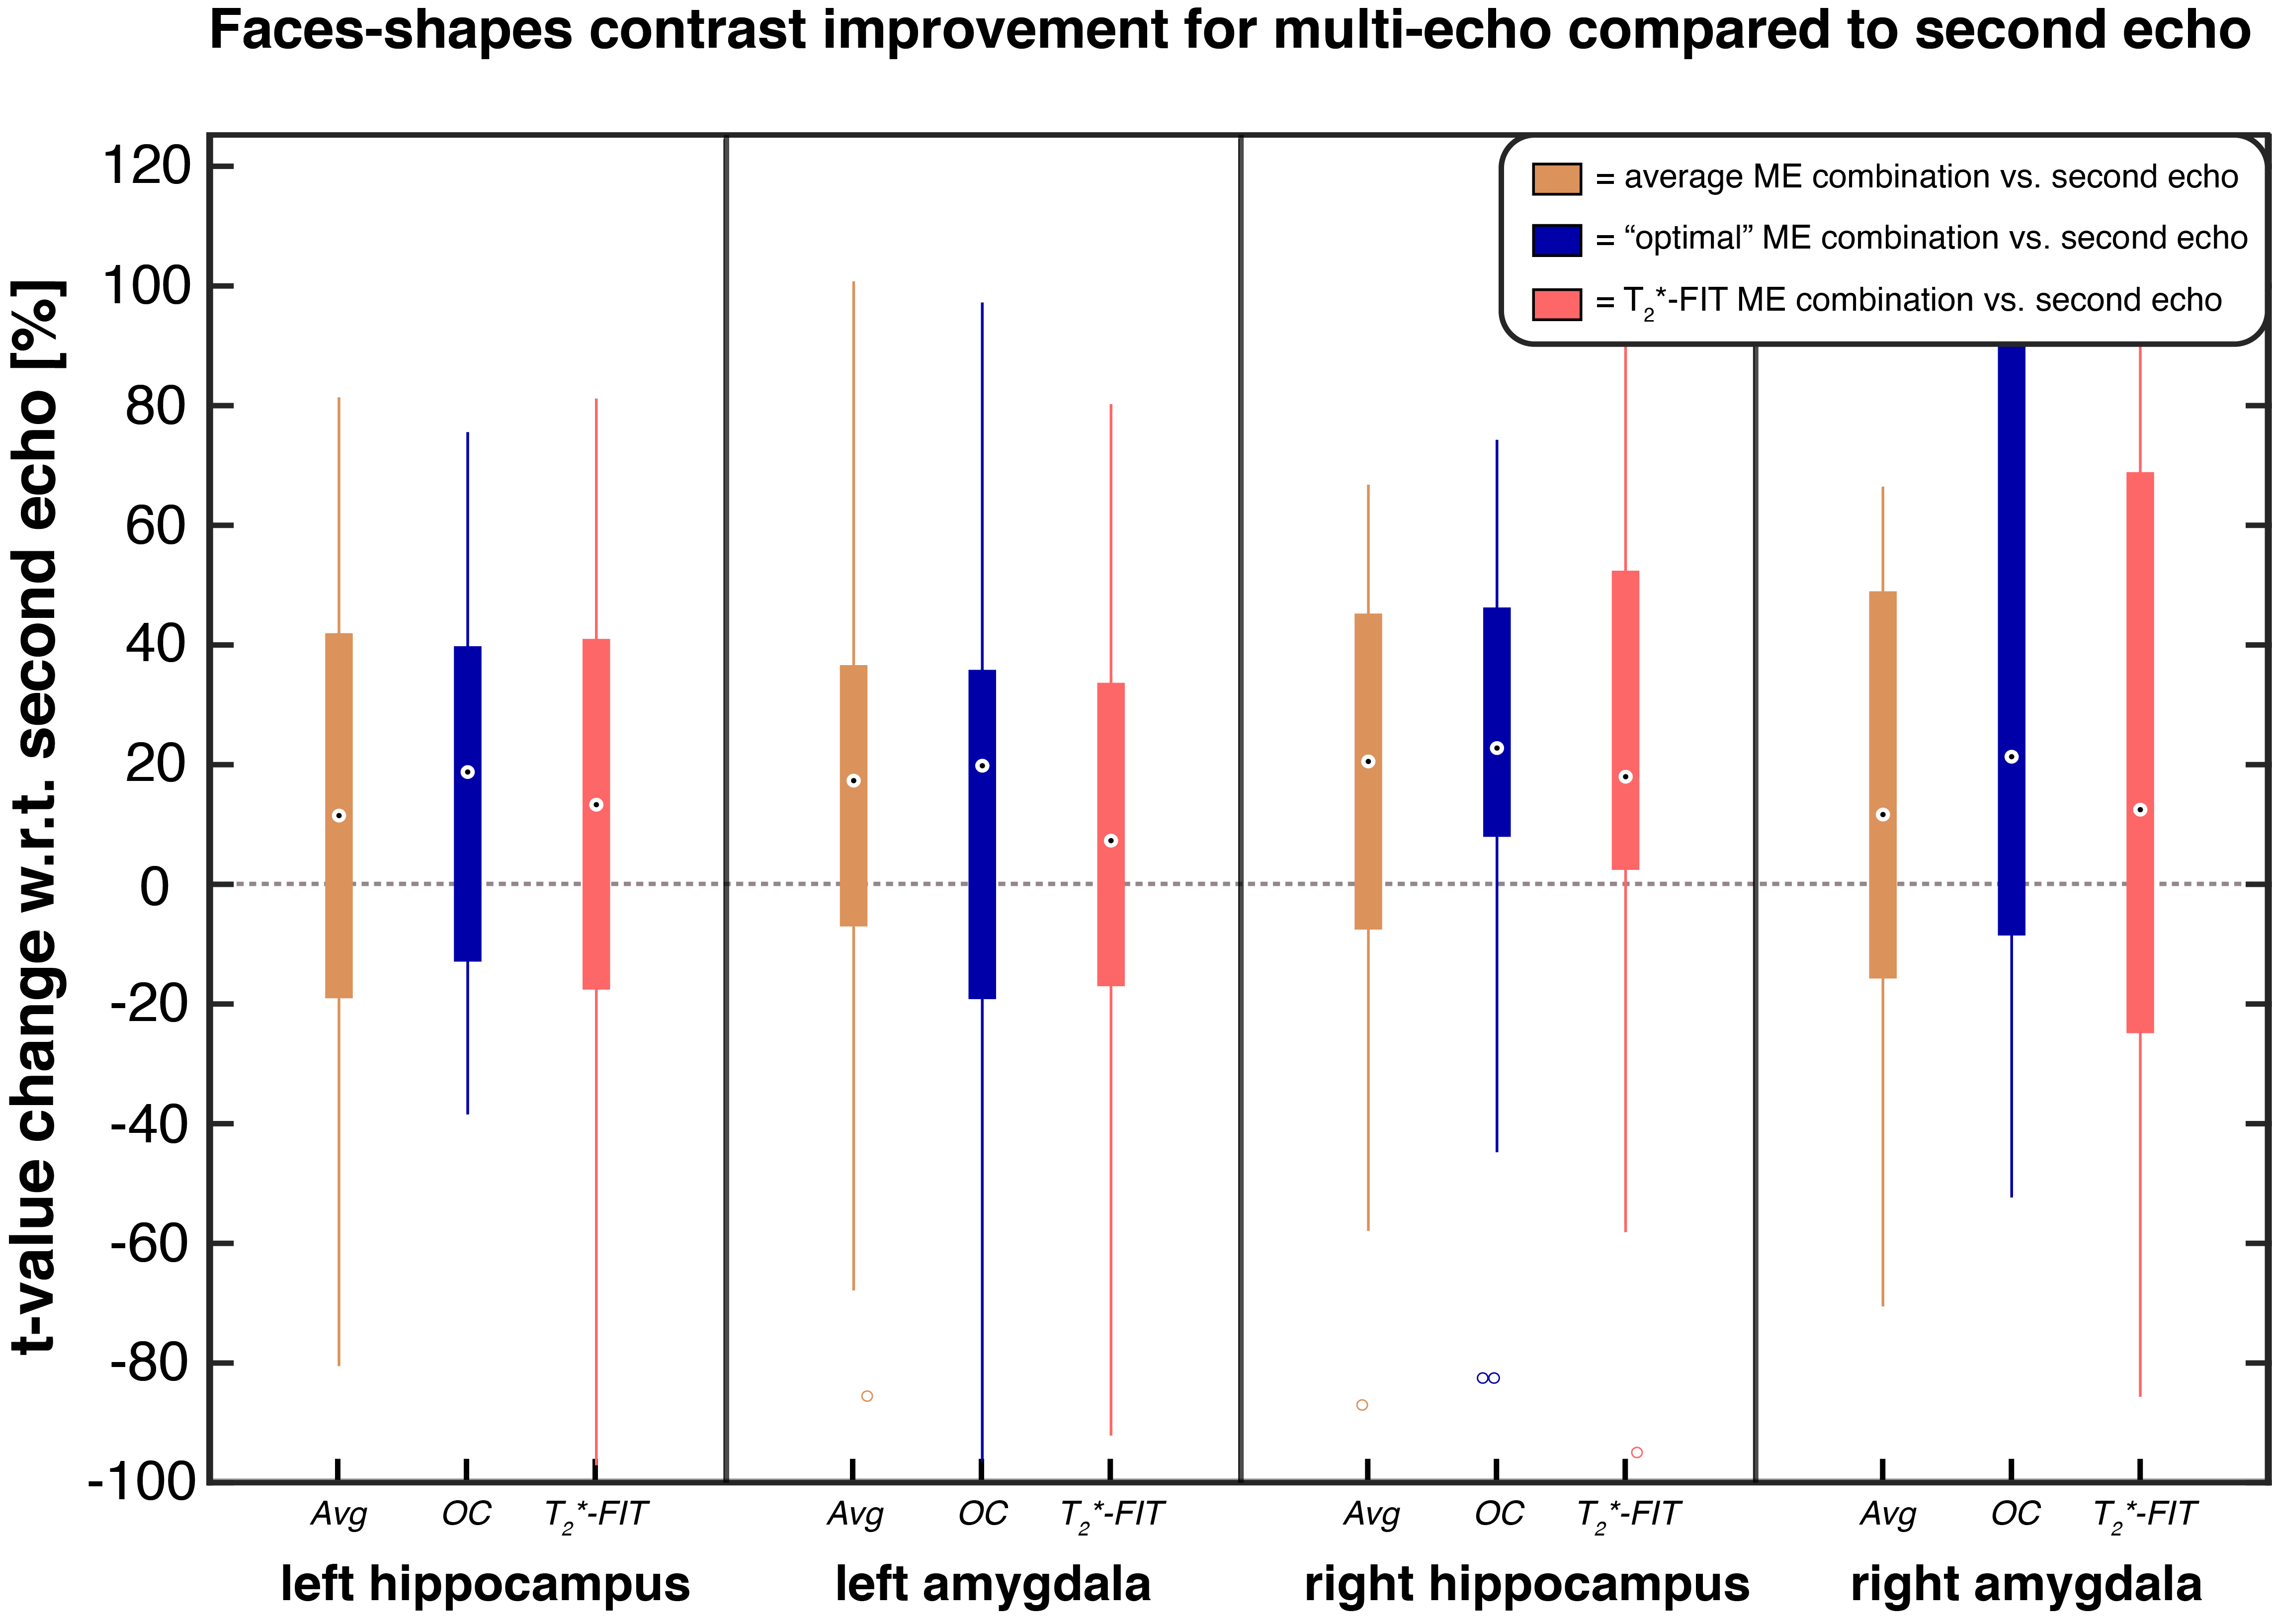
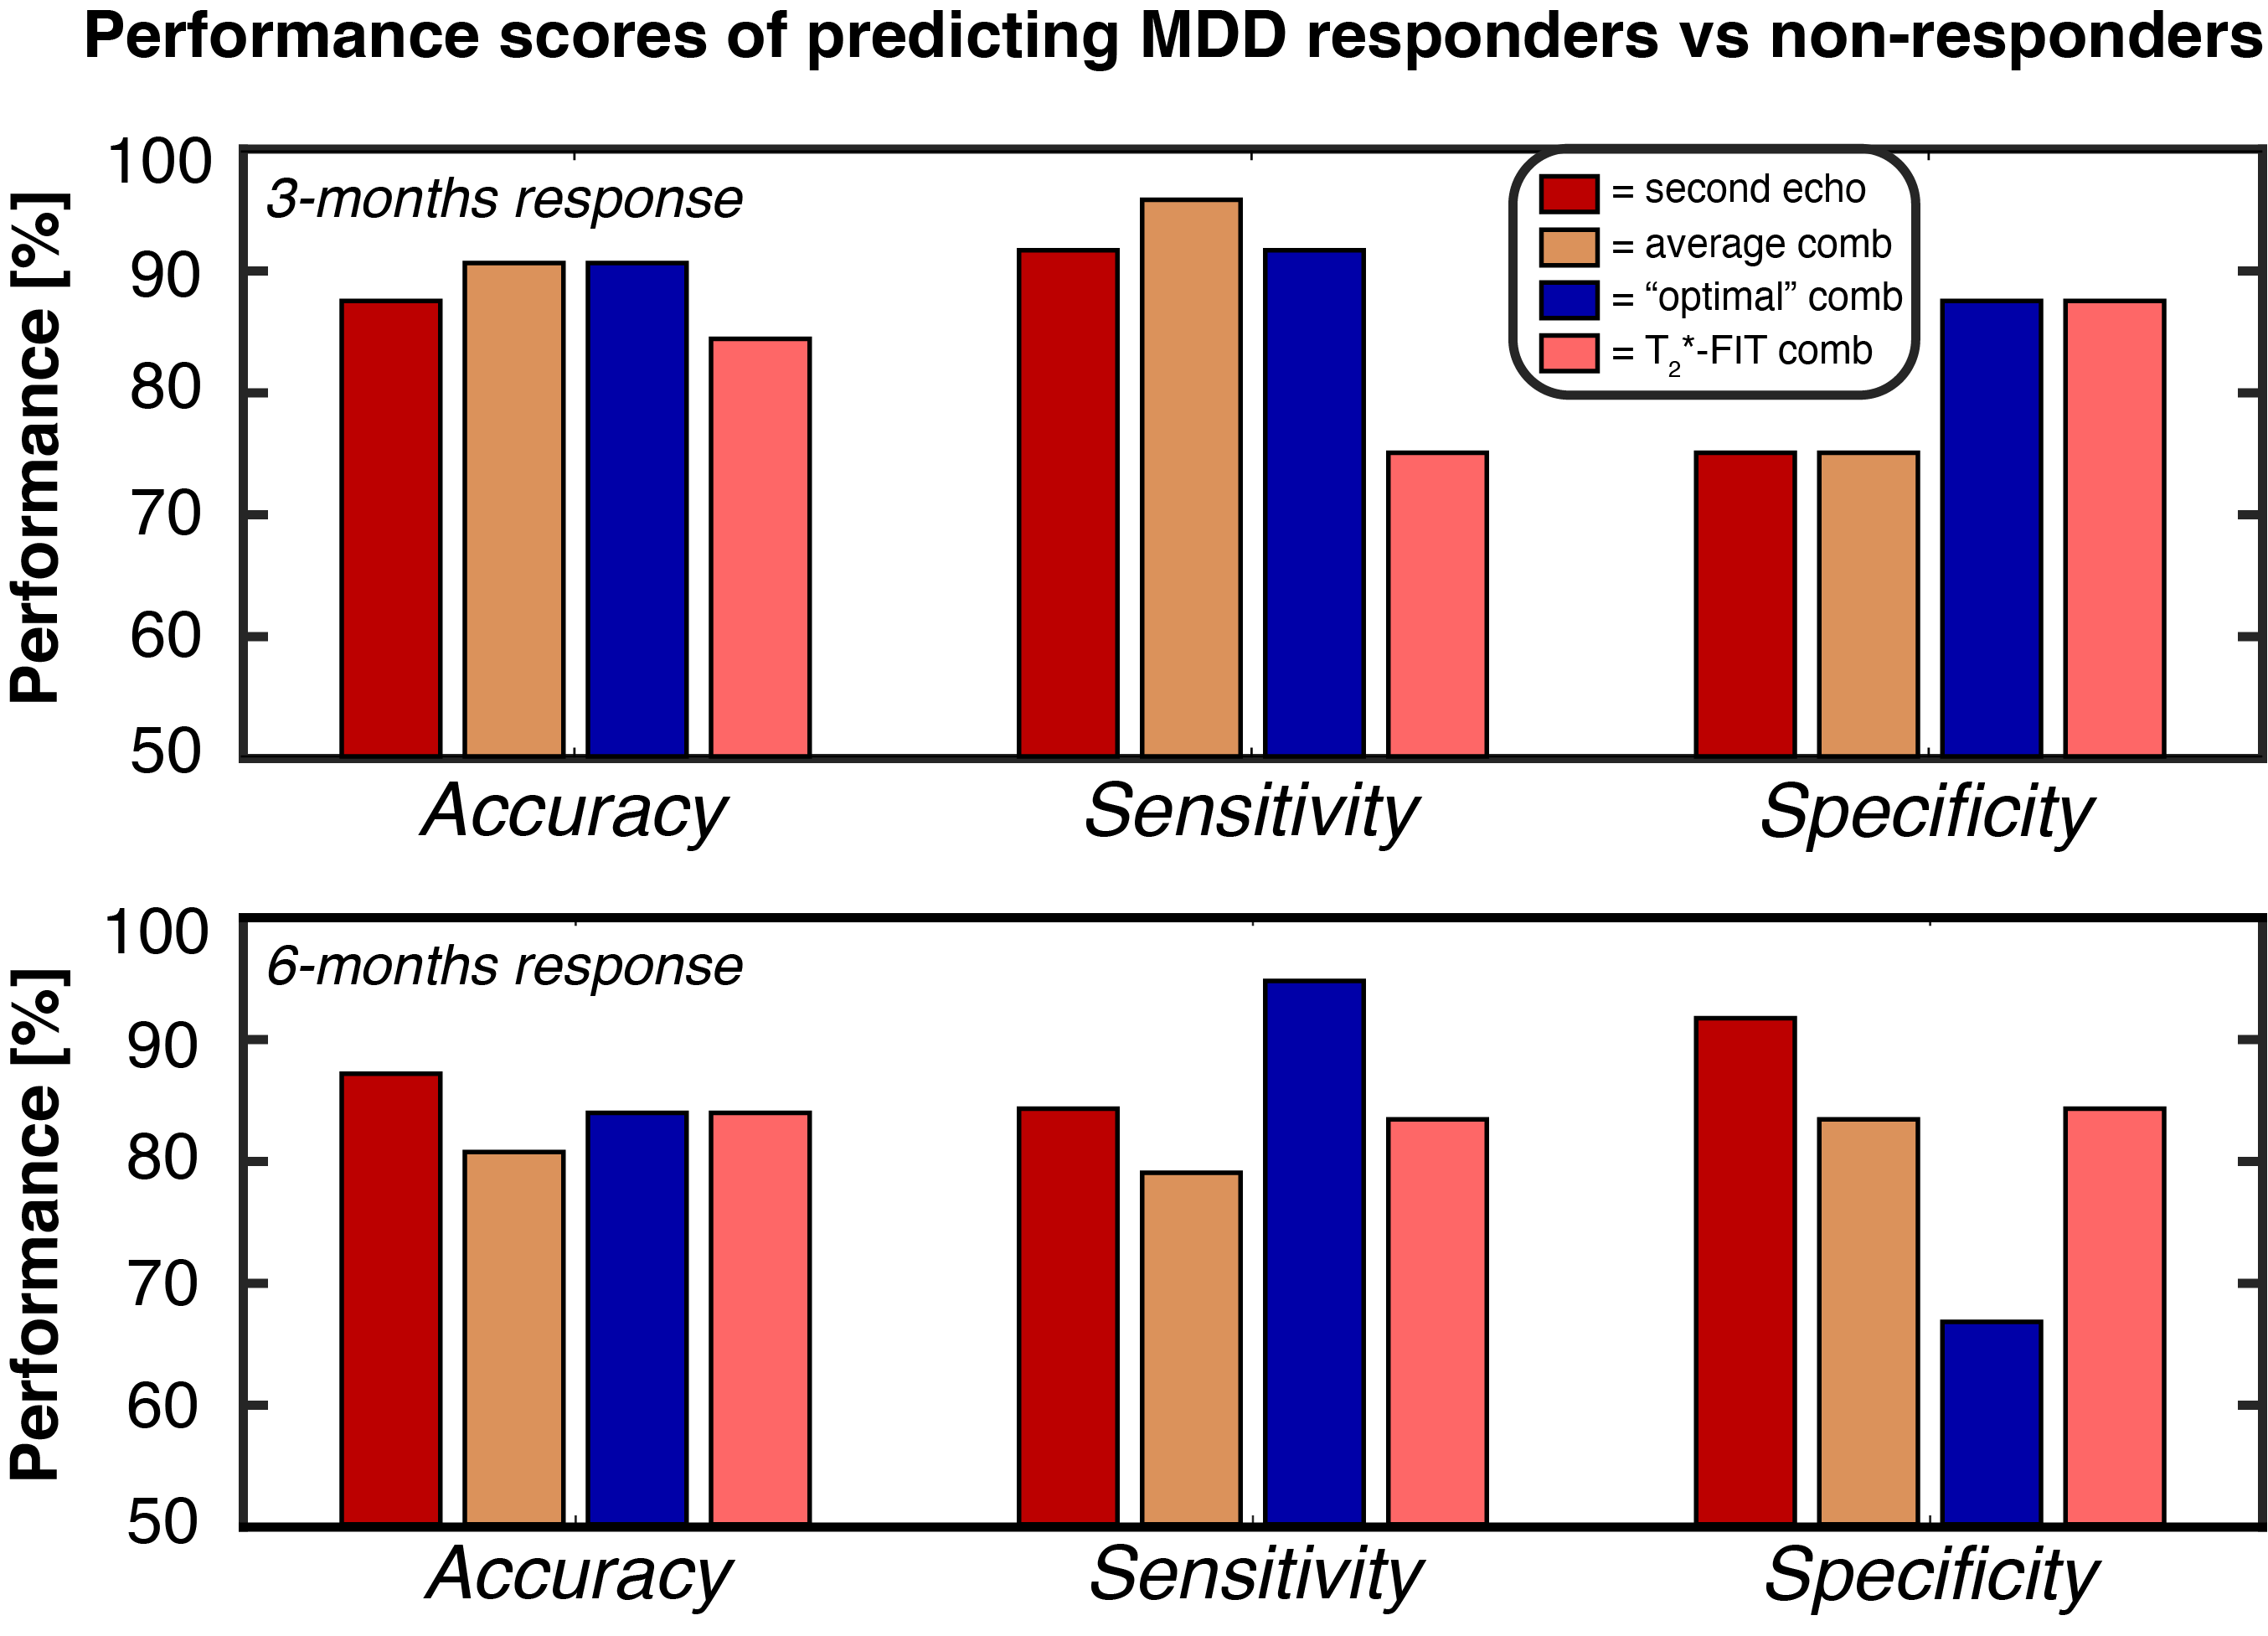
To evaluate the effect of multi-echo combinations on signal quality, the temporal signal-to-noise ratio (tSNR) was calculated during rest blocks for each ME combination and SE, see Figure 2. The tSNR was the highest for OC and T2*-FIT in all four regions-of-interest. To further assess the differences in contrasts, the mean t-values of each region were calculated for the combination methods, see Figure 3. The overall spread was relatively high but the majority of subjects showed a t-value increase of minimally 10-20% for the multi-echo combinations in all regions. The Avg and OC combination features predicted 3-months response with 91% accuracy, see Figure 4 and Table 1. The 6-months response could be predicted with 87% accuracy by SE-derived features. Minimal difference was found between the combination methods.Discussion
The overall enhancement in signal quality and activation contrast highlights the benefits of multiband multi-echo sequences in emotional task-based fMRI, which activate brain regions that are prone to susceptibility-induced artifacts. Moreover, features derived from this fMRI acquisition demonstrated to be highly valuable for prediction of MDD symptom improvement. Yet, the increased data quality and contrast (for Avg, OC and T2*-FIT) did not translate into higher classification scores (SE achieved similar performance). One explanation is that the 6-months prediction of SE relies heavily on amygdala contrasts whereas in the 3-months prediction it does not. Some subjects show high decreases in amygdala contrast for the ME combinations, which could have caused lower performance for the 6-months prediction compared to 3-months. Despite that, classification performance was high for all combinations (80-91% accuracy) whereas differences were minimal. In the subsequent study, frontal regions such as the lateral prefrontal cortex or anterior cingulate cortex will also be incorporated in addition to clinical variables such as demographics and treatment use.Conclusion
Based on a multiband multi-echo sequence, we showed overall improvement in signal quality and emotion-related activation contrast in the amygdala and hippocampus. 3-months and 6-months response in MDD could be predicted with high accuracy based on these features. This demonstrates the potential of multiband multi-echo fMRI for prognosis in psychiatric disorders.Acknowledgements
No acknowledgement found.References
1. Caballero-Gaudes C, Reynolds RC. Methods for cleaning the BOLD fMRI signal. NeuroImage. 2017;154:128-149. doi:10.1016/j.neuroimage.2016.12.0182.
2. Pais-Roldán P, Biswal B, Scheffler K, Yu X. Identifying Respiration-Related Aliasing Artifacts in the Rodent Resting-State fMRI. Front Neurosci. 2018;12. doi:10.3389/fnins.2018.007883.
3. Cordes D, Turski PA, Sorenson JA. Compensation of susceptibility-induced signal loss in echo-planar imaging for functional applications. Magnetic Resonance Imaging. 2000;18(9):1055-1068. doi:10.1016/S0730-725X(00)00199-54.
4. Weiskopf N, Hutton C, Josephs O, Turner R, Deichmann R. Optimized EPI for fMRI studies of the orbitofrontal cortex: compensation of susceptibility-induced gradients in the readout direction. MAGMA. 2007;20(1):39-49. doi:10.1007/s10334-006-0067-65.
5. Boukezzi S, Costi S, Shin LM, et al. Exaggerated amygdala response to threat and association with immune hyperactivity in depression. Brain, Behavior, and Immunity. 2022;104:205-212. doi:10.1016/j.bbi.2022.05.0156.
6. Dannlowski U, Ohrmann P, Bauer J, et al. Amygdala reactivity to masked negative faces is associated with automatic judgmental bias in major depression: a 3 T fMRI study. J Psychiatry Neurosci. 2007;32(6):423-429.7.
7. Sheline YI, Barch DM, Donnelly JM, Ollinger JM, Snyder AZ, Mintun MA. Increased amygdala response to masked emotional faces in depressed subjects resolves with antidepressant treatment: an fMRI study. Biol Psychiatry. 2001;50(9):651-658. doi:10.1016/s0006-3223(01)01263-x8.
8. Yang TT, Simmons AN, Matthews SC, et al. Adolescents with major depression demonstrate increased amygdala activation. J Am Acad Child Adolesc Psychiatry. 2010;49(1):42-51.9.
9. Canli T, Cooney R, Goldin P, et al. Amygdala reactivity to emotional faces predicts improvement in major depression. Neuroreport. 2005;16(12):1267-1270. doi:10.1097/01.wnr.0000174407.09515.cc10.
10. Mattson WI, Hyde LW, Shaw DS, Forbes EE, Monk CS. Clinical neuroprediction: Amygdala reactivity predicts depressive symptoms 2 years later. Social Cognitive and Affective Neuroscience. 2016;11(6):892-898. doi:10.1093/scan/nsw01811.
11. Kundu P, Voon V, Balchandani P, Lombardo MV, Poser BA, Bandettini PA. Multi-echo fMRI: A review of applications in fMRI denoising and analysis of BOLD signals. NeuroImage. 2017;154:59-80. doi:10.1016/j.neuroimage.2017.03.03312.
12. Posse S, Wiese S, Gembris D, et al. Enhancement of BOLD-contrast sensitivity by single-shot multi-echo functional MR imaging. Magnetic Resonance in Medicine. 1999;42(1):87-97. doi:10.1002/(SICI)1522-2594(199907)42:1<87::AID-MRM13>3.0.CO;2-O13.
13. Heunis S, Breeuwer M, Caballero-Gaudes C, et al. The effects of multi-echo fMRI combination and rapid T2*-mapping on offline and real-time BOLD sensitivity. NeuroImage. 2021;238:118244. doi:10.1016/j.neuroimage.2021.11824414.
14. Hariri AR, Tessitore A, Mattay VS, Fera F, Weinberger DR. The Amygdala Response to Emotional Stimuli: A Comparison of Faces and Scenes. NeuroImage. 2002;17(1):317-323. doi:10.1006/nimg.2002.117915.
15. Husain N, Chaudhry N, Fatima B, et al. Antidepressant and group psychosocial treatment for depression: a rater blind exploratory RCT from a low income country. Behav Cogn Psychother. 2014;42(6):693-705. doi:10.1017/S135246581300044116.
16. Bobo WV, Angleró GC, Jenkins G, Hall-Flavin DK, Weinshilboum R, Biernacka JM. Validation of the 17-item Hamilton Depression Rating Scale definition of response for adults with major depressive disorder using equipercentile linking to Clinical Global Impression scale ratings: analysis of Pharmacogenomic Research Network Antidepressant Medication Pharmacogenomic Study (PGRN-AMPS) data. Hum Psychopharmacol. 2016;31(3):185-192. doi:10.1002/hup.2526
Figures