4929
Analysis of Dynamic Network Reconfiguration in First-Episode, Drug-Naive Patients with Major Depressive Disorder Based Multilayer Network
Yingying Wang1, Mengyue Tang1, Zilin Zhou1, Yingxue Gao1, Linxiao Cao1, Hailong Li1, Xinyue Hu1, Weijie Bao1, Kaili Liang1, Lianqing Zhang1, Weihong Kuang2, Qiyong Gong1, and Xiaoqi Huang1
1Huaxi MR Research Center (HMRRC), Functional and Molecular Imaging Key Laboratory of Sichuan Province, Department of Radiology, West China Hospital of Sichuan University, Chengdu, China., Chengdu, China, 2Department of Psychiatry, West China Hospital of Sichuan University, Chengdu, China
1Huaxi MR Research Center (HMRRC), Functional and Molecular Imaging Key Laboratory of Sichuan Province, Department of Radiology, West China Hospital of Sichuan University, Chengdu, China., Chengdu, China, 2Department of Psychiatry, West China Hospital of Sichuan University, Chengdu, China
Synopsis
Keywords: Psychiatric Disorders, Neuro
We collected resting-state fMRI data from 115 patients with major depressive disorder (MDD) and 120 healthy controls (HC). The GenLouvain community detection algorithm was performed to identify the temporal evolution of community in the multilayer network. Recruitment and integration coefficients were calculated according to the module allegiance matrix to quantify the dynamic characteristic of a node within each of the networks. We found aberrant recruitment and integration coefficients in MDD patients and their significant correlations with clinical scores, and such abnormally dynamic network reconfiguration provides a new perspective to explain the neurobiological characteristics of MDD patients.Introduction
Major depressive disorder (MDD) is a common psychiatric illness, with clinical manifestations of persistently depressed mood, loss of interest, and cognitive dysfunction[1]. Recently, accumulating evidence from neuroimaging studies shows that MDD is characterized by neurodevelopmental abnormalities that are embodied in not only local architecture but also large-scale network organization of the brain[2]. Network analysis shows that as a complex system, human brain networks can spontaneously form modules or communities. Some studies have confirmed that abnormal brain community structure is related to the cognitive behavior of MDD patients[3]. However, these studies are based on a singlelayer network, which ignores the changes in community structure over time. So in current study, we used a novel model named “multilayer network” to investigated how the time-varying network reconfiguration in MDD patients differs from that in healthy people.Methods
This study recruited 115 patients with MDD (46 males and 69 females, age 30.14±9.45 years) and 120 age-, sex-matched healthy controls (HC) (51 males and 69 females, age 28.98±9.35 years). We used the 14-item Hamilton Anxiety Scale (HAMA) and 17-item Hamilton Depression Scale (HAMD) to assess accompanying anxiety and depression symptoms in MDD patients.The fMRI signals were parcellated into 264 regions of interest (ROIs) using a functionally defined atlas containing brain areas preallocated into 13 resting-state networks (RSNs), which include the sensory-somatomotor hand / mouth (SMN), cingulo-opercular (CON), auditory (AN), default mode (DMN), memory retrieval (MRN), visual (VN), frontoparietal (FPN), salience (SAN), subcortical (SCN), ventral attention (VAN), cerebellar (CN), dorsal attention (DAN), and uncertain networks. In the current study the undefined regions were removed in the template, leaving 236 brain areas that were distributed in 12 RSNs. We applied sliding window technique with a window size of 50 TR (100 seconds) and the shifting step size of 1 TR. The GenLouvain community detection algorithm was performed to identify the temporal evolution of community in the multilayer network. Module allegiance is calculated to characterize the consistency of community assignment between two nodes during the scan. Recruitment and integration coefficients were calculated according to the module allegiance matrix to quantify the dynamic characteristic of a node within each of the networks. The recruitment coefficient corresponds to the probability of a node being in the same community as other nodes of the same network; the integration coefficient corresponds to the probability of a node being in the same community as nodes from other networks during community detection. These measures were averaged across each RSN and across the whole brain to obtain the RSN- and global-level recruitment and integration coefficients. A general linear model was used to test the differences of node-, RSN- and global-level measures (recruitment and integration) between the two groups with age, sex and mean FD as covariates. Pearson's correlation analysis was used to calculate the correlations between the scores of clinical symptoms and altered measures in patients group (p < 0.05).Results
The global-level recruitment and integration coefficients were not significantly different between MDD and HC groups. In the terms of RSN-level coefficients, compared to HC group, MDD patients exist decreased recruitment coefficient of the MRN (t = -2.907, p = 0.004, uncorrected), increased recruitment coefficient of the VAN (t = 2.362, p = 0.019, uncorrected) and CN (t = 2.780, p = 0.006, uncorrected), and increased integration coefficient of the DMN (t = 2.405, p = 0.017, uncorrected). When using FDR correction, only the differences of recruitment coefficients in certain networks are significant, which are decreased recruitment coefficient in the MRN (t = -2.907, p = 0.004, pFDR = 0.035) and increased recruitment coefficient of the CN (t = 2.780, p = 0.006, pFDR = 0.035). Detail information see the Figure 1. In the terms of node-level coefficients, when no correction process was performed, for the recruitment coefficient, 19 brain regions from 6 abnormal RSNs were significantly different between MDD and HC groups (Figure 2); details are as follows: 6 areas belonging to DMN, 4 areas belonging to MRN, one area belonging to FPN, 2 areas belonging to VAN, 4 areas belonging to CN, 2 areas belonging to DAN; for the integration coefficient, 31 brain regions from 3 abnormal RSNs were significantly different between MDD and HC groups (Figure 3); details are as follows: 29 areas belonging to DMN, one area belonging to FPN, one area belonging to SAN. After performing Pearson's correlation analysis between the scores of clinical symptoms and altered measures (recruitment and integration) in patients group (p < 0.05). We found that the recruitment of CN was negatively associated with the score of HAMD in MDD group (p < 0.05, Figure 4).Discussion and Conclusion
Compared with traditional networks, the advantage of a multilayer network is that it is equipped to model multiple interactions in the network across time. In our study, multilayer community detection and two metrics, namely, recruitment and integration, were introduced to explore abnormally dynamic network reconfiguration in MDD patients. The results indicated that, compared with healthy people, the tendency for the formation of intra-system and cross-system alliances were abnormal when the brain community was reconfigured in MDD patients. Thus, our study provides a new perspective to explain the neurobiological characteristics of MDD patients.Acknowledgements
This study is supported by grants from 1.3.5 Project for Disciplines of Excellence, West China Hospital, Sichuan University (ZYJC21041) and Clinical and Translational Research Fund of Chinese Academy of Medical Sciences (2021-I2M-C&T-B-097).References
[1] Pan Z, Park C, Brietzke E, et al. Cognitive impairment in major depressive disorder. CNS Spectr. 2019;24(1):22-29. doi:10.1017/S1092852918001207.
[2] Mulders PC, van Eijndhoven PF, Schene AH, et al. Resting-state functional connectivity in major depressive disorder: A review. Neurosci Biobehav Rev. 2015;56:330-344. doi:10.1016/j.neubiorev.2015.07.014.
[3] Sun S, Li X, Zhu J, et al. Graph Theory Analysis of Functional Connectivity in Major Depression Disorder With High-Density Resting State EEG Data. IEEE Trans Neural Syst Rehabil Eng. 2019;27(3):429-439. doi:10.1109/TNSRE.2019.2894423.
Figures
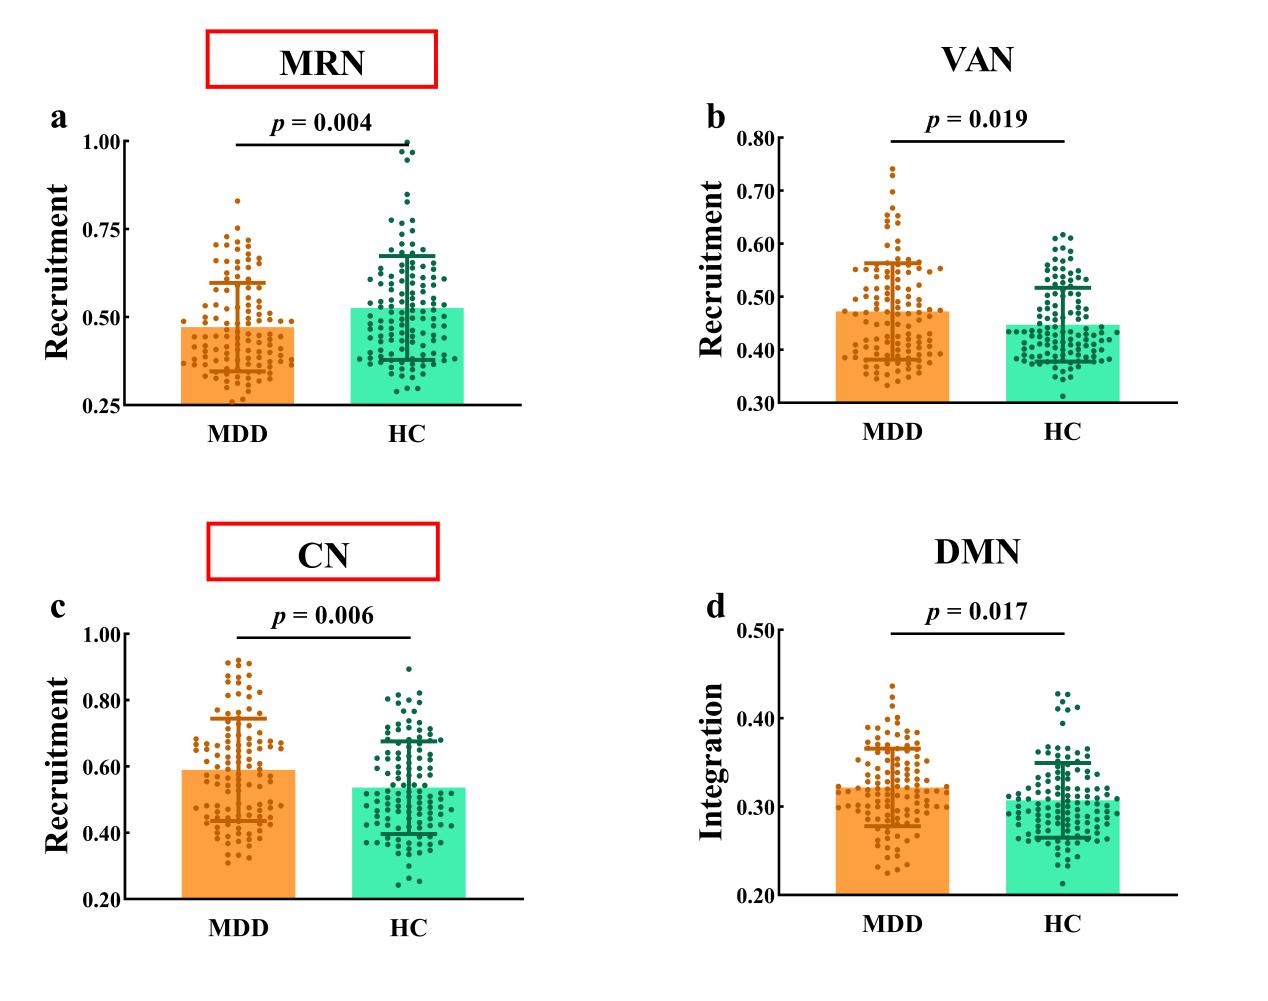
Figure 1 Group differences in recruitment and integration at the RSN level. (a) (b) and (c) represent recruitment coefficient; (d) represents integration coefficient. Networks with significant inter-group differences after FDR correction are framed in red boxes. Abbreviation: MDD = major depressive disorder; HC = healthy controls; RSN = resting-state network; MRN = memory retrieval network; VAN = ventral attention network; CN = cerebellar network; DMN = default mode network.
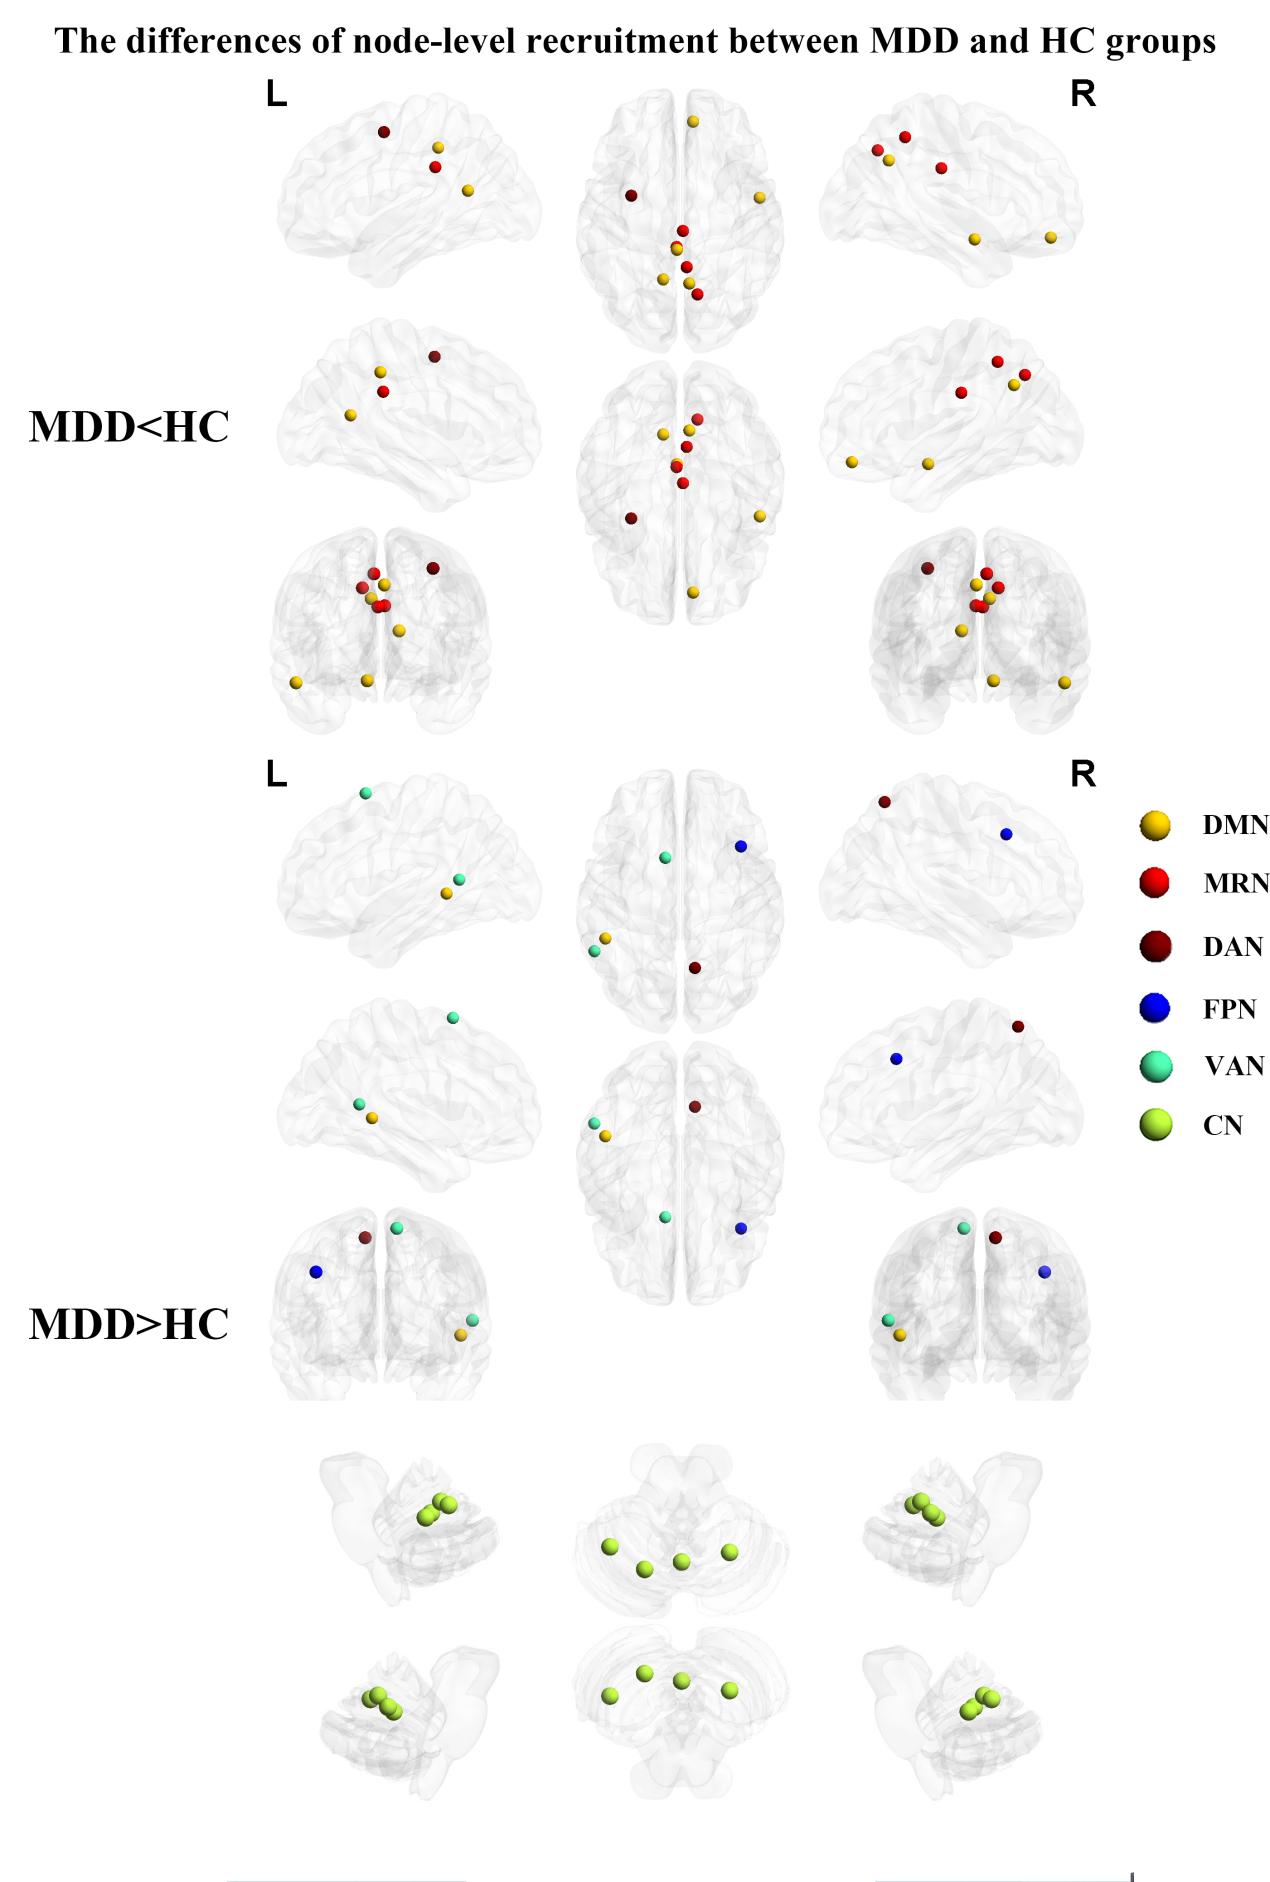
Figure 2 Brain maps of regions with significant differences of recruitment between MDD and HC groups. Abbreviation: MDD = major depressive disorder; HC = healthy controls; DMN = default mode network; MRN = memory retrieval network; DAN = dorsal attention network; FPN = frontoparietal network; VAN = ventral attention network; CN = cerebellar network.
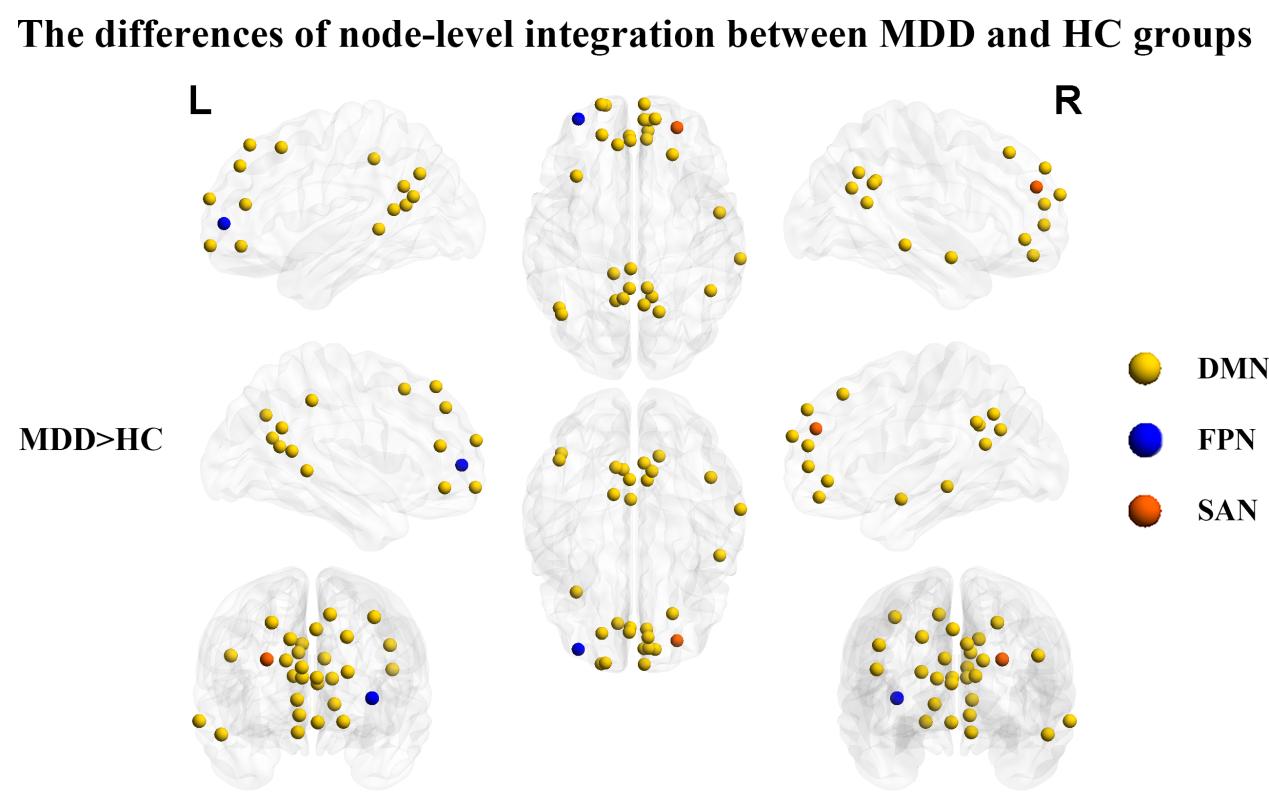
Figure 3 Brain maps of regions with significant differences of integration between MDD and HC groups. Abbreviation: MDD = major depressive disorder; HC = healthy controls; DMN = default mode network; FPN = frontoparietal network; SAN = salience network.
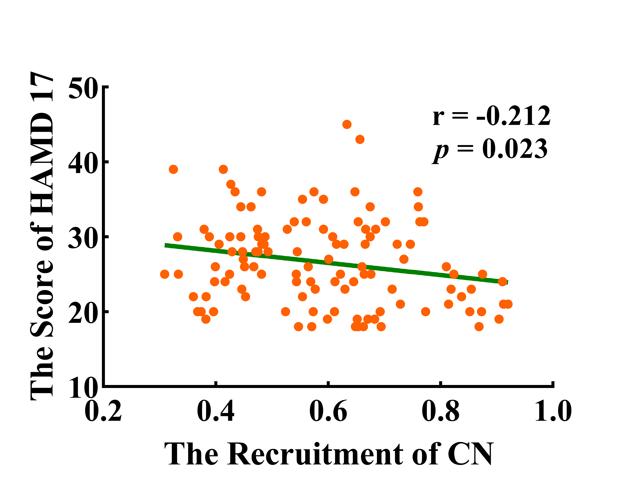
Figure 4 The recruitment of CN was negatively associated with the score of HAMD (r = -0.212, p = 0.023) in MDD group. Abbreviation: MDD = major depressive disorder; CN = cerebellar network; HAMD-17 = 17-item Hamilton Depression Scale.
DOI: https://doi.org/10.58530/2023/4929