4927
Quantification of gray matter abnormalities in drug‑naïve major depressive disorders by synthetic MRI1Medical Imaging Department, Nanfang Hospital, Guangzhou, China, 2MR Research, GE Healthcare, Beijing, China, Beijing, China, 3Department of Radiology, the First Affiliated Hospital of Kunming Medical University, Kunming, China, 4Department of Radiology, Zengcheng Branch of Nanfang Hospital, Guangzhou, China, 5Department of Radiology, First People's Hospital of Foshan, Foshan, China
Synopsis
Keywords: Psychiatric Disorders, Brain, Major depressive disorder
Major depressive disorder (MDD) is a common mental illness. Herein, we explored the differences in the whole-brain T1 and T2 relaxation times between drug-naïve major depressive disorder patients and healthy controls by synthetic MRI (SyMRI). The results showed altered T1 and T2 values in specific regions of the gray matter in MDD patients, which may be associated with alterations in the brain gray matter microstructure, such as excessive iron deposition. Thus, these quantitative variables may be promising imaging markers for further exploring the pathophysiological mechanisms of depression.Introduction
Major depressive disorder (MDD) is a common mental illness associated with growing economic, social, and personal burdens. Considering its pathophysiology is still unclear, psychotherapy remains the most effective treatment for MDD1. Previous study has shown that quantitative MRI parameters (T1, T2, etc.) can be used to assessing brain microstructure alterations caused by several diseases2. However, the relationship between the T1 and T2 relaxation times and MDD is still not fully understood. Synthetic MRI (SyMRI) provides B1-corrected T1 mapping and T2 mapping in 5-6 minutes with high reproducibility3,4. Therefore, this study aimed to explore the abnormalities of the T1 and T2 relaxation time caused by MDD using the SyMRI technique and further to uncover the potential microstructure abnormalities in patients with MDD.Methods
A total of 16 MDD patients were included in this study (ages range from 18 to 34 years, 2 males and 14 females). In addition, 49 age- and gender-matched healthy control (HC) subjects were recruited as a control group (ages range from 21 to 35 years, 16 males and 33 females). No significant difference in age or gender was found between the two groups (Table 1). All subjects were right-handed. HAMD, Beck Depression Inventory, and Hamilton Anxiety Scale (HAMA) were used to evaluate depressive and anxiety symptoms in the patients with MDD.MRI examinations was performed using a 3.0T MRI scanner (Signa Architect 3.0T, GE, USA) with a 48-channel head coil and the same scanning protocol. A coronal T2-weighted sequence was collected to exclude any intracranial lesions. Sagittal 3D T1-weighted MP-RAGE (Magnetization Prepared Rapid Gradient Echo) sequence with an isotropic resolution of 1.00 mm was scanned. Quantitative MRI parameters (T1 and T2 relaxation time) were acquired using the SyMRI technique, The SyMRI is based on a two-dimensional multiple-dynamic multiple-echo (MDME) pulse sequence which comprises four automatically calculated saturation delay times and two echo times. The main parameters were as follows: TR = 10,205.0ms, TE = 13.4 ms, flip angle = 20°, NEX = 1.00, thickness = 2 mm/no gap, ETL = 16, pixel size = 2.0 mm × 2.0 mm.
After MR scanning, the T1 and T2 quantitative maps were estimated from the SyMRI data using the postprocessing software SyntheticMR (v11.2.2, SyntheticMR AB, Sweden). To obtain the brain regional level T1 and T2 values, the T1 MP-RAGE image was first co-registered to the T1 map. Then, the co-registered T1 images were normalized to Montreal Neurological Institute (MNI) space using the Advanced Normalization Tools (ANTs). After that, all the T1 and T2 images were transformed into MNI space. Finally, the AAL atlas was applied to all the normalized images to extract the mean T1 and T2 values of all 90 gray matter regions.
SPSS (v26.0, IBM Corporation, Armonk, New York) was used for statistical analysis. The Shapiro-Wilk test assessed the normality of the data. Independent samples t-tests and nonparametric tests were used to compare quantitative variables, while the Chi-square test was used to compare qualitative variables. In the MDD group, Pearson and Spearman correlation analyses were performed for quantitative variables of significantly altered brain regions and clinical scales. P-value <0.05 was considered statistically significant. The errors in multiple comparisons were controlled by the false discovery rate (FDR).
Results
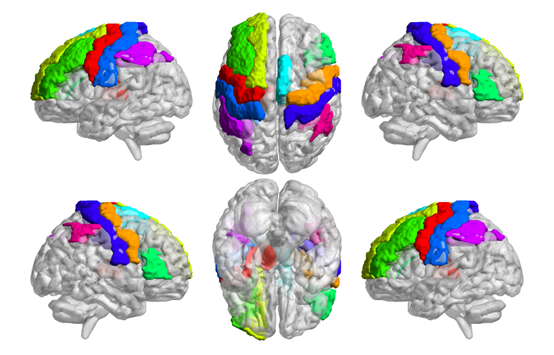
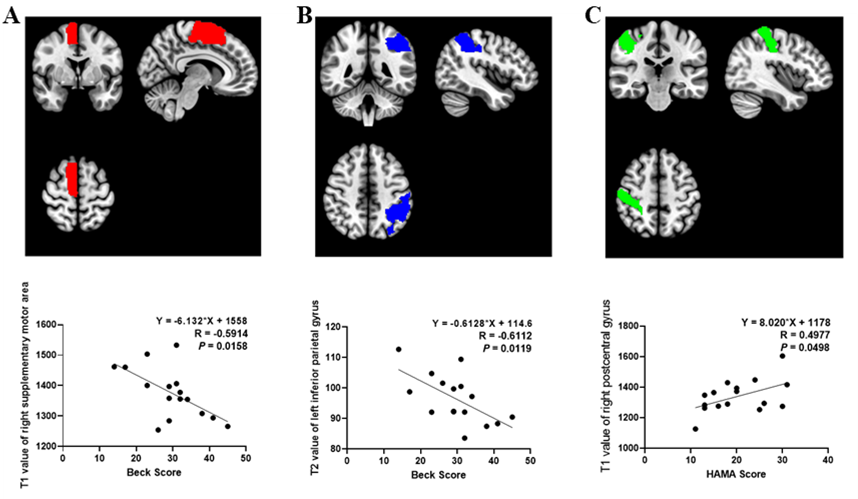
T1 and T2 values of multiple brain gray matter areas were shorter in MDD patients than in HCs (all P<0.05) (Table 2 and Fig. 1). Among the significantly altered brain regions, Beck scores of MDD patients were negatively correlated with the T1 values of the right supplementary motor area (R = -0.5914, P = 0.0158, Fig. 2A) and T2 values of the left inferior parietal gyrus (R = - 0.6112, P = 0.0119, Fig. 2B). Moreover, T1 values of the right postcentral gyrus were positively correlated with HAMA scores in patients with MDD (R = 0.4977, P = 0.0498, Fig. 2C).Discussion
In this study, widespread brain regions with shorter T1 or T2 relaxation time were observed in MDD patients. One major factor of these results could be the excessive iron deposition. Previous study5 using Quantitative Susceptibility Mapping (QSM) found that MDD can lead to the iron overloaded in thalamus where low T1 mapping values were also found in the present. Besides, the study also found the positive correlations between susceptibility values and the severity of depression5, which may support the hypothesis that the decrease of T1 and T2 in MDD may be related to iron deposition, as our results showed that Beck scores of MDD patients was negatively correlated with the T1 values and T2 values (Fig. 2). Moreover, brain regions showing lower T1 relaxation time were found in frontal lobe, which is the key area related to depression. It indicated that the quantitative MRI parameters can be used to reveal the microstructure abnormalities in MDD patients.Conclusion
We believe the reported findings can provide further insight into the pathophysiology and clinical symptoms of MDD, thus leading to a more precise and quantitative analysis of this condition.Acknowledgements
This study was supported by the National Natural Science Foundation of China grant 82172012.References
1. Cuijpers P, Stringaris A, Wolpert M. Treatment outcomes for depression: challenges and opportunities. Lancet Psychiatry. 2020;7(11):925–927.
2. Edwards LJ, Kirilina E, Mohammadi S, Weiskopf N. Microstructural imaging of human neocortex in vivo. Neuroimage. 2018;182184–206.
3. Warntjes JBM, Leinhard OD, West J, Lundberg P. Rapid magnetic resonance quantification on the brain: Optimization for clinical usage. Magn Reson Med. 2008;60(2):320–329.
4. Andica C, Hagiwara A, Hori M, et al. Review of synthetic MRI in pediatric brains: Basic principle of MR quantification, its features, clinical applications, and limitations. J Neuroradiology. 2019;46(4):268–275.
5. Yao S, Zhong Y, Xu Y, et al. Quantitative Susceptibility Mapping Reveals an Association between Brain Iron Load and Depression Severity. Front Hum Neurosci. 2017;11442.
Figures