4925
Association between myosteatosis and impaired glucose metabolism: A deep learning whole-body MRI population phenotyping approach1Department of Diagnostic and Interventional Radiology, University Medical Center Freiburg, Freiburg, Germany, 2Medical Physics, Department of Diagnostic and Interventional Radiology, University Medical Center Freiburg, Freiburg, Germany, 3Institute of Epidemiology, Helmholtz Zentrum München, Neuherberg, Germany, 4Institute for Medical Information Processing, Biometry and Epidemiology, Ludwig-Maximilians-University München, München, Germany
Synopsis
Keywords: Screening, Diabetes
Diabetes remains a major challenge for healthcare systems, making screening and early detection desirable. We used deep learning to quantify myosteatosis as 1) skeletal muscle fat fraction (SMFF) and 2) intramuscular adipose tissue (IMAT) normalized for SM mass and assessed their association with impaired glucose metabolism. SMFF had a higher discriminatory capacity for impaired glucose metabolism than IMAT. In multivariable logistic regression adjusted for baseline demographics and cardiometabolic risk factors, only SMFF remained an independent predictor of impaired glucose metabolism. Deep learning-based MR phenotyping enables opportunistic screening of myosteatosis and may identify individuals at high risk for impaired glucose metabolism.Background and Purpose:
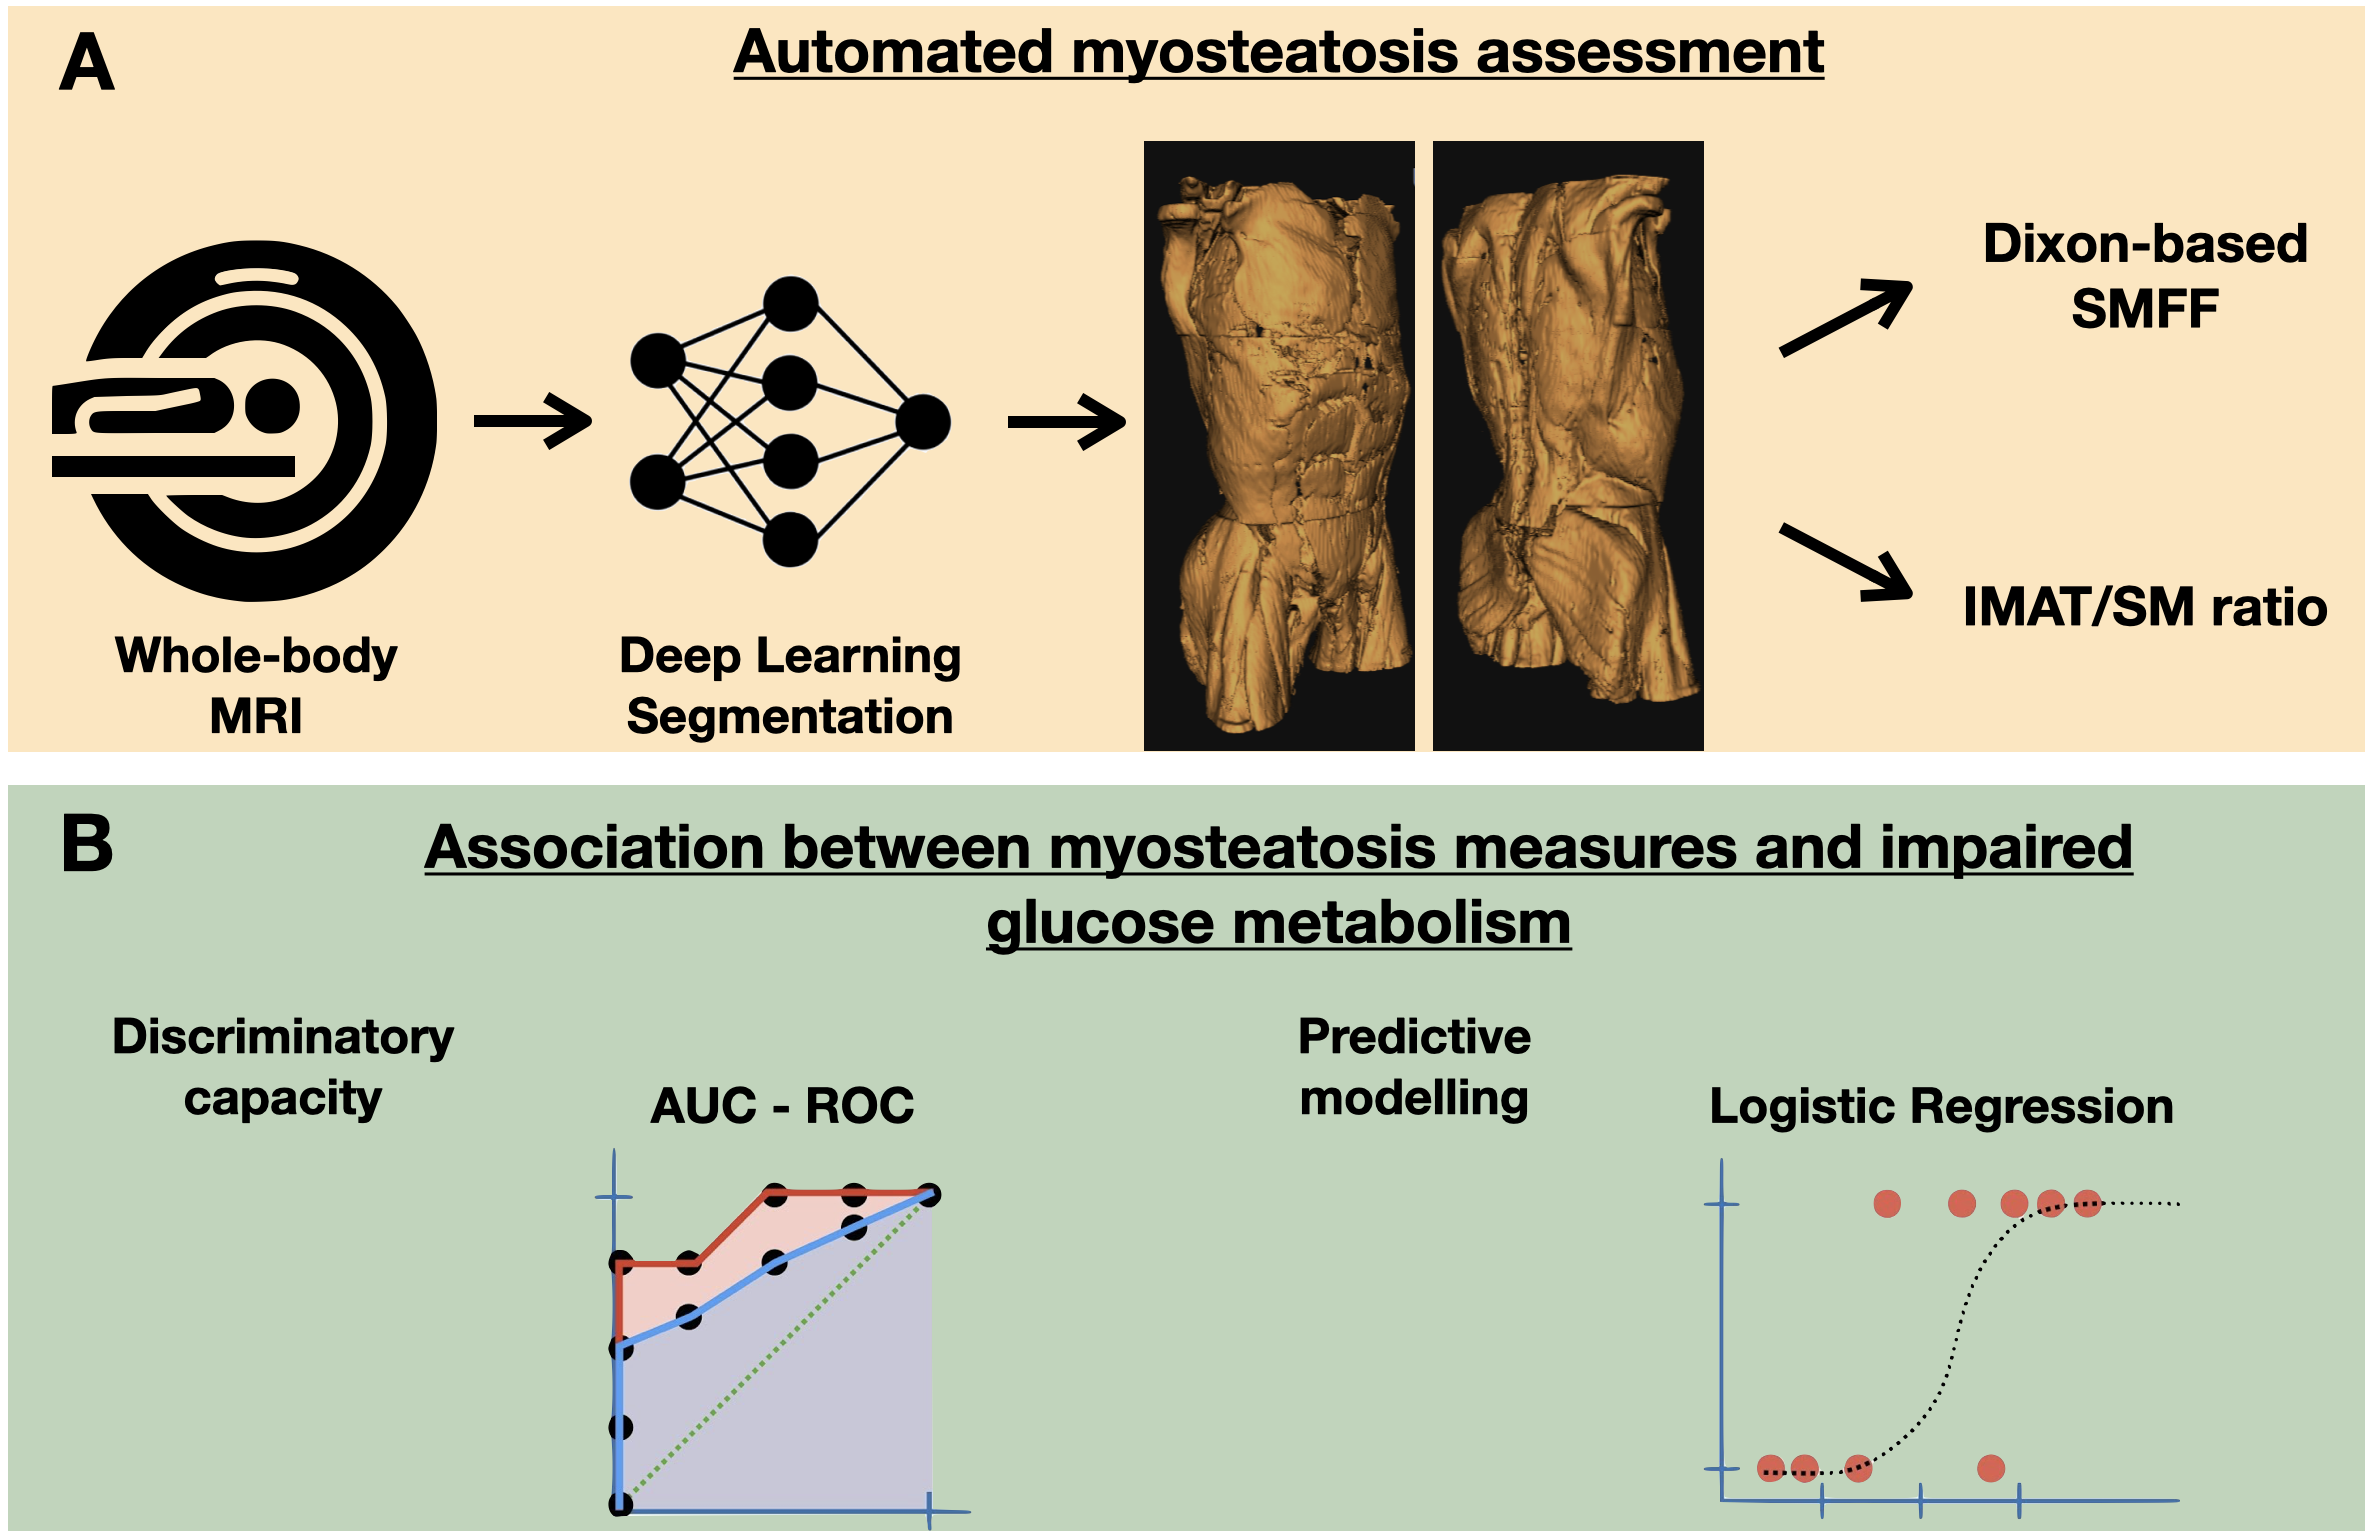
The prevalence of type 2 diabetes is increasing worldwide and poses a major impact on public health and healthcare systems. There is increasing evidence that body composition measures play an important role in risk assessment in individuals with impaired glucose metabolism. Skeletal muscle (SM) fatty infiltration (i.e. myosteatosis) is associated with muscle deterioration 1, represents a unique ectopic adipose tissue depot, and is an important target organ of insulin. Changes in intramuscular adipose tissue (IMAT) content may be associated with impaired glucose metabolism and progression of insulin resistance 2,3. Compared to traditional, region-of-interest (ROI)-based segmentation of macroscopically visible IMAT, chemical shift encoding-based water-fat magnetic resonance imaging (MRI) allows quantitative measurements of the biochemical water-fat composition of SM, i.e. skeletal muscle fat fraction (SMFF), which might provide more accurate and quantitative estimates of myosteatosis 4,5. Usually, imaging-based body composition is quantified manually on a single slice in cross-sectional studies, given their strong correlation with whole-body volumes. With advances in artificial intelligence, automated and more accurate 3D segmentation approaches have become feasible. Here, we used a fully automated 3D deep learning model to estimate myosteatosis as (i) IMAT normalized for total muscle mass and (ii) the quantitative SMFF of whole-body MRI using data form a community-dwelling cohort of individuals with prediabetes, diabetes and normal controls. The aim of this study was to investigate the association between myosteatosis and impaired glucose metabolism adjusted for traditional cardiometabolic risk factors.Methods:
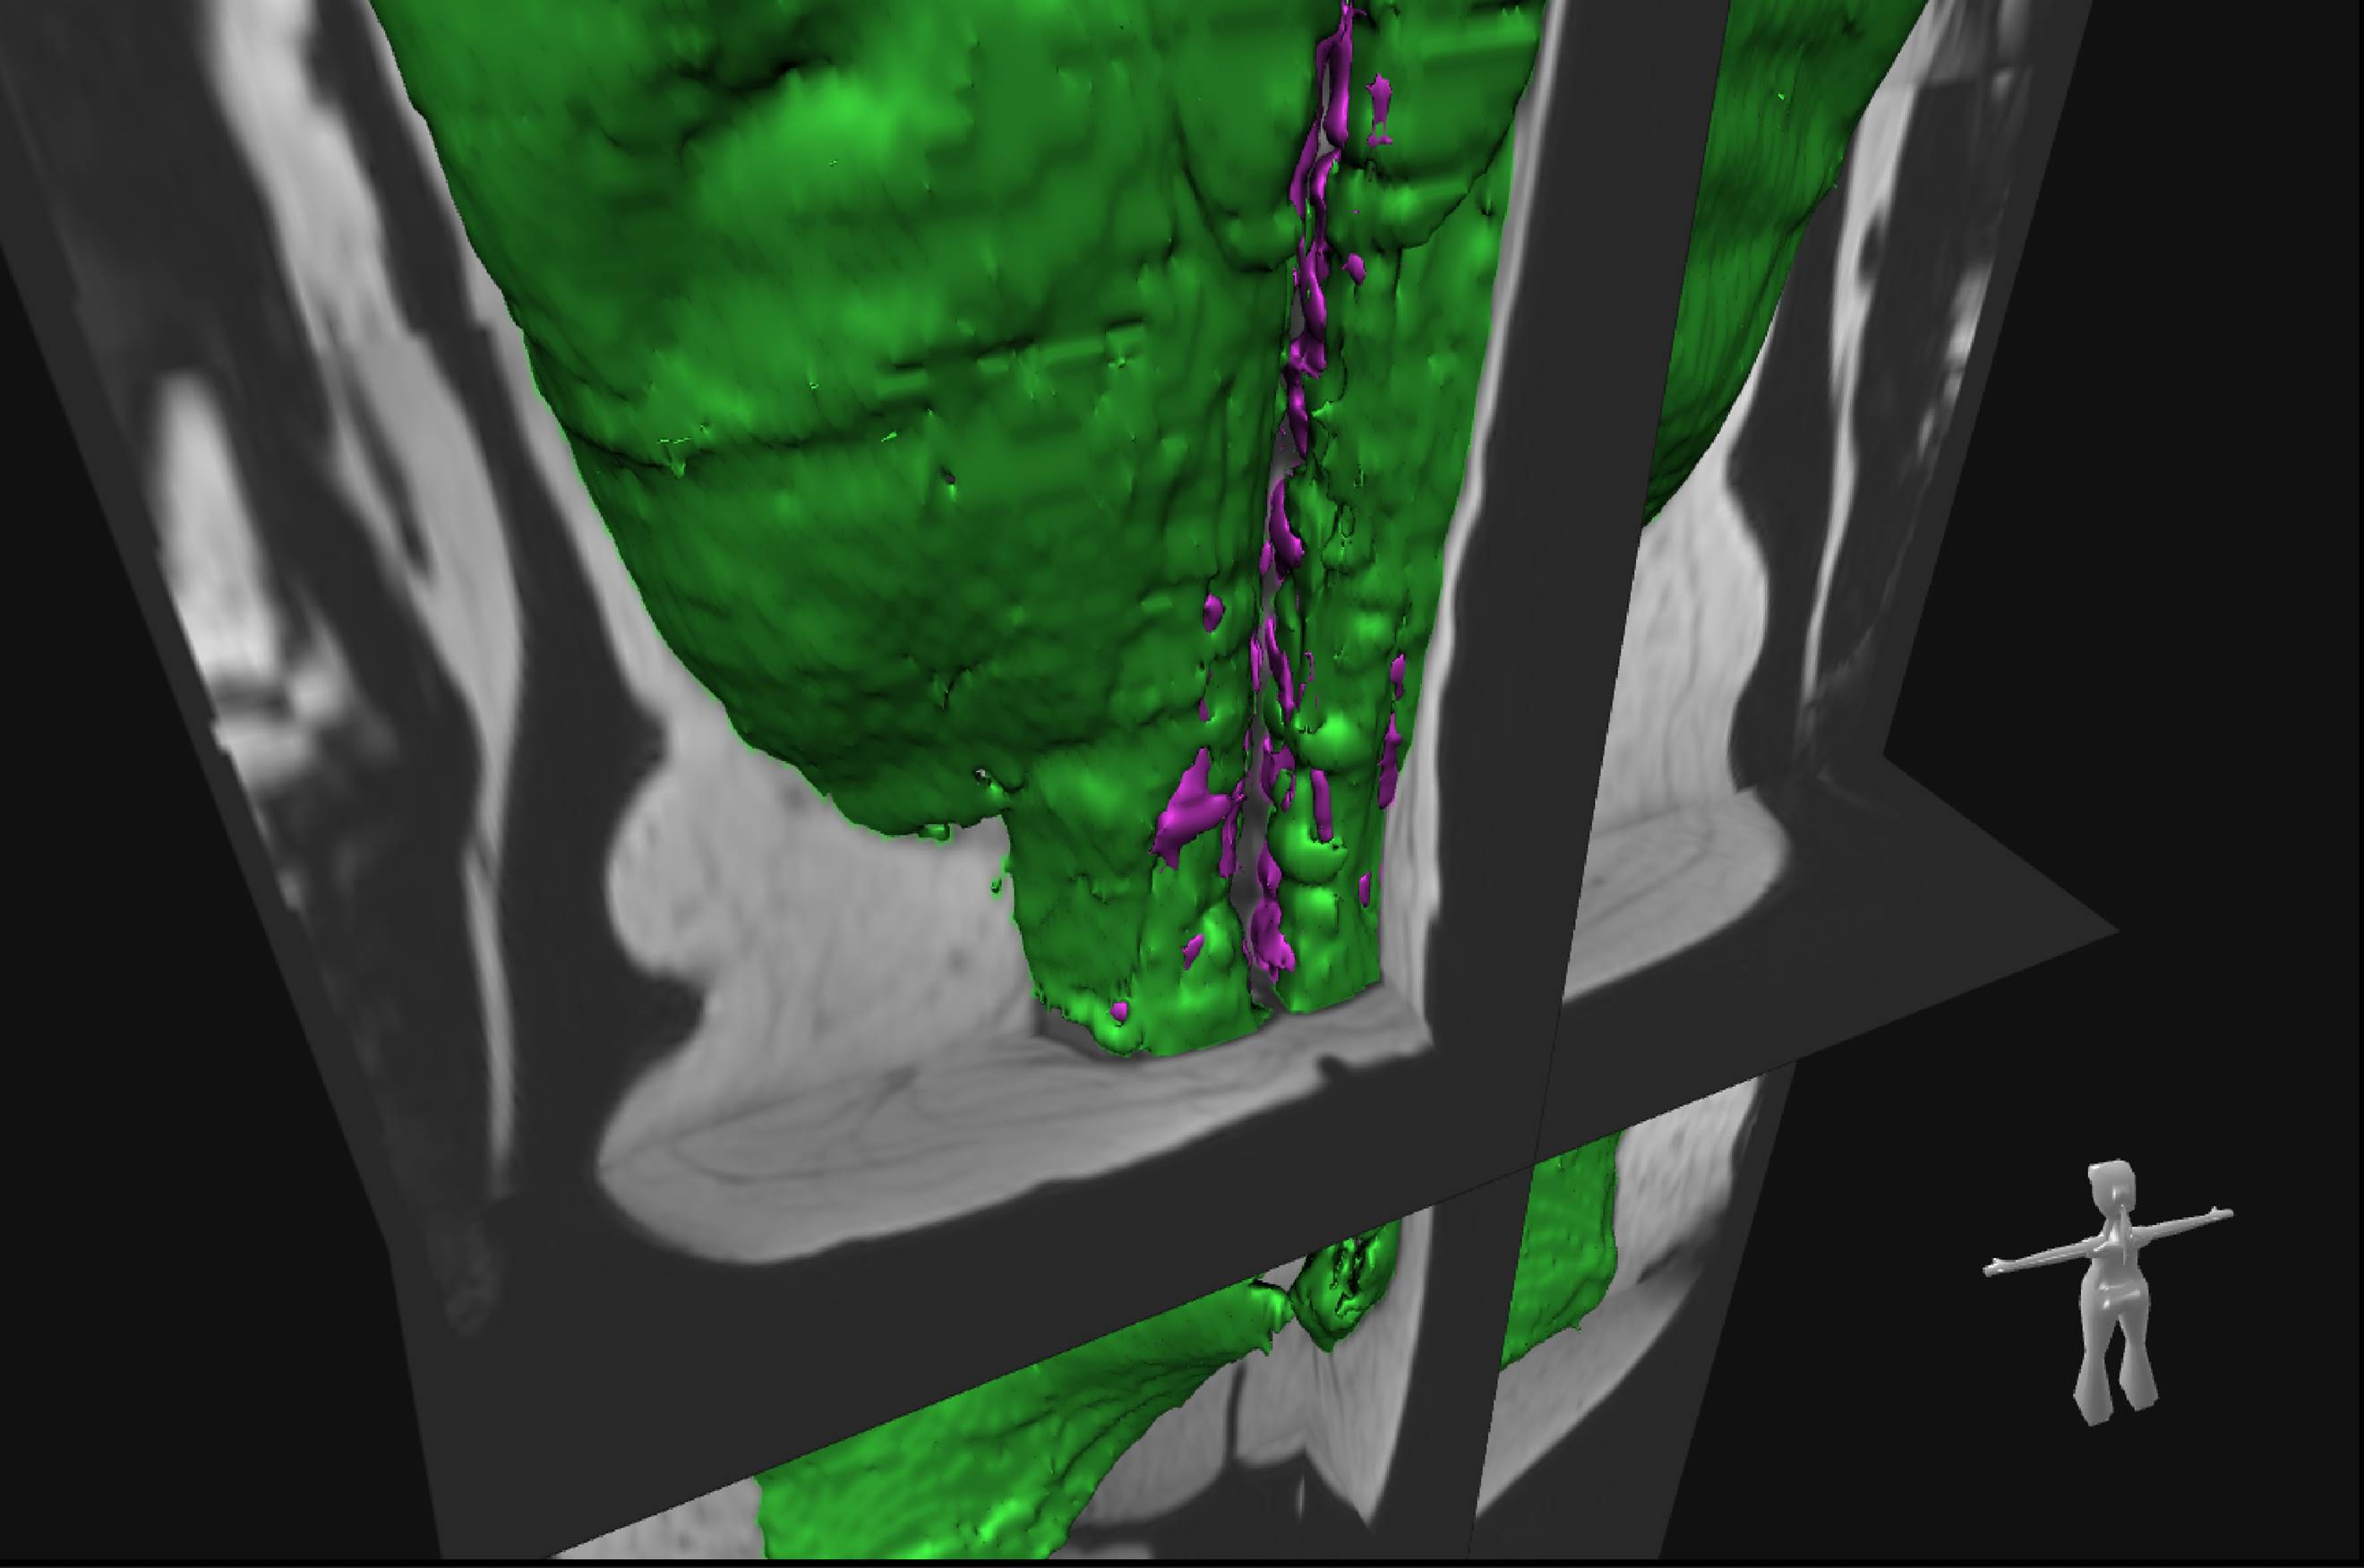
Study cohort and imaging protocol: The study was designed as a retrospective cross-sectional analysis based on a prospective cohort of the “Cooperative Health Research in the Region of Augsburg” (KORA) 6. Whole-body MRI examinations were performed in a supine position on a 3 Tesla Magnetom Skyra (Siemens Healthineers) using an 18-channel body surface coil. A dual-echo Dixon VIBE sequence (slice thickness 1.7 mm, voxel size 1.7 x 1.7 mm, field of view 488 x 716 mm, matrix 256 x 256, TR 4.06 ms, TEs 1.26 and 2.49 ms, flip angle 9°) for chemical shift encoding-based water-fat imaging was acquired coronally.Quantification of myostestosis: We used a fully automated hierarchical patch-based stack of convolutional neural networks (CNN) 7 to volumetrically quantify skeletal muscle (SM) and autochthonous intramuscular adipose tissue (IMAT) in litres on whole-body MRI (Figure 1). To capture myosteatosis normalized for individual muscle mass, we (i) generated a summary measure (IMAT divided by SM; %) and (ii) extracted the Dixon-based quantitative SM fat fraction (SMFF; %).
$$SMFF=\frac{mean\ intensity\ fat\ image}{mean\ intensity\ fat\ image+mean\ intensity\ water\ image}$$
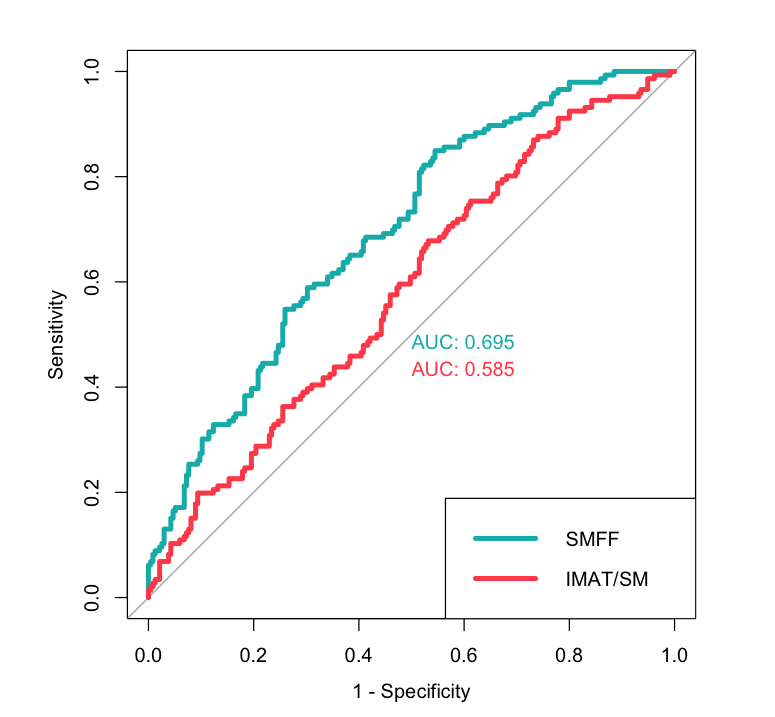
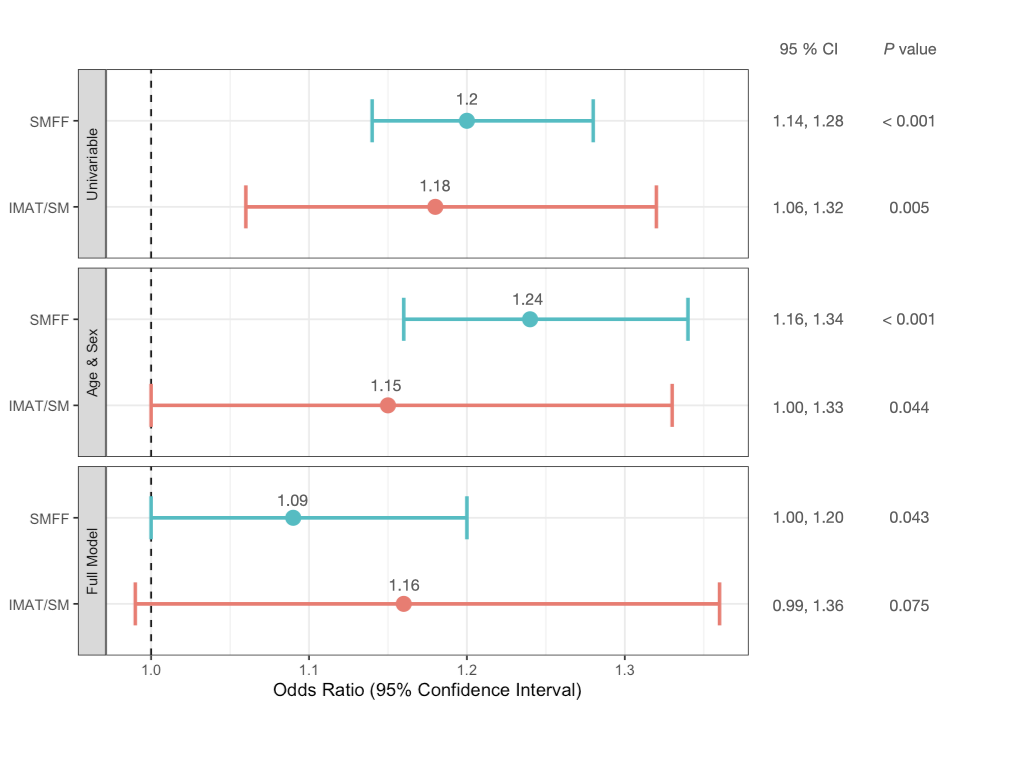
Diabetes mellitus and statistical analysis: All participants underwent a comprehensive health assessment at the study center with standardized interviews and physical examinations to determine the main characteristics and demographics, as well as the main cardiometabolic risk factors. Impaired glucose metabolism was defined as impaired fasting glucose or impaired glucose tolerance (5,6 - 6,9 mmol/l) or prevalent diabetes mellitus as defined by the WHO. The discriminatory capacity for impaired glucose metabolism based on myosteatosis measures was assessed by calculating the area under the ROC curves (AUC). The association between myosteatosis and impaired glucose metabolism was evaluated using univariable and multivariable logistic regression analysis (Figure 2).
Results:
The final study cohort comprised 381 participants (162 women and 219 men) with a mean age of 56.3 ± 9.2 years and a mean BMI of 28.2 ± 4.9 kg/m2. Individuals with impaired glucose metabolism 146 (38.3%) were older, more likely men, showed a higher BMI, triglycerides, and systemic blood pressure and lower HDL levels (all p < 0.001). SMFF was significantly higher in individuals with impaired glucose metabolism (19.8 ± 4.2%) compared to those without impaired glucose metabolism (16.9 ± 3.7%; p < 0.001). A similar pattern was observed for IMAT/SM (4.4 ± 2.0% vs. 3.8 ± 1.7%; p = 0.005). Quantitative SMFF had better discrimination for impaired glucose metabolism than the IMAT/SM ratio (AUC 0.695 vs. 0.585; p < 0.001; Figure 3). In univariable logistic regression analysis, SMFF (OR = 1.2; 1.14, 1.28; p < 0.001) and IMAT/SM (OR = 1.18; CI 1.06, 1.32; p = 0.004; Figure 4) were associated with a higher risk of impaired glucose metabolism. This signal remained robust in multivariable logistic regression analysis adjusted for age and sex for both SMFF (OR = 1.24; CI 1.16, 1.34; p < 0.001) and IMAT/SM (OR = 1.15; CI 1.00, 1.33; p = 0.044). However, after further adjustment for baseline demographics and cardiometabolic risk factors (age, sex, BMI, lipid panel, systolic blood pressure, smoking status, alcohol consumption), this association remained robust only for SMFF (OR = 1.09; CI 1.00, 1.20; p = 0.043) but not for IMAT/SM (OR = 1.16; CI 0.99, 1.36; p = 0.075).Conclusion and Clinical Relevance:
Quantitative SMFF is a predictor of impaired glucose metabolism independent of cardiovascular risk factors and is a promising alternative for the evaluation of myosteatosis compared to the elaborate extraction of macroscopically visible IMAT. Automated deep learning-based whole-body MR population phenotyping enables opportunistic screening of altered muscle status and may help to identify individuals at high risk for impaired glucose metabolism. Implementation of such methods may provide a fast and low-cost solution to inform risk assessment and improve population health.Acknowledgements
MJ was supported by the Berta-Ottenstein-Programme for Clinician Scientists, Faculty of Medicine, University of Freiburg.References
1. Hamrick MW, McGee-Lawrence ME, Frechette DM. Fatty Infiltration of Skeletal Muscle: Mechanisms and Comparisons with Bone Marrow Adiposity. Front Endocrinol (Lausanne). 2016;7:69.
2. Merz KE, Thurmond DC. Role of Skeletal Muscle in Insulin Resistance and Glucose Uptake. Compr Physiol. 2020;10(3):785-809.
3. Boettcher M, Machann J, Stefan N, et al. Intermuscular adipose tissue (IMAT): association with other adipose tissue compartments and insulin sensitivity. J Magn Reson Imaging. 2009;29(6):1340-1345.
4. Kiefer LS, Fabian J, Lorbeer R, et al. Inter- and intra-observer variability of an anatomical landmark-based, manual segmentation method by MRI for the assessment of skeletal muscle fat content and area in subjects from the general population. Br J Radiol. 2018;91(1089):20180019.
5. Karampinos DC, Yu H, Shimakawa A, Link TM, Majumdar S. T(1)-corrected fat quantification using chemical shift-based water/fat separation: application to skeletal muscle. Magn Reson Med. 2011;66(5):1312-1326.
6. Bamberg F, Hetterich H, Rospleszcz S, et al. Subclinical Disease Burden as Assessed by Whole-Body MRI in Subjects With Prediabetes, Subjects With Diabetes, and Normal Control Subjects From the General Population: The KORA-MRI Study. Diabetes. 2017;66(1):158-169.
7. Reisert M, Russe M, Elsheikh S, Kellner E, Skibbe H. Deep Neural Patchworks: Coping with Large Segmentation Tasks. 2022:arXiv:2206.03210. https://ui.adsabs.harvard.edu/abs/2022arXiv220603210R. Accessed June 01, 2022.
Figures