4922
Predicting Double Expression Status in Primary Central Nervous System Lymphoma Using Multiparametric MRI Based Machine Learning1Department of Radiology, The First Medical Center, Chinese PLA General Hospital, Beijing, China
Synopsis
Keywords: Machine Learning/Artificial Intelligence, Multimodal
In this study, we proposed a promising method to distinguish the double expression lymphoma (DEL) from the non-double expression lymphoma (non-DEL) in primary central nervous system lymphoma (PCNSL) by using multiparametric MRI-based machine learning. The results showed that clinical characteristics and MR imaging features had no significant differences in distinguishing DEL from non-DEL . However, radiomics features could differentiate the two status and the best model in this study was SVMlinear with the combined four sequence group (AUCmean = 0.89±0.04). So multiparametric MRI based machine learning is promising in predicting DEL status in PCNSL.Introduction
Primary central nervous system lymphoma (PCNSL), a rare form of non-Hodgkin lymphoma (NHL), involves the brain, spinal cord, meninges, or vitreoretinal space without evidence of systemic involvement1. The majority of subtypes in PCNSL are diffuse large B-cell lymphoma (DLBCL) (> 90%)2. According to the World Health Organization (WHO) classification of tumors of hematopoietic and lymphoid tissues, nearly 30% of all DLBCL cases have both overexpressed B-cell lymphoma-2 (BCL-2) and MYC proteins, thereby referred to as double-expression lymphomas (DEL) 3.In PCNSL patients, DEL status affects the sensitivity to chemotherapeutic agents, prognosis, and risk scores4–6. Partial or total tumor resection is unnecessary since high-dose methotrexate-based chemotherapy is the primary therapeutic regimen for PCNSL3, 6, 7. So, the pathologic diagnosis is primarily based on fine-needle aspiration, but biopsies are invasive and at the risk of undersampling, which may cause diagnostic failure in molecular expression. Therefore, non-invasive detection of molecular subtypes is essential in predicting the DEL status in PCNSL. In this study, we proposed a non-invasive method to distinguish DEL from non-DEL in immunocompetent PCNSL based on multiparametric MRI radiomics features.
Method
Forty pathologically confirmed PCNSL patients (17 of DEL and 23 of non-DEL) with 59 lesions (28 of DEL and 31 of non-DEL) were enrolled in the study. Multiparametric MRI data were obtained on a 3T MRI system (Discovery 750, GE Healthcare, Milwaukee, WI) including ADC and DWI(TR/TE=3000/65.5 ms, FOV = 24 × 24 cm,b=0/1000 s/mm2, matrix = 160 × 160, NEX = 2.00), T2WI (TR/TE = 5642/93 ms, FOV =24 × 24 cm, matrix = 512 × 512, NEX = 1.50), T2 FLAIR(TR/TE/TI =8527/162/2100 ms, FOV = 24 × 24 cm, matrix = 288 × 224, NEX = 1.00) and contrast-enhanced T1WI (T1CE, TR/TE/TI =1743/27/760 ms, FOV = 24 × 24 cm, matrix = 320 × 224, NEX = 1.00) were acquired. The lesions were segmented using ITK-SNAP, and a total of 2234 radiomics features from the tumor segmentation area were extracted by using PyRadiomics customized from Python. A T-test was conducted to filter the features, and Elastic Net Regression Algorithm (ENR) combined with Recursive Feature Elimination (RFE) was carried out to calculate the essential features. Finally, 12 groups with combinations of different sequences were fitted to 6 classifiers, and the optimal models were selected.The pipeline for DEL expression prediction was depicted in Figure 1.Result
Forty patients were enrolled in this study. There were 17 DEL (9 men and 8 females; mean 61.29 years) and 23 non-DEL (14 men and 9 females; mean 55.57 years). There were no significant differences between DEL and non-DEL in clinical characteristics (Table 1) or MR imaging features (Table 2).After feature selection, the remaining features (sequence, feature filter, feature type, and feature name) for each sequence group were as follows: ADC (nfeature=3), T2WI (nfeature=2), T2FLAIR (nfeature=2), T1CE (nfeature=2), ADC+T2WI (nfeature=4), ADC+T1CE (nfeature=5), T2WI+T2FLAIR (nfeature=4), T2WI+T1CE (nfeature=4), T2FLAIR+T1CE (nfeature=4), ADC+T2WI+T1CE (nfeature=4), ADC+T2FLAIR+T1CE (nfeature=4), and ADC+T2WI+T2FLAIR+T1CE (nfeature=7).
Among the single sequence groups, the best performance was the ADC group with the sensitivity, specificity, accuracy, F1, and AUCmean of 0.79, 0.84, 0.80, 0.79, and 0.81±0.12 in SVMlinear model, and of 0.79, 0.90, 0.82, 0.85, and 0.81±0.12 in KNN model, respectively (Table 3). Among all the combined sequence groups, the best performance was the four sequence groups (ADC+T2WI+T2FLAIR+T1CE) with the sensitivity, specificity, accuracy, F1, and AUCmean of 0.86, 0.94, 0.83, 0.85, and 0.89 ± 0.04, respectively, in SVMlinear model (Table 3, Figure 2).
Discussion
In this study, we identified the DEL status by using multiparametric MRI-based machine learning through optimal model selection from 72 models (12 different sequence groups and 6 classifiers), thus achieving the non-invasive DEL detection, and providing useful information for therapeutic planning and prognostic assessment in PCNSL.Conventional multiparametric MR imaging can be applied to detecting molecular expression in PCNSL. Ozturk et al showed that rADCmean could be used to identify the BCL-2 and MYC rearrangements in PCNSL7, which may be ascribed to the complex molecular pathologies that lead to increased cell density and cell proliferation in the lesions.
Radiomics is a potential way for the diagnosis, classification, and assessment of disease outcomes based on high-throughput extraction and analysis of a large number of quantitative imaging features from medical images8–10. Up to now, radiomics studies mainly focused on the differential diagnosis between PCNSL and glioma11–13. In addition, Ali et al suggested that radiomics-based SVM models could accurately assess the therapeutic efficacy of high-dose Methotrexate to PCNSL 14. The ki-67 expression could be predicted using a DWI histogram in PCNSL 15, but the prediction of other molecular biomarkers needs more radiomics features, such as second-order features.
Conclusion
In this study, multiparametric MRI-based machine learning from ADC, T2WI, T2FLAIR, and T1CE, through 6 classifiers, had optimal performance in predicting DEL status, which can be a potential and promising tool in therapeutic planning and prognostic prediction in PCNSL.Acknowledgements
The authors would like to thank all the participants.References
1. Löw S, Han CH, Batchelor TT (2018) Primary central nervous system lymphoma. Ther Adv Neurol Disord 11:1-16.
2. von Baumgarten L, Illerhaus G, Korfel A, et al (2018) The Diagnosis and Treatment of Primary CNS Lymphoma. Dtsch Arztebl Int 115:419–426.
3. Bruneau J, Molina TJ (2020) WHO Classification of Tumors of Hematopoietic and Lymphoid Tissues.
4. Adams CM, Clark-Garvey S, Porcu P, Eischen CM (2019) Targeting the Bcl-2 family in B cell lymphoma. Front Oncol 8:636.
5. Han B, Kim S, Koh J, et al (2020) Immunophenotypic landscape and prognosis of diffuse large B-cell lymphoma with MYC/BCL2 double expression: An analysis of a prospectively immunoprofiled cohort. Cancers (Basel) 12:3305.
6. Klanova M, Klener P (2020) BCL-2 proteins in pathogenesis and therapy of B-Cell non-hodgkin lymphomas. Cancers (Basel) 12:938.
7. Ozturk K, Soylu E, Cayci Z (2021) Differentiation between primary CNS lymphoma and atypical glioblastoma according to major genomic alterations using diffusion and susceptibility-weighted MR imaging. Eur J Radiol 141:109784
8. Lambin P, Leijenaar RTH, Deist TM, et al (2017) Radiomics: The bridge between medical imaging and personalized medicine. Nat Rev Clin Oncol 14:749–762.
9. Mayerhoefer ME, Materka A, Langs G, et al (2020) Introduction to radiomics. Journal of Nuclear Medicine 61:488–495.
10. Kumar V, Gu Y, Basu S, et al (2012) Radiomics: the process and the challenges. Magn Reson Imaging 30:1234–1248.
11. Bathla G, Priya S, Liu Y, et al (2021) Radiomics-based differentiation between glioblastoma and primary central nervous system lymphoma: a comparison of diagnostic performance across different MRI sequences and machine learning techniques. Eur Radiol 31:8703–8713.
12. Xia W, Hu B, Li H, et al (2021) Deep Learning for Automatic Differential Diagnosis of Primary Central Nervous System Lymphoma and Glioblastoma: Multi-Parametric Magnetic Resonance Imaging Based Convolutional Neural Network Model. Journal of Magnetic Resonance Imaging 54:880–887.
13. Chen C, Zheng A, Ou X, et al (2020) Comparison of Radiomics-Based Machine-Learning Classifiers in Diagnosis of Glioblastoma From Primary Central Nervous System Lymphoma. Front Oncol 10:1151.
14. Ali OM, Nalawade SS, Xi Y, et al (2020) A Radiomic Machine Learning Model to Predict Treatment Response to Methotrexate and Survival Outcomes in Primary Central Nervous System Lymphoma (PCNSL). Blood 136:29–30.
15. Chong I, Ostrom Q, Khan B, et al (2019) Whole tumor histogram analysis using DW MRI in primary central nervous system lymphoma correlates with tumor biomarkers and outcome. Cancers (Basel) 11: 1506.
Figures
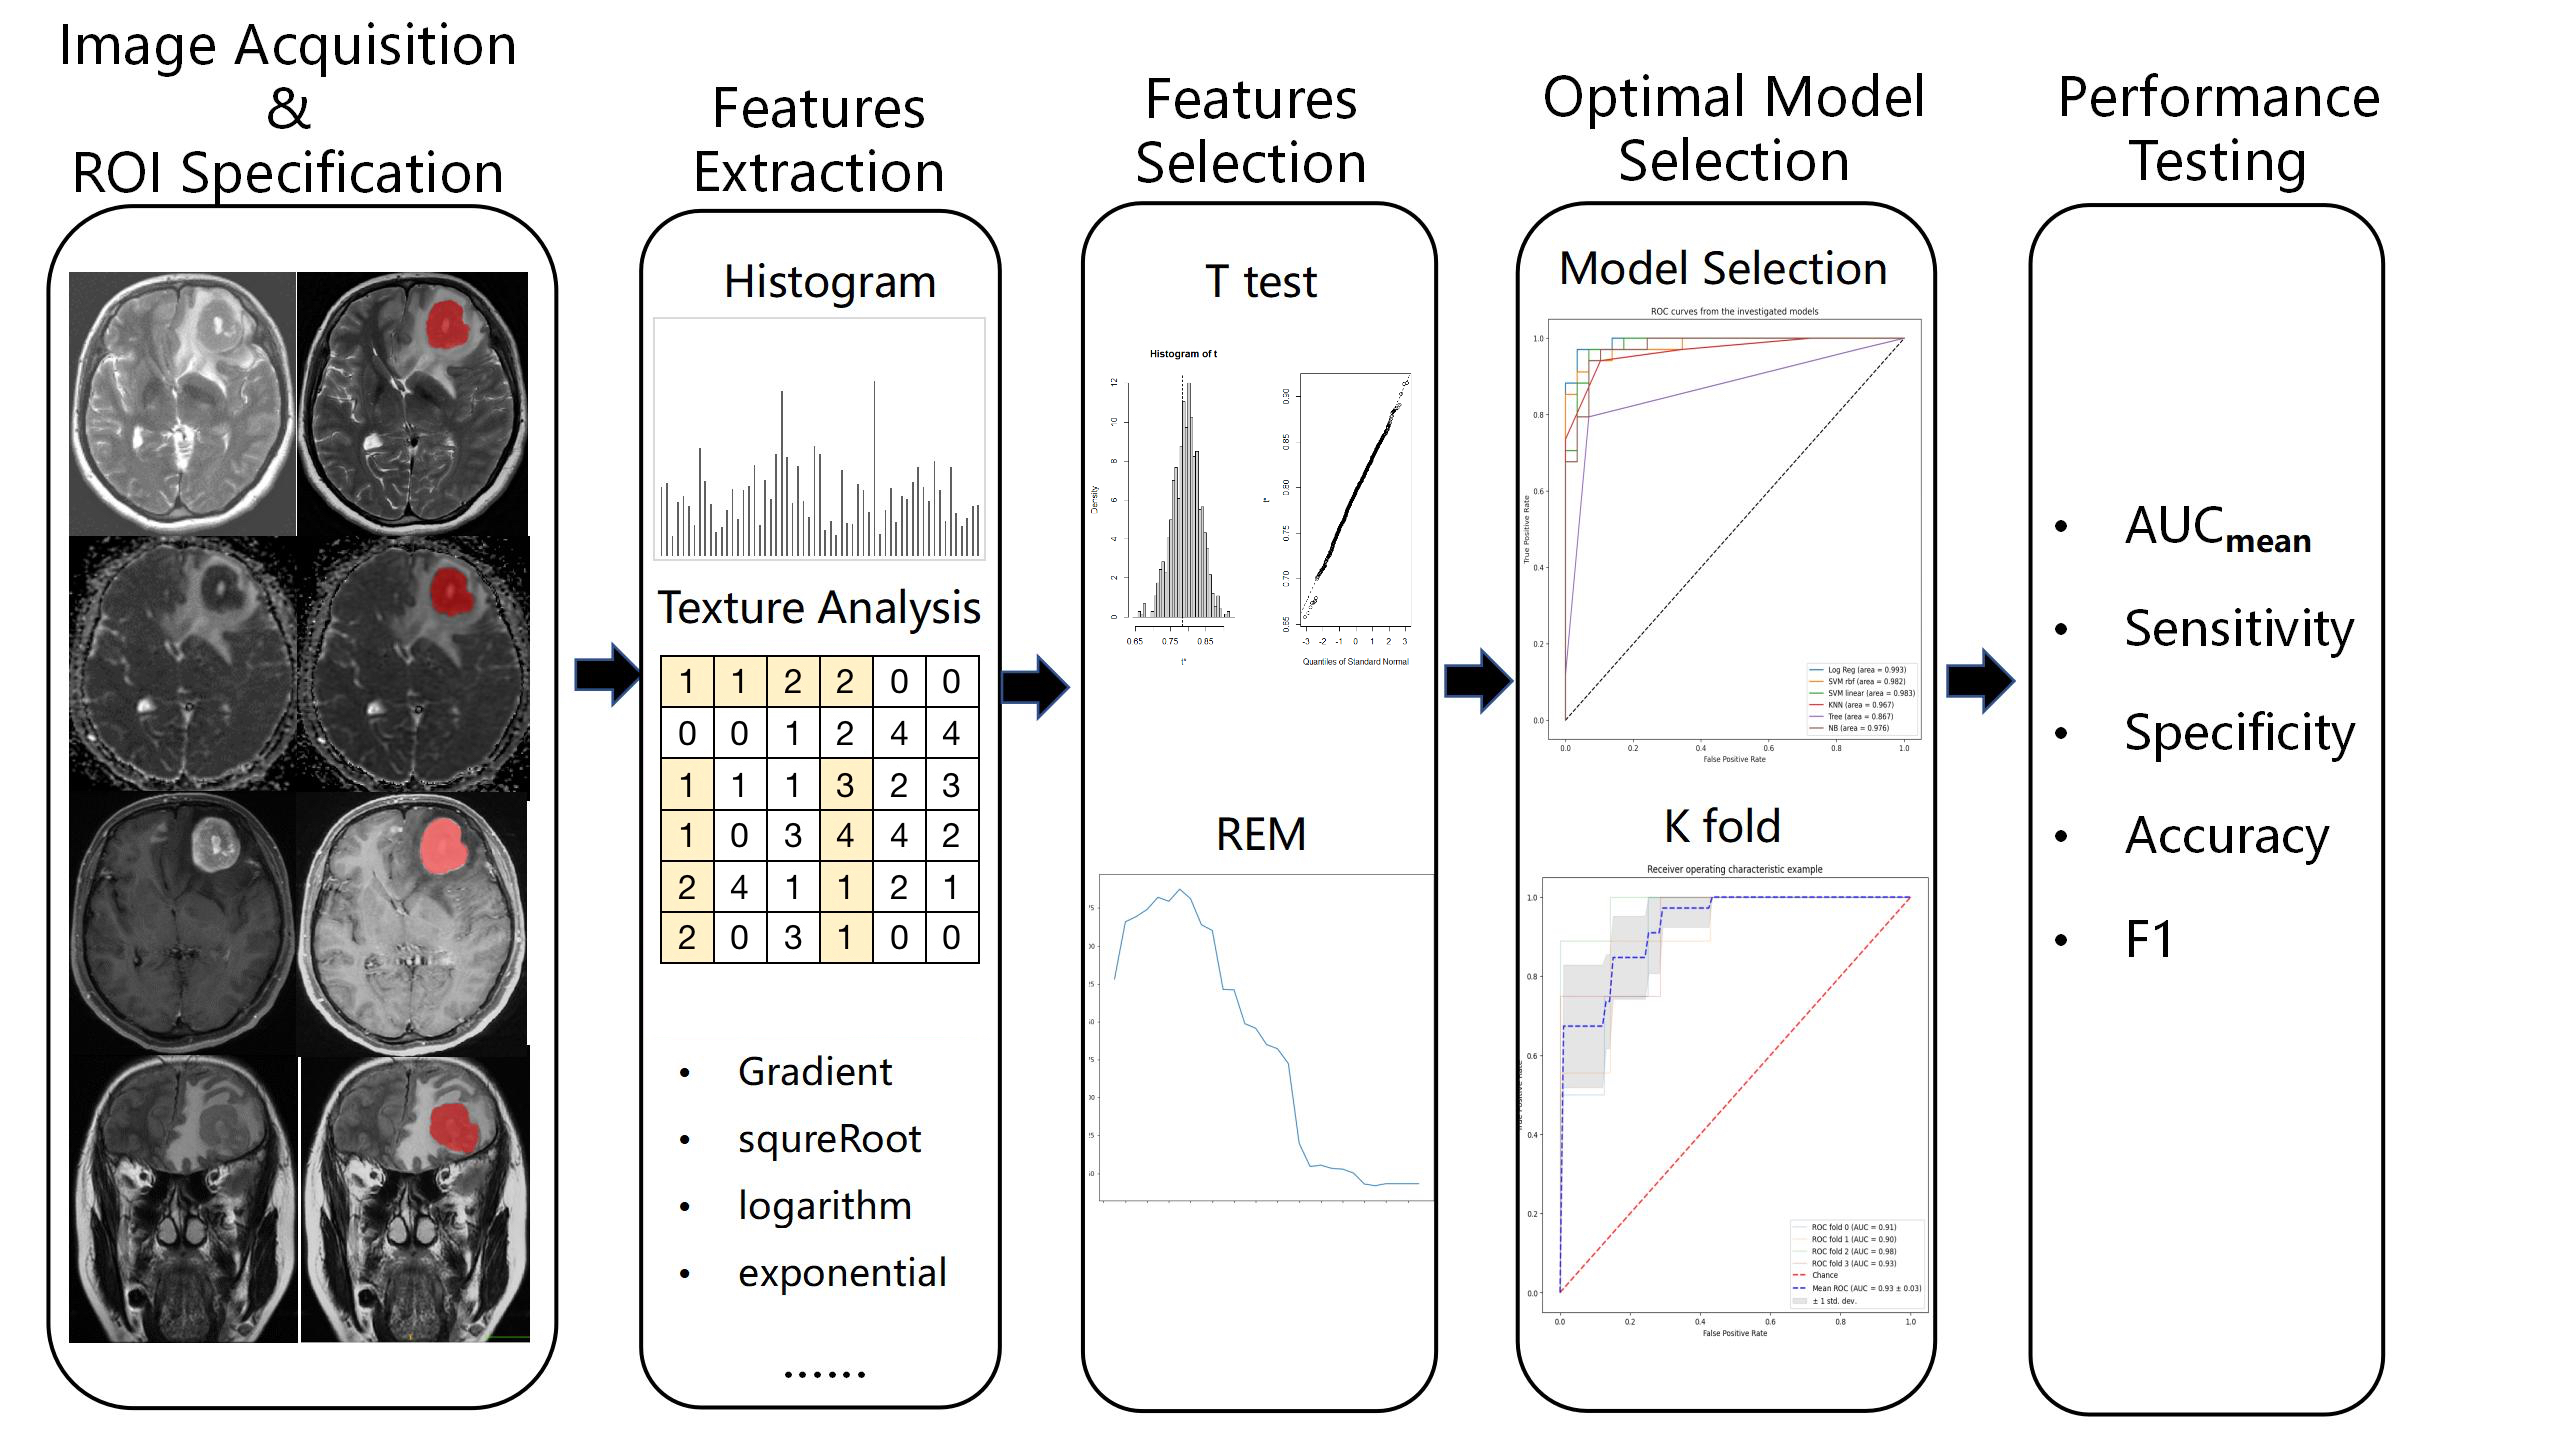
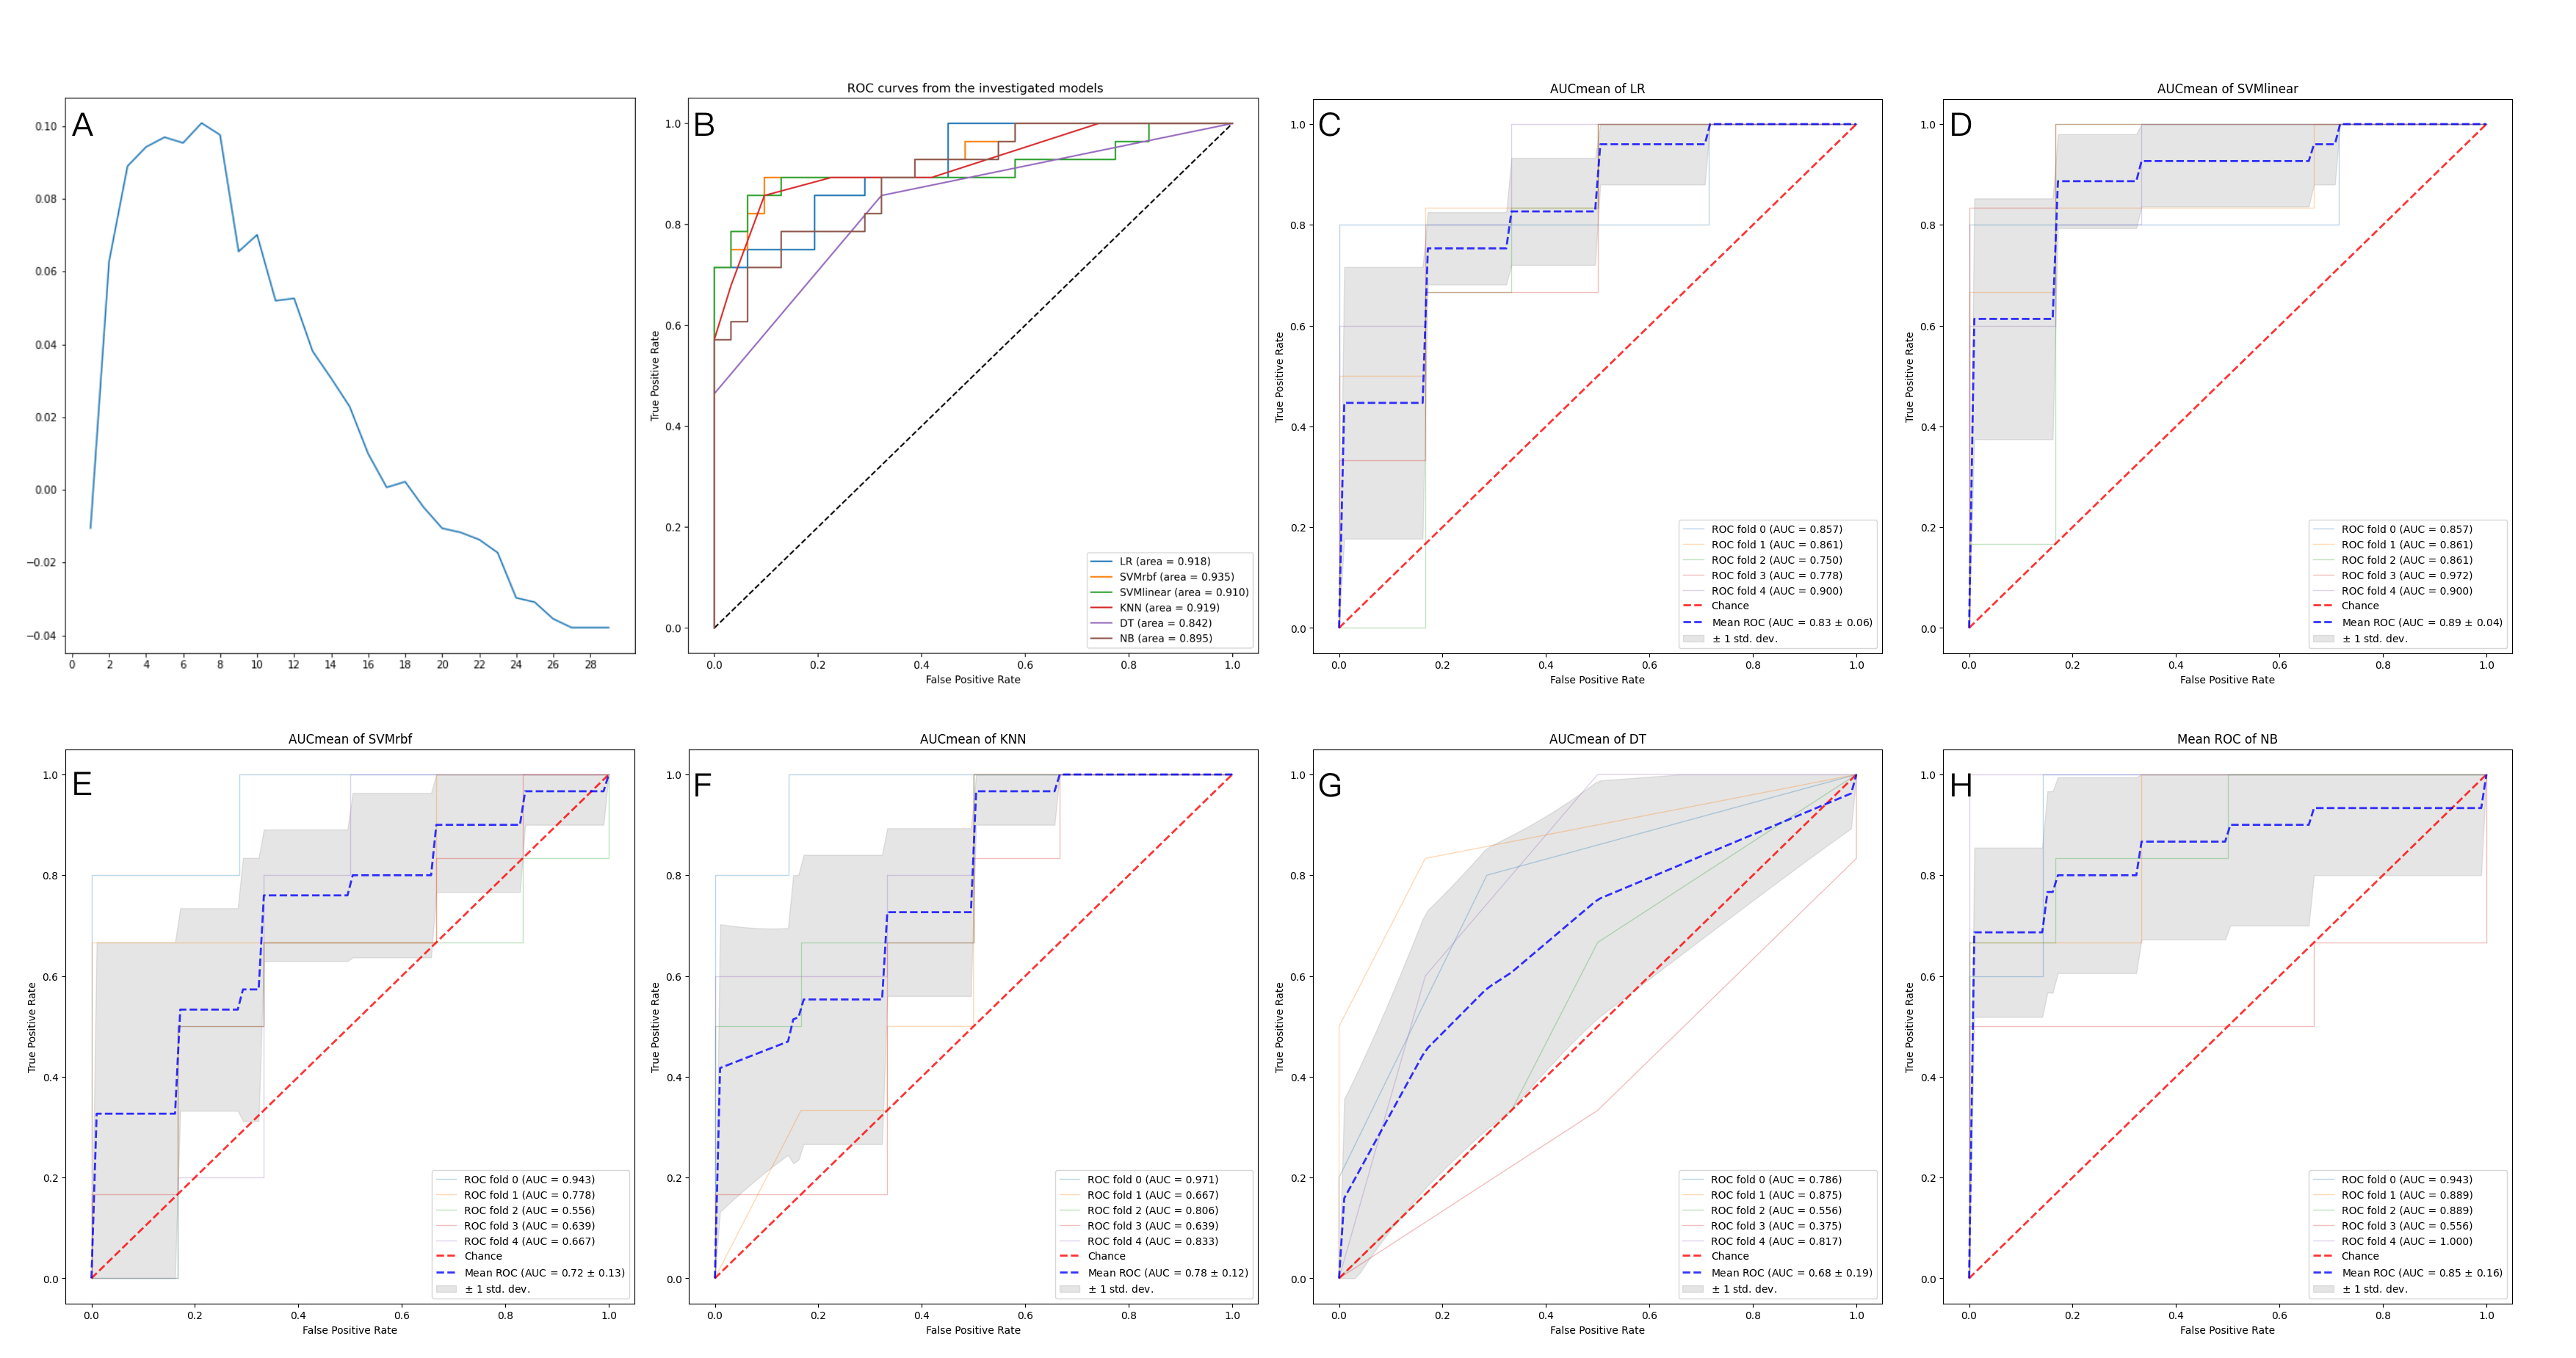
Figure 2. The optimal feature number and AUC of combined four sequence group. (A) The optimal feature number ;(B) AUC of the 6 classifiers;(C) AUC of LR by 5-fold test; (D) AUC of SVMrbf by 5-fold test (E) AUC of SVMlinear by 5-fold test (F) AUC of KNN by 5-fold test (G) AUC of DT by 5-fold test (H) AUC of NB by 5-fold test.
Abbreviations: AUC, area under curve; DT, decision tree; KNN, K-nearest neighbor; LR, logistic regression; NB, Naive bayes; SD, standard deviation; SVMlinear, linear kernel of support vector machine; SVMrbf, radial basis function kernel of support vector machine.
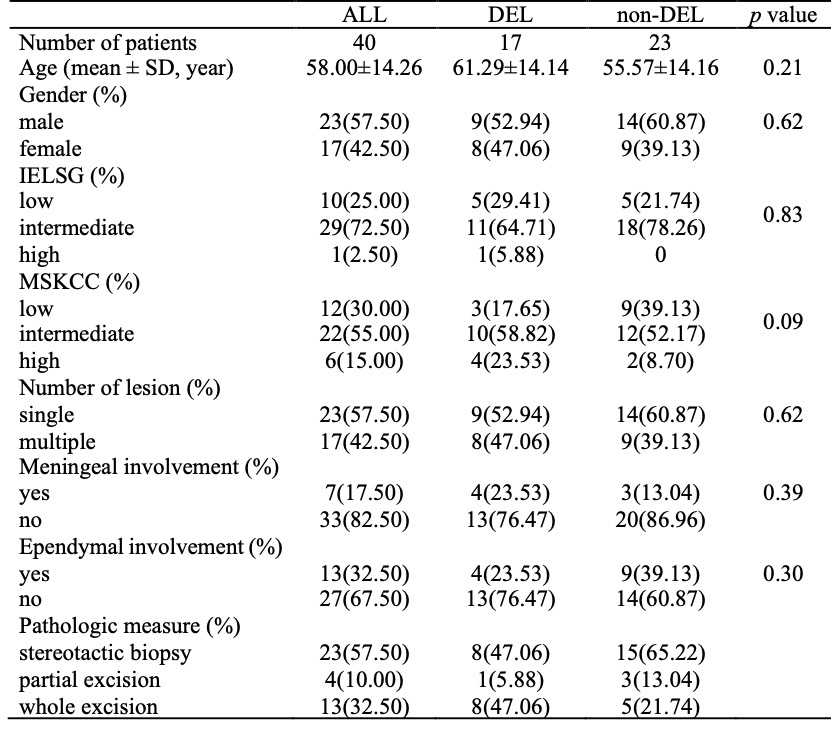
Table 1. Clinical data.
Note: Distribution of DEL status was reported as absolute counts (%). Age was reported as mean ± SD.Abbreviations: DEL, double-expression lymphoma; non-DEL, non-double expression lymphoma; IELSG, International Extranodal Lymphoma Study Group; MSKCC, Memorial Sloan-Kettering Cancer Center score for PCNSL outcome; SD, standard deviation.
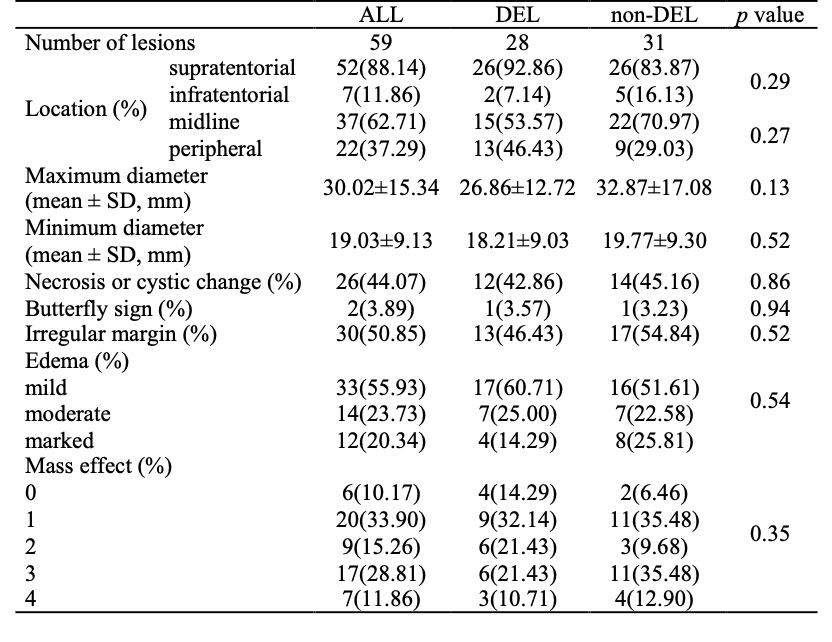
Table 2. MR imaging features of the lesions.
Note: Distribution of DEL status was reported as absolute counts (%). Maximum diameter and minimum diameter was reported as mean ± SD.Abbreviations: DEL, double-expression lymphoma; non-DEL, non-double expression lymphoma; SD, standard deviation.
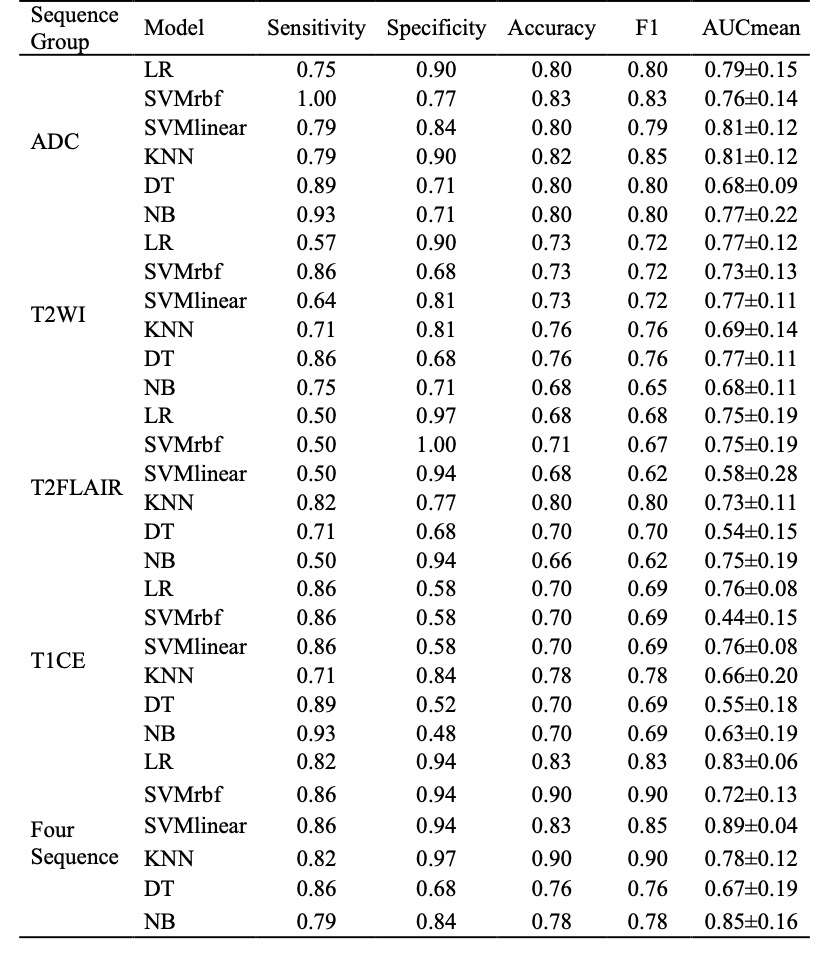
Table 3. Model performance of single sequence groups and combined four sequence group.
Note: AUCmean was reported as mean ± SD.Abbreviations: AUC, area under curve; DT, decision tree; KNN, K-nearest neighbor; LR, logistic regression; NB, Naive bayes; SD, standard deviation; SVMlinear, linear kernel of support vector machine; SVMrbf, radial basis function kernel of support vector machine.