4921
Image Quality and Quantitative Analysis of abbreviated IVIM Brain MRI With Deep Learning–Based Reconstruction1Xuanwu Hospital Capital Medical University, Beijing, China
Synopsis
Keywords: Machine Learning/Artificial Intelligence, Diffusion/other diffusion imaging techniques
Deep learning-based reconstruction may improve the image signal to noise ratio without impacting the image contrasts. Intravoxel incoherent motion (IVIM) often require multiple b values with multiple averages that give rise to prolonged scan time. In this work, deep learning reconstruction is used to reduce the overall IVIM scan time. Based on qualitative and quantitative analysis, deep learning reconstruction may significantly improve the results of IVIM and make an abbreviated IVIM feasible.Introduction
Intravoxel incoherent motion (IVIM) model allows a bi-exponential decay model through the acquisition of multiple diffusion sensitive factors (b value) to map diffusion (D; diffusion coefficient) and perfusion-related parameters (F; perfusion fraction and D*; pseudo-diffusion coefficient), and has been widely applied in different anatomies 1-5. The construction of IVIM requires multiple b values with multiple averages to achieve sufficient SNR that give rise to prolonged scan time. Deep learning (DL) reconstruction may improve the SNR over conventional reconstruction methods and hence reduce the needs of multiple averages used in IVIM. In this work, we investigate the use of DL reconstruction and to build an abbreviated IVIM model that only one average is used, compare the results with conventional IVIM protocol.Methods
A total of 25 healthy subjects were prospectively recruited (13 males and 12 females; age range: 34 to 67 years, mean: 51.24±10.72 years). None of the subjects had organic brain lesions. MRI examinations were performed using a 3.0 T MRI system (SIGNA Premier, GE Healthcare) with a 48-channel head coil. An abbreviated IVIM protocol (TR/TE = 5000 ms/87 ms, 256×256 matrix, 4-mm slice thickness) with 13 b-values (b= 0, 15, 30, 50, 100, 150, 200, 400, 600, 800, 1000, 1200 and 1500 s/mm2) and single average was performed. Deep learning reconstruction was performed (DL_IVIM). Conventional IVIM acquisition with multiple averages (when b>1000) was also performed as a comparison (ORI_IVIM), The scan time of DL_IVIM and ORI_IVIM were 180s and 235s respectively.Measurements
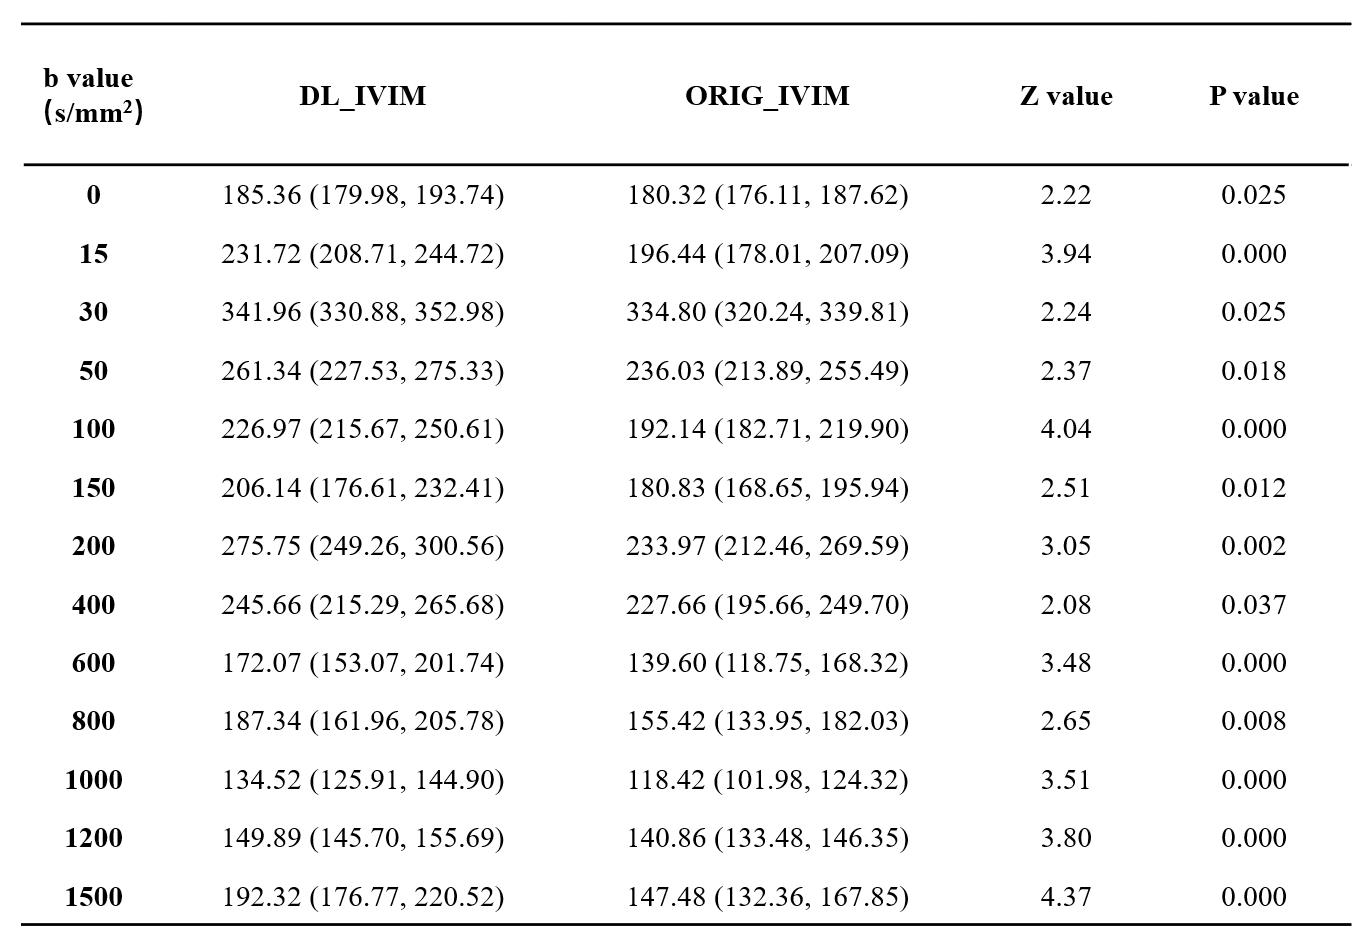
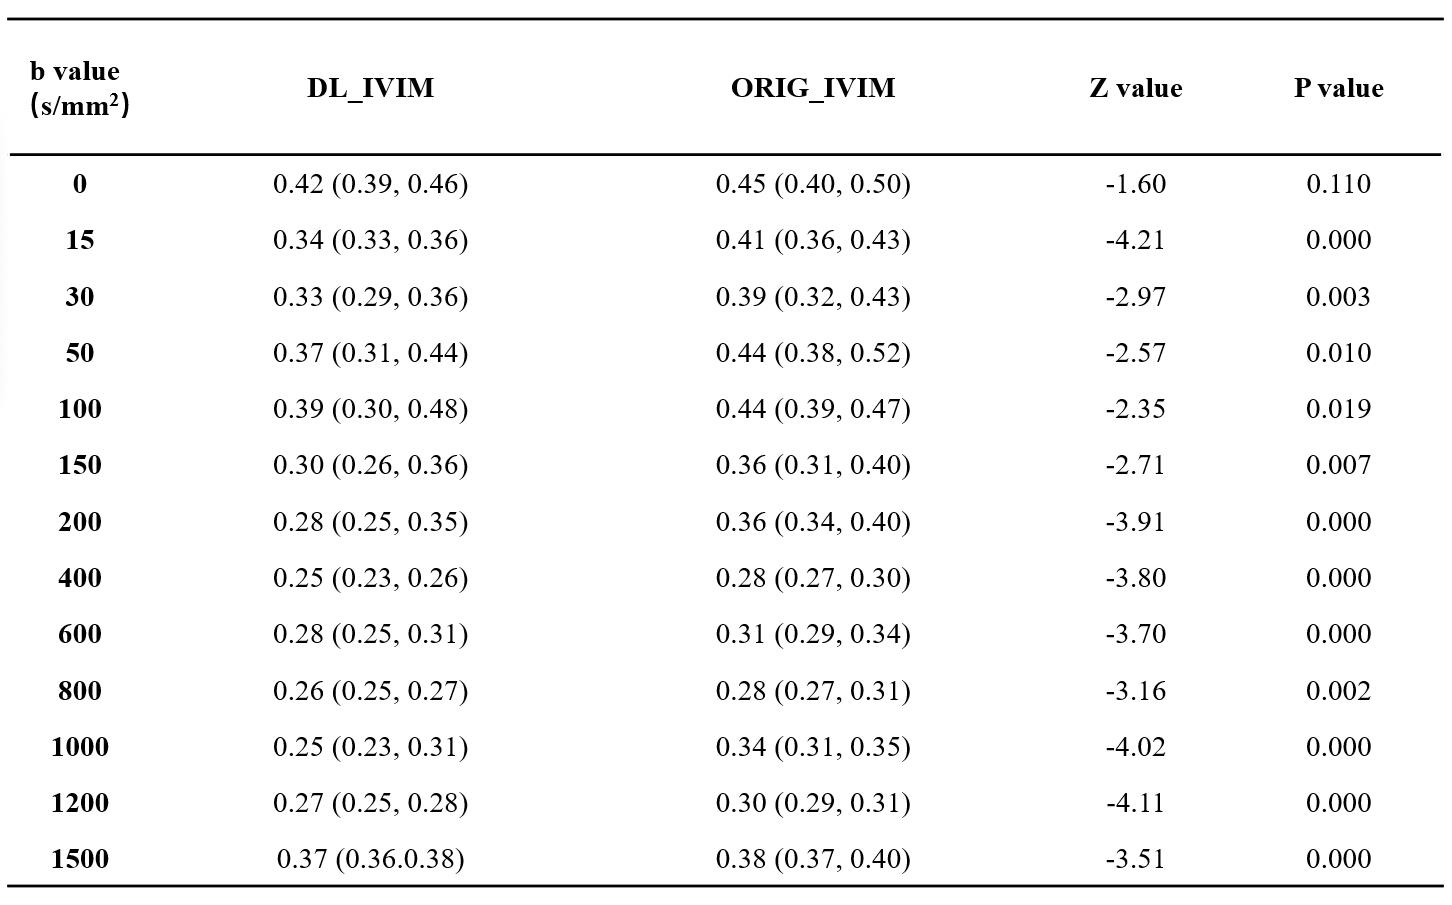
(1) Objective assessment: Signal of ratio (SNR)6 and non-uniformity index (NUI)7 of ORIG_IVIM and DL_IVIM under different b values are calculated respectively. The signal intensity (SI) was measured at the level of the third ventricle, and six areas of interest (ROI) with an area of 300mm2 were selected. The mean SI (SImean), maximum SI (SImax) and minimum SI (SImin) were obtained, respectively. The standard deviation (SD) of image noise was accessed (SDmean). The calculation formula was as follows: SNR=SImean/SDmean; NUI=(SImax-SImin)/(SImax+SImin )×100%. (2) Quantitative parameters: All IVIM data were processed to access D, D* and F map, respectively. With reference to the size and position of ROI selected by SNR and NUI, the mean value (D value, D* value and F value) of quantitative parameters of ORIG_IVIM and DL_IVIM were calculated.
Statistical analyses
Shapiro-wilk normality test was conducted for SNR, NUI, D value, D* value and F value. If normal distribution was met, paired T-test was used for comparative analysis between ORIG_IVIM and DL-IVIM. Wilcoxon rank sum test was used for non-normal distribution. P<0.05 was statistically significant.
Results
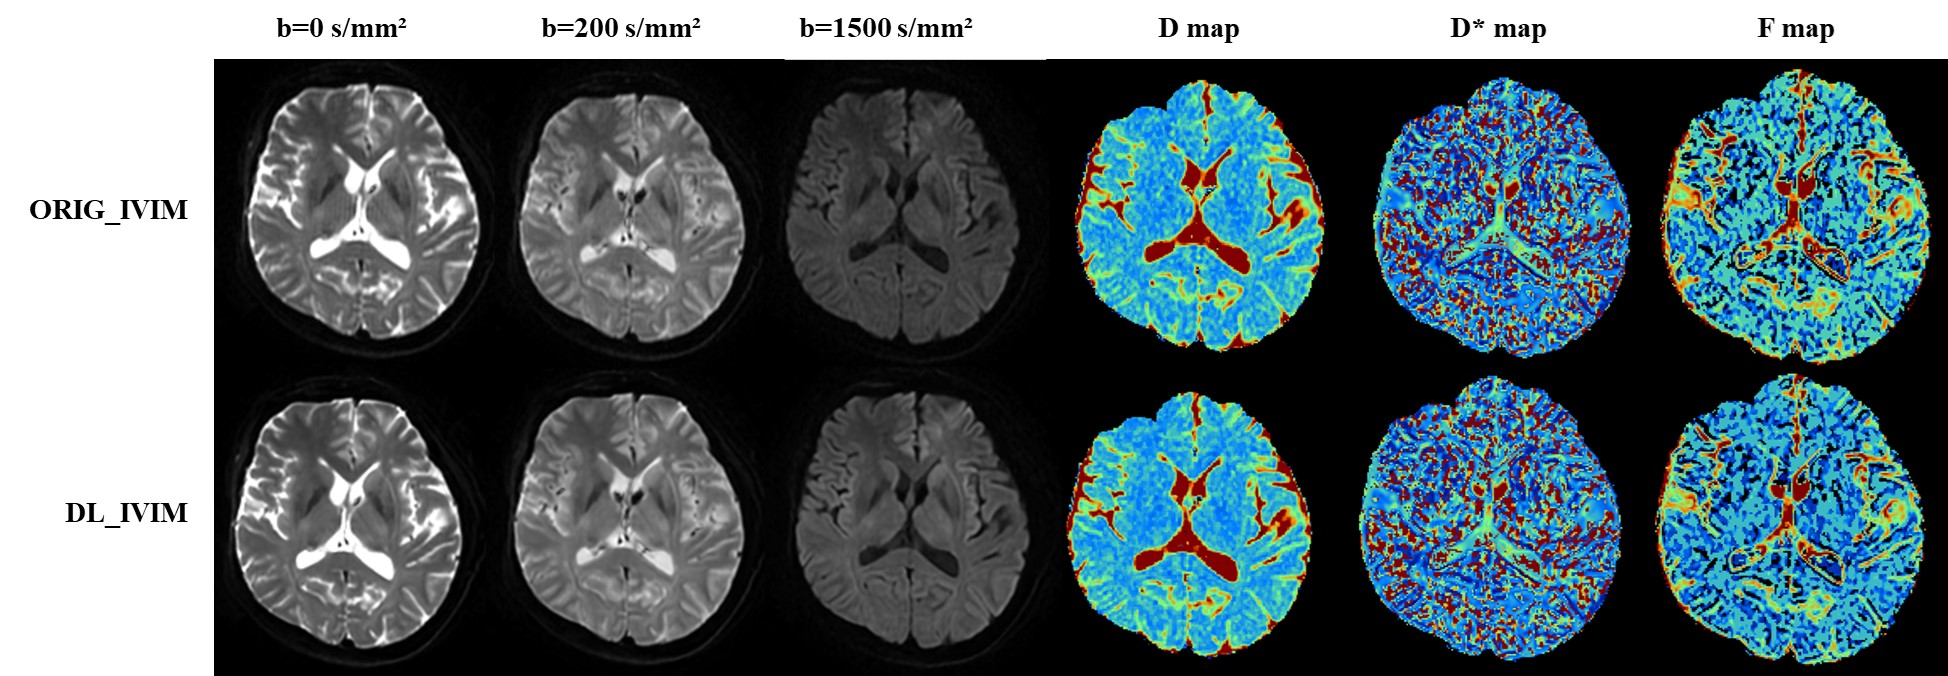
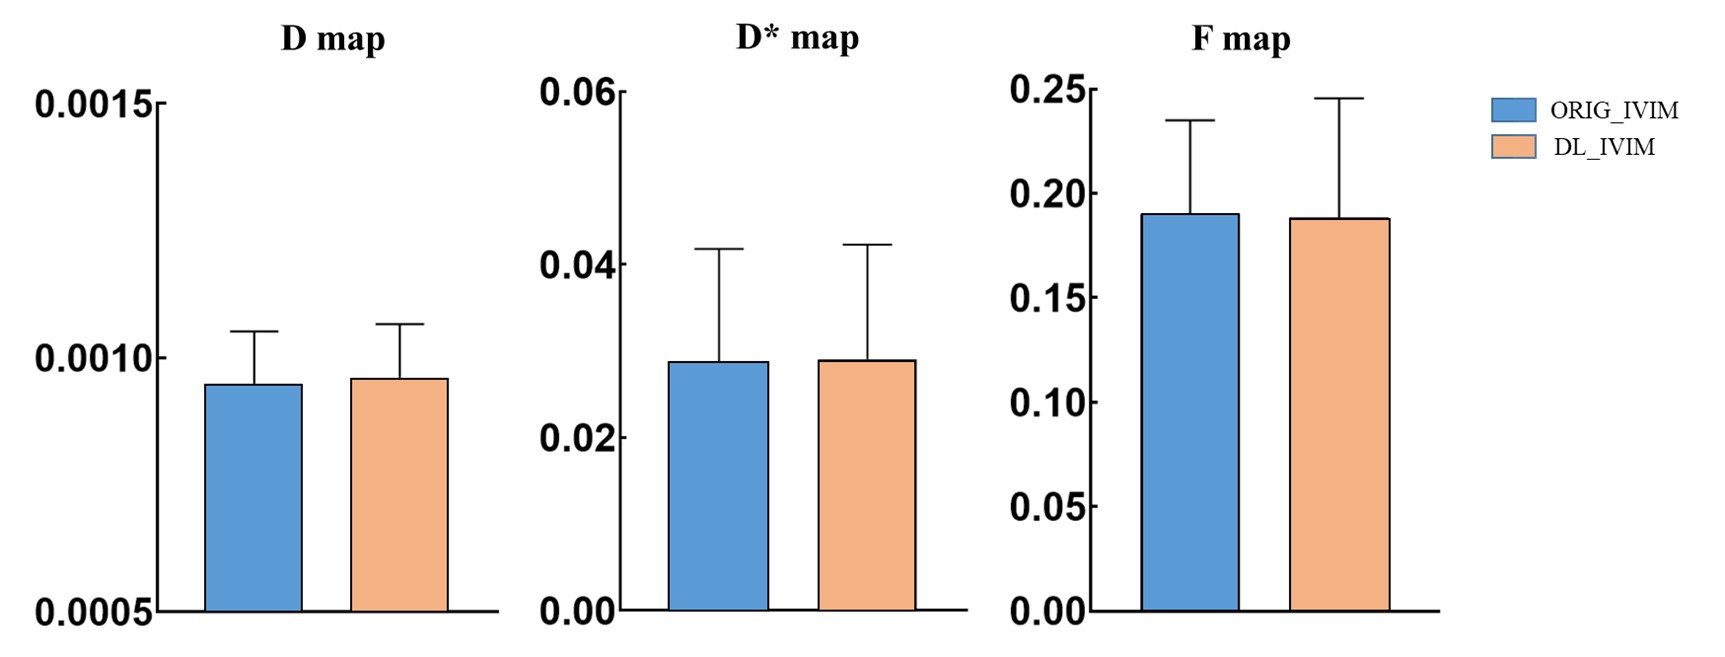
The values of SNR and NUI from typical set of images at different b values of abbreviated DL_IVIM and conventional ORI_IVIM are shown in Table 1 and Table 2 respectively. It can be seen that despite shortened scan time, the SNR of DL_IVIM is significantly higher than that of ORIG_IVIM at different b values, and NUI is significantly lower than that of ORIG_IVIM under all b values except b=0 (P<0.05). A typical set of D, D* and F maps of DL_IVIM and ORI_IVIM are also shown in Figure 1, better noise levels may be seen with DL_IVIM as in individual diffusion weighted images. The numerical parametric values are compared in Figure 2, and no differences were seen between DL_IVIM and ORIG_IVIM (P>0.05) despite the scan time difference.Discussion & Conclusion
Deep learning reconstruction improves the image SNR which may be translated to reduced scan time. Diffusion models such as IVIM is built upon the compositions of multiple b value diffusion images, the use of deep learning reconstruction may enable an abbreviated IVIM protocol where the number of b values and/or number of averages is reduced. In this work, it was seen that despite moderate reduction in scan time, higher SNR was obtained with DL reconstructed images and IVIM models, and the accuracy of IVIM parameters was maintained. Deep learning reconstruction may be further exploited to translate IVIM into clinical routine practice.Acknowledgements
No acknowledgement found.References
1. Le Bihan D. What can we see with IVIM MRI. Neuroimage. 2019;187:56-67.
2. Fournet G, Li JR, Cerjanic AM et al. A two-pool model to describe the IVIM cerebral perfusion. J Cereb Blood Flow Metab. 2017;37(8):2987-3000.
3. Zhang J, Suo S, Liu G, et al. Comparison of Monoexponential, Biexponential, Stretched-Exponential, and Kurtosis Models of Diffusion-Weighted Imaging in Differentiation of Renal Solid Masses. Korean J Radiol. 2019;20(5):791-800.
4. Lecler A, Duron L, Zmuda M, et al. Intravoxel incoherent motion (IVIM) 3 T MRI for orbital lesion characterization. Eur Radiol. 2021;31(1):14-23.
5. Wu G, Xie R, Liu X, et al. Intravoxel incoherent motion diffusion MR and diffusion kurtosis imaging for discriminating atypical bone metastasis from benign bone lesion. Br J Radiol. 2019; 92(1100): 20190119.
6.Eichner C, Paquette M, Mildner T, et al. Increased sensitivity and signal-to-noise ratio in diffusion-weighted MRI using multi-echo acquisitions. Neuroimage. 2020; 221: 117172.
7. Ogasawara G, Inoue Y, Matsunaga K, et al. Image Non-Uniformity Correction for 3-T Gd-EOB-DTPA-Enhanced MR Imaging of the Liver. Magn Reson Med Sci. 2017;16(2):115-122.
Figures