4920
Deep learning based estimation of patient anthropometric data for intelligent scan planning in MR1GE Healthcare, Bengaluru, India
Synopsis
Keywords: Machine Learning/Artificial Intelligence, Data Analysis
Estimating patient height and weight is used to determine the optimum SAR (Signal Modelling) for the patient. We used a deep learning approach to first generate the point cloud of the person (Data Processing) followed by prediction of the height and weight (Data Analysis). This tackles the problems of heavy occlusion which occurs in the MR imaging scenario in the form of coils/blankets and different positions in which the patient will be placed. We achieved a MAE score of 4.9 cm on the height and 6.2 kg on the weight. This is a promising solution to an important problem.Introduction
MR lab technicians have to ascertain the right SAR value for patients using their height and weight data. This often leads to errors, especially when the technicians are fatigued. Present approaches to address this problem involve manual measurement of this data, which cannot be done for trauma and critically ill patients. Getting this data from Electronic Health Records (EHRs) is not feasible as they aren't integrated with the radiology workflow a majority of the time. There are some other techniques which involve some approximation techniques, but they aren't very accurate, nor fully automated.A high SAR value will lead to increased tissue temperatures which can cause heat induced injuries. A low SAR value will require rescans, increasing the time taken to scan a single patient and decreasing the throughput, i.e. fewer patients can be scanned in a given time period.The successful deployment of this technique will lead to fewer mistakes from the technician's side especially if they are fatigued. It will reduce the the costs associated with rescans and increase the throughput, i.e., more patients can be scanned in a day.
Previous work
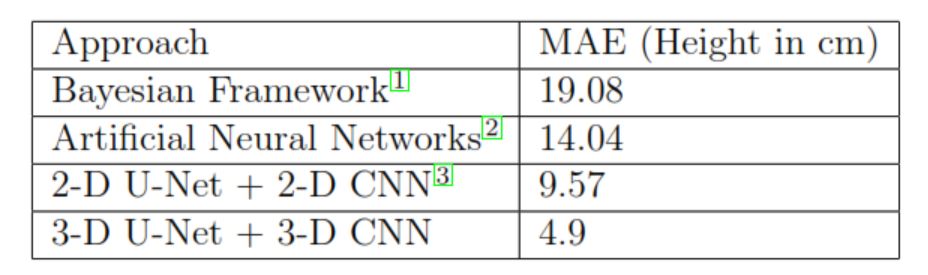
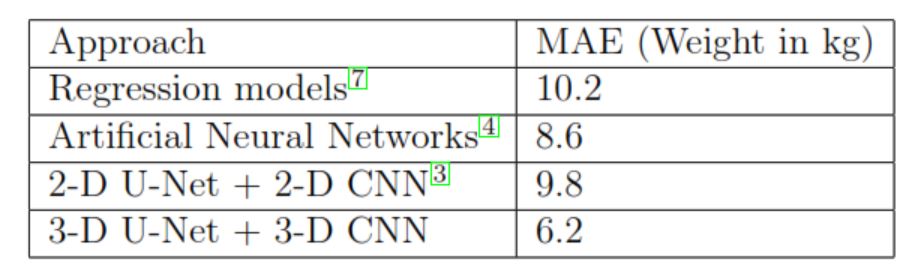
BenAbdelkader et al.1 have used a Bayesian like framework for predicting height giving results slightly better than random guessing of the population mean. Finocchiaro et al.2 have used Neural Networks and basic Convolutional Neural Networks (CNNs) to estimate the height of a person. However they achieved a MAE of 15 cm which is too high for the MR use case. Altigne et al.3 have used a 2-D U-Net to predict the weight, achieving a MAE of 10kg which is quite high for the MR scenario. Pfitzner et al.4 have used neural networks to predict the weight, but don’t account for occlusions. None of these techniques take into account the occlusion scenario, where a patient will be covered with coils and blankets. This is critical to the MRI domain, as all scans take place with their selected protocols and corresponding coils. Another key aspect that isn’t addressed is the different positions such as lateral, left supine, right supine which adds a layer of complexity to the camera based approach.Method
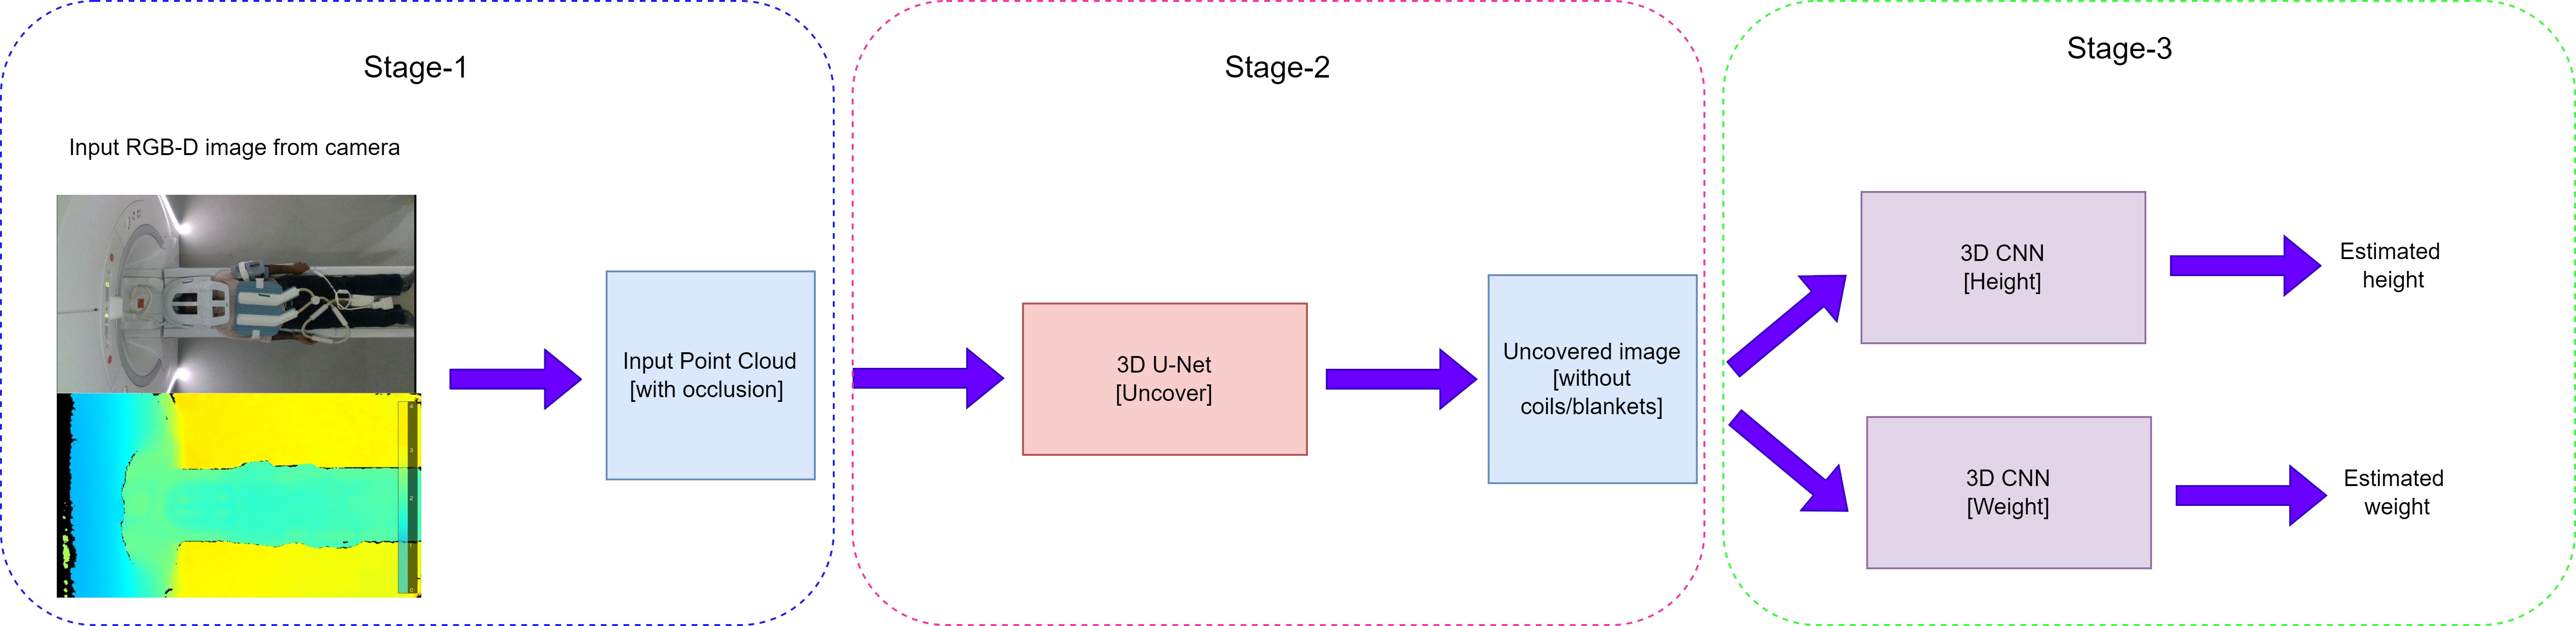
Proposed Solution:- Stage 1: Convert the input RGB-D image of the patient acquired by the camera into a 3-D point cloud composed of voxels (along with the occlusions).
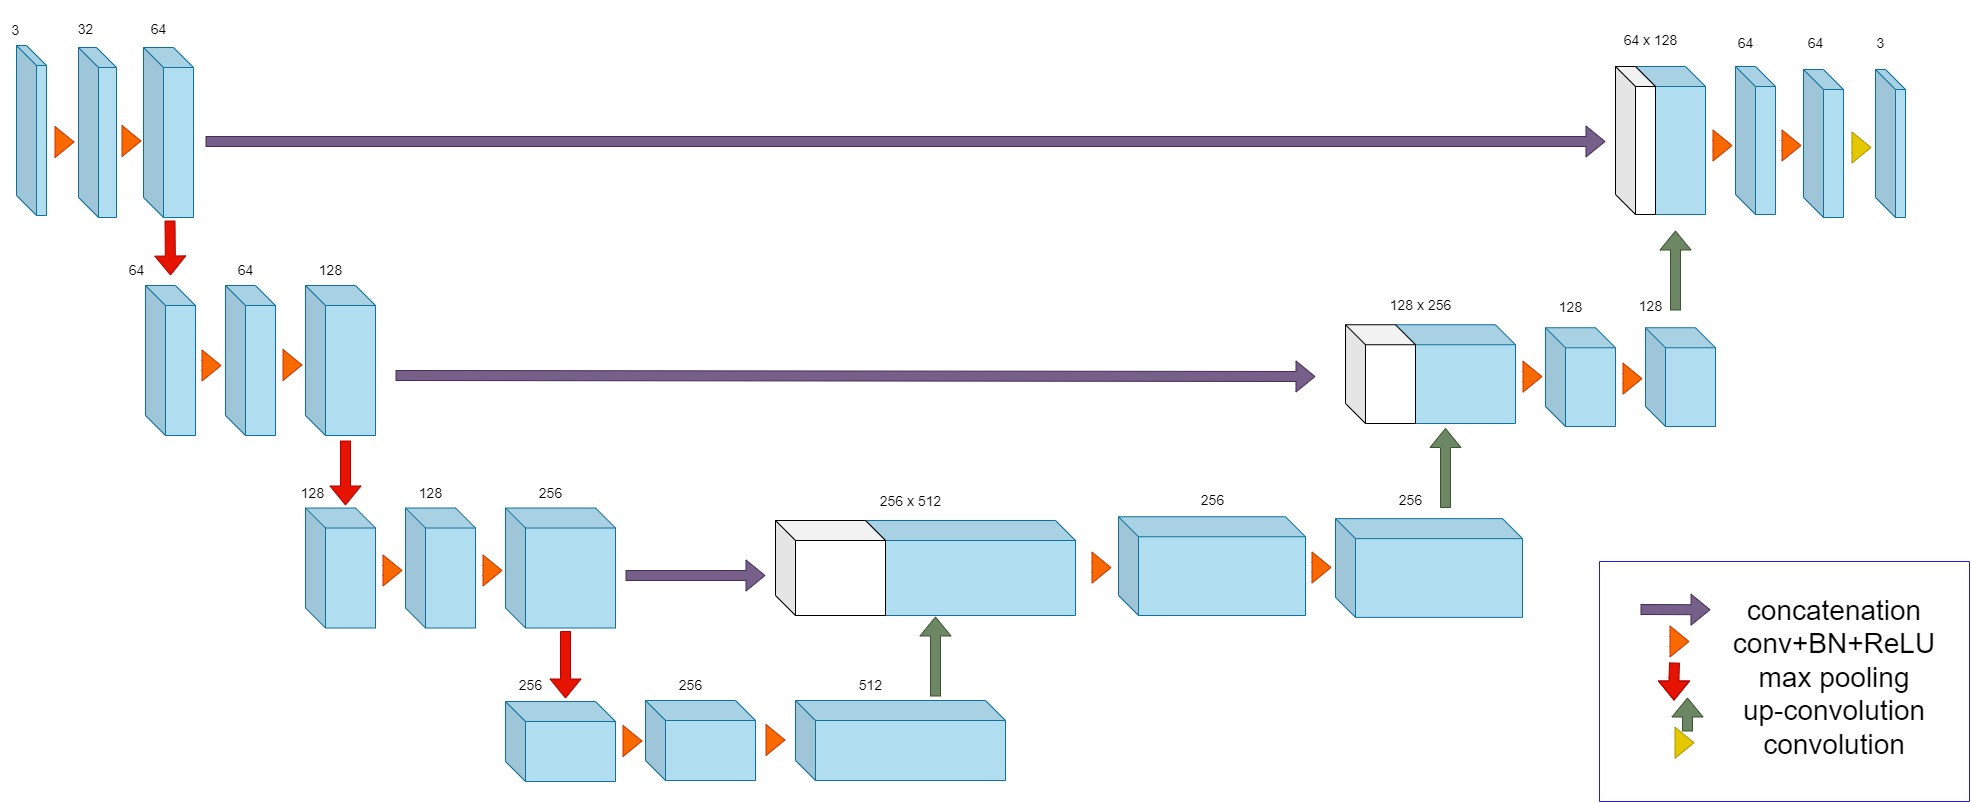
- Stage 2: Detect the 3-D shape of the person in the form of a point cloud from the voxelized point cloud generated in the previous step. This stage will remove any occlusions such as coils/blankets and will work for different positions.
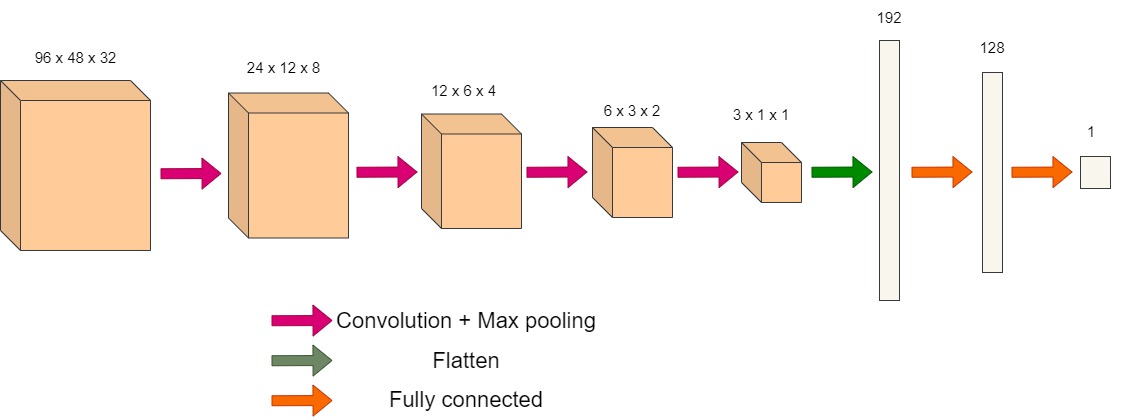
- Stage 3: Two 3-D CNNs will take the 3-D shape of the person (without occlusions) as input and generate the estimated height and weight respectively.
The second network is a 3-D CNN. It is composed of 4 convolution layers followed by 2 fully connected layers. Two models are used for each of the tasks of weight and height estimation. The training was carried out in three steps. First the uncovering model (3-D U-Net) was trained, using ground truth point clouds of the people which had been obtained without occlusion. This was followed by training the weight 3-D CNN, with the ground truth as the weight. Finally the height 3-D CNN, with the ground truth as the height of the person. We used the same network for both height and weight estimation from the point cloud of the uncovered person. This is because we observed a good performance and would be able to optimize the solution better.
For each of the training runs, we used the SLP dataset which was graciously provided to us by Sarah Ostadabbas and her team6.
Results and Discussion
We achieved a MAE score of 4.9 cm on the height and 6.2 kg on the weight. This is across all positions and all occlusions. In the case where there is no occlusion (just before the coils are placed/blankets are wrapped) we get a MAE of 3 kg for the weight and a MAE of 3.2 cm for the height. Considering the difficulty of the task under the constraints of occlusion and different poses, the accuracy is quite close to that of a human being. A detailed description is provided in the figures attached.This work is very relevant in the context of automating the pre-scan readiness workflow for the Magnetic Resonance (MR) domain. It will help the MR system arrive at precise conclusions of the SAR value to be administered to the patient. This is especially important in the case of trauma patients.
Acknowledgements
No acknowledgement found.References
1. C BenAbdelkader, R Cutler, and L Davis. Stride and cadence as a bio-metric in automatic person identification and verification. In Proceedings of Fifth IEEE international conference on automatic face gesture recog-nition, pages 372–377. IEEE, 2002.
2. J Finocchiaro, AU Khan, and Ali Borji. Egocentric height estimation. In 2017 IEEE Winter Conference on Applications of Computer Vision(WACV), pages 1142–1150. IEEE, 2017.
3. CY Altinigne, D Thanou, and R Achanta. Height and weight estimationfrom unconstrained images. In ICASSP 2020-2020 IEEE International Conference on Acoustics, Speech and Signal Processing (ICASSP), pages2298–2302. IEEE, 2020.
4. C Pfitzner, S May, and A N ̈uchter. Evaluation of features from rgb-d data for human body weight estimation. IFAC-Papers OnLine, 50(1):10148–10153, 2017.
5. O Cicek, A Abdulkadir, SS Lienkamp, T Brox, and O Ronneberger. 3d u-net: learning dense volumetric segmentation from sparse annotation. In International conference on medical image computing and computer-assisted intervention, pages 424–432. Springer, 2016.
6. S Liu, Xiaofei H, N Fu, and et al. Simultaneously-collected multimodal lying pose dataset: Towards in-bed human pose monitoring under adverse vision conditions. arXiv preprint arXiv:2008.08735, 2020.
7. TV Nguyen, J Feng, and S Yan. Seeing human weight from a single rgb-d image. Journal of Computer Science and Technology, 29(5):777–784,2014.
Figures