4914
Multimodal MRI radiomics for identifying true tumor recurrence and treatment-related effects in postoperative glioma patients1Department of MR, The First Affiliated Hospital of Xinxiang Medical University, Weihui, China, 2GE Healthcare, MR Research China, Beijing, China
Synopsis
Keywords: Machine Learning/Artificial Intelligence, Radiomics
Detecting true tumor recurrence and treatment-related effects in glioma after treatment is crucial for patient managements and challenging via conventional MRI for differentiation. Radiomics can be used to access the details in the images in an objective way. We constructed models based on multiple modalities by using radiomics features of the postoperative enhanced and edematous regions to find key features for identifying true tumor recurrence. Features from CE-T1WI and enhanced regions have excellent classification performance, and the model of multimodality with whole regions is the best, which may aid clinicians in developing individualized treatment strategies.Introduction
Patients treated with radiotherapy or concurrent chemoradiotherapy after glioma surgery can encounter the change the permeability of the blood-brain barrier, resulting in contrast leakage and, thus varying degrees of enhancement or occupancy at contrast-enhanced T1-weighted image (CE-T1WI)1. Notably, depending on such enhancement patterns, it remains challenging to differentiate true tumor recurrence (TuR) and treatment-related effects (TrE), let alone to identify early recurrence or malignant transformation, regardless the fact that the two corresponding treatments are distinctive2. However, multimodal radiomics features can potentially be used to identify TuR in glioma3,4. We evaluated the performance of different sequences in recognizing recurrence status based on radiomics features extracted from postoperative enhancement (PoE) and edematous (ED) areas during daily follow-up.Methods
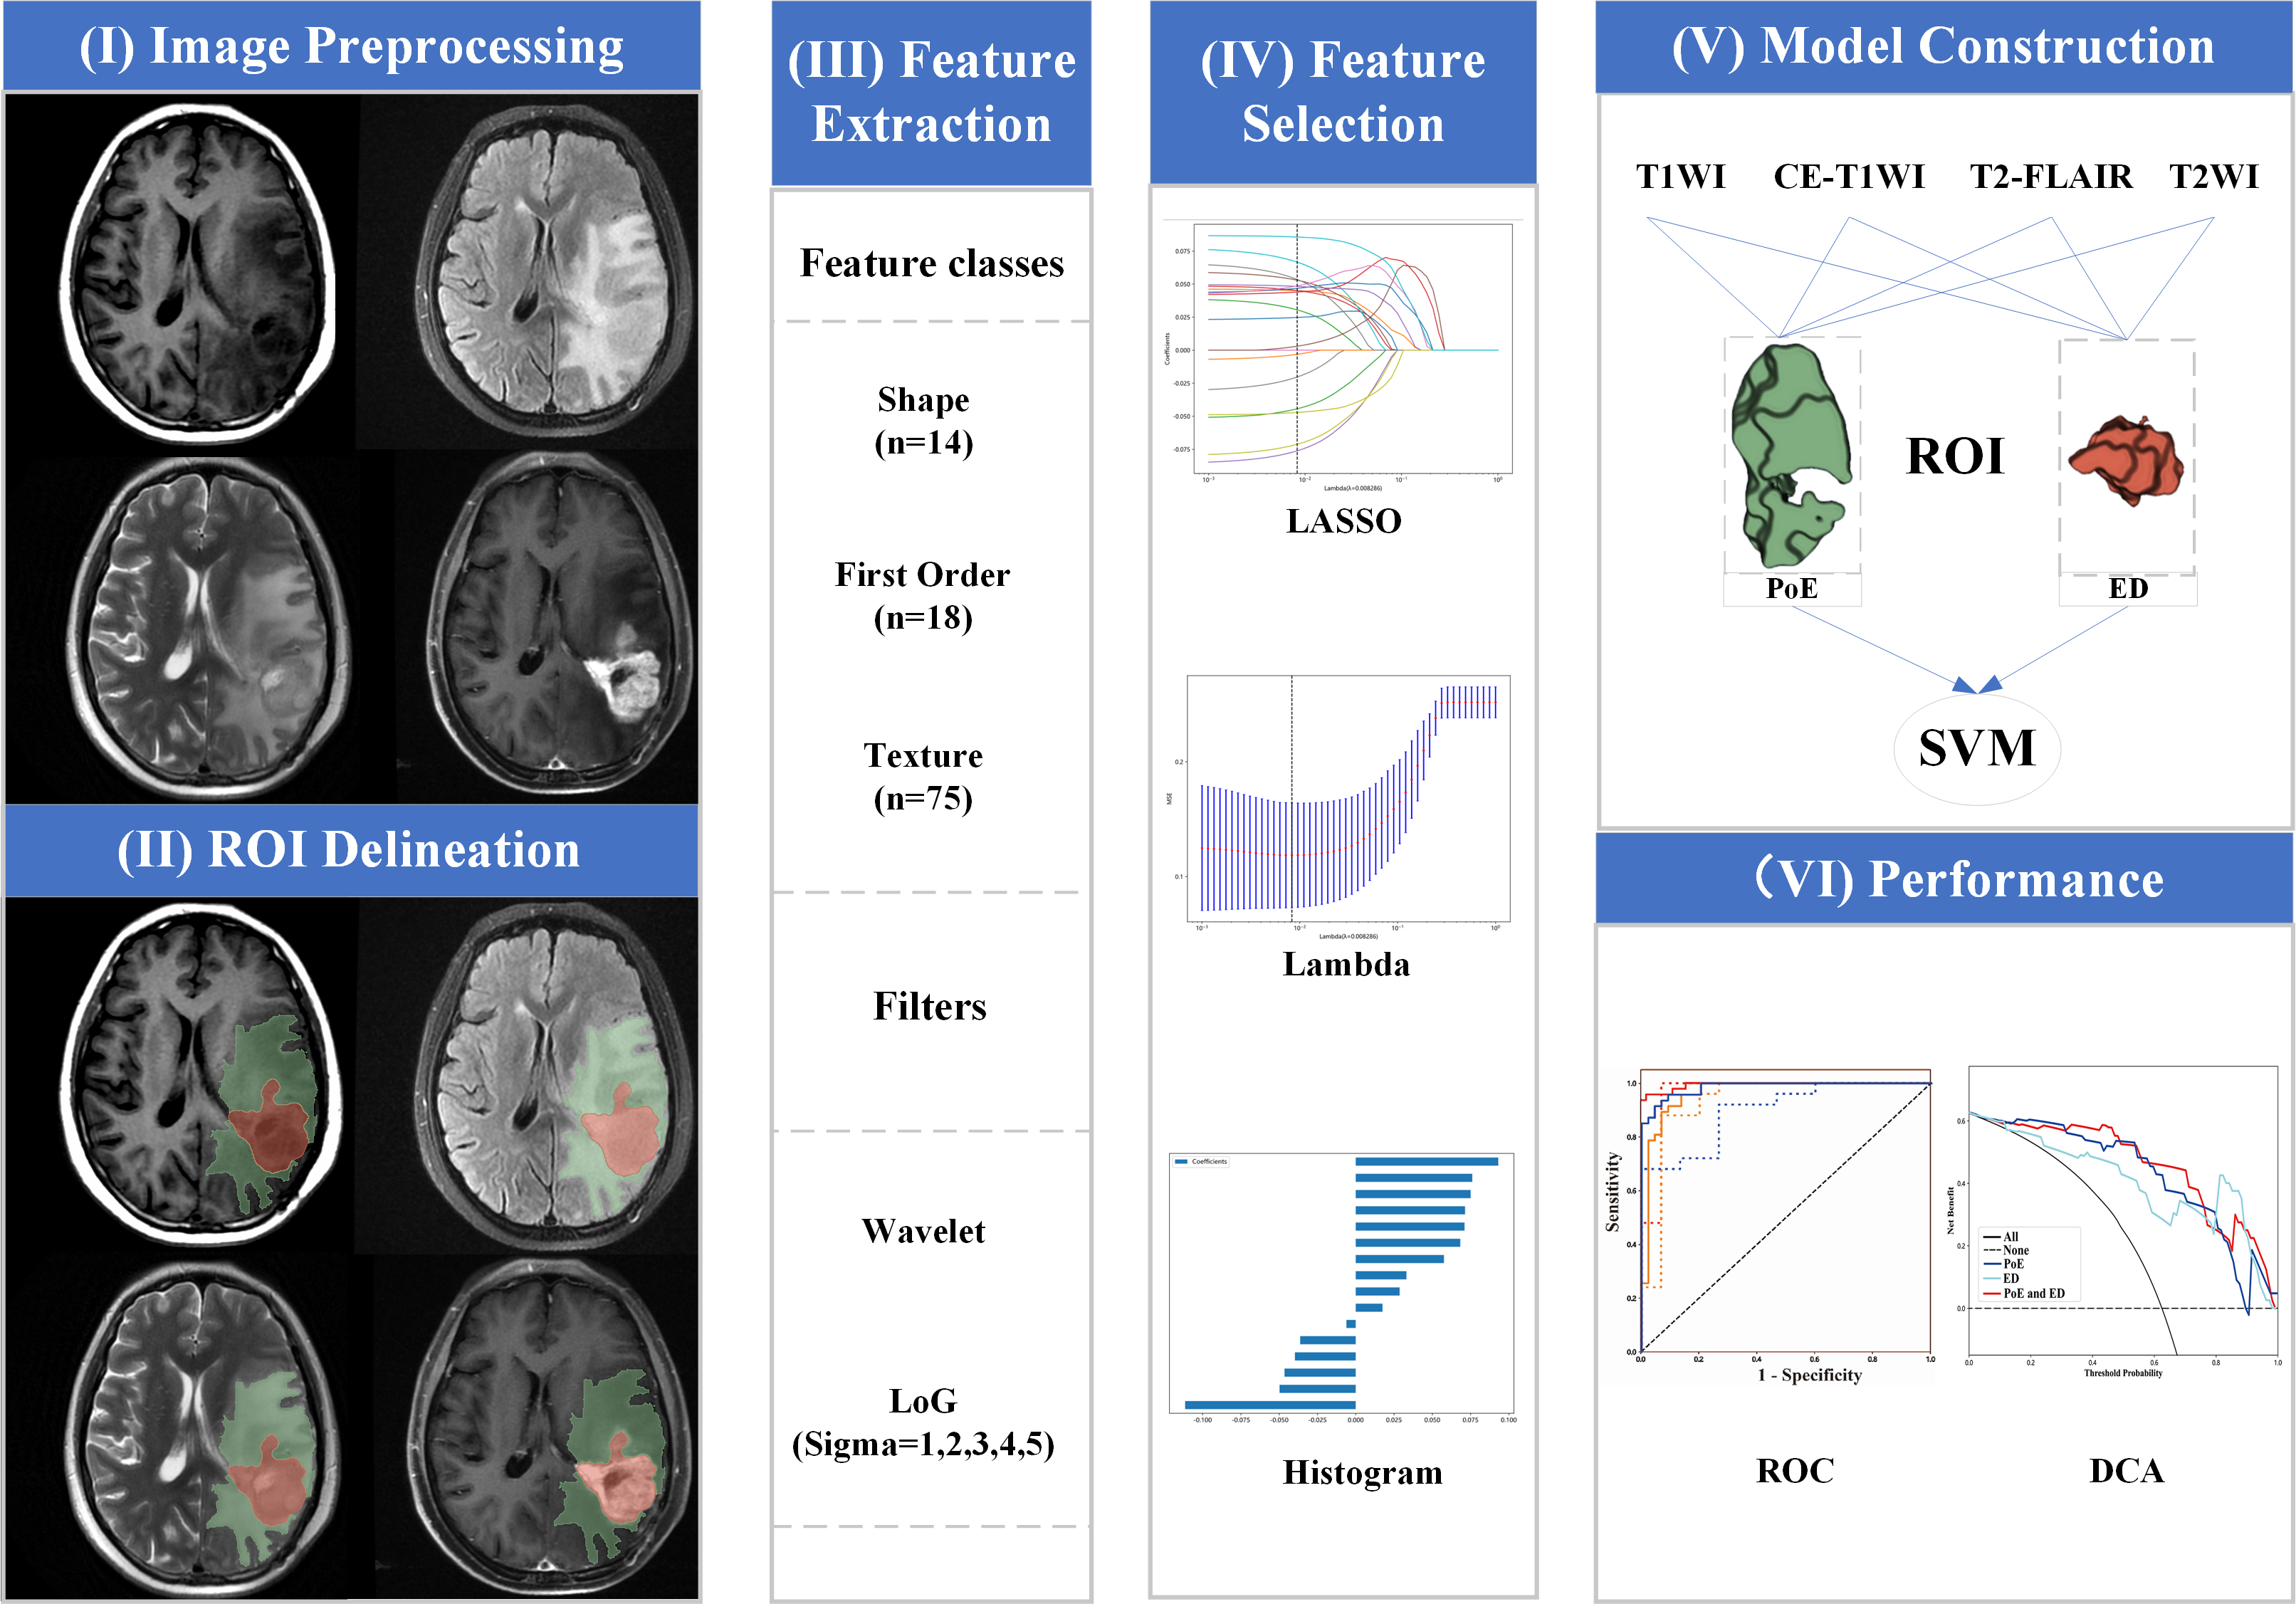
A total of 131 patients were enrolled in the primary cohort and randomly divided into the training set (N=91) and the test set (N=40), then their data were proceeded as the workflow in Fig.1. Radiomics features were extracted from the postoperative enhancement (PoE) region and adjacent edema (ED) region from four routine MRI sequences, including T1-weighted image (T1WI), T2-weighted image (T2WI), T2-weighted fluid attenuated inversion recovery (T2-FLAIR) and CE-T1WI. After analyses of intraclass correlation coefficient, Spearman's rank correlation coefficient, and least absolute shrinkage and selection operator, the key radiomics features were selected and subsequently utilized to construct Support Vector Machine (SVM) models. Decision curve analysis (DCA) and receiver operating characteristic (ROC) curves were used to analyze the performance in the test set.Results
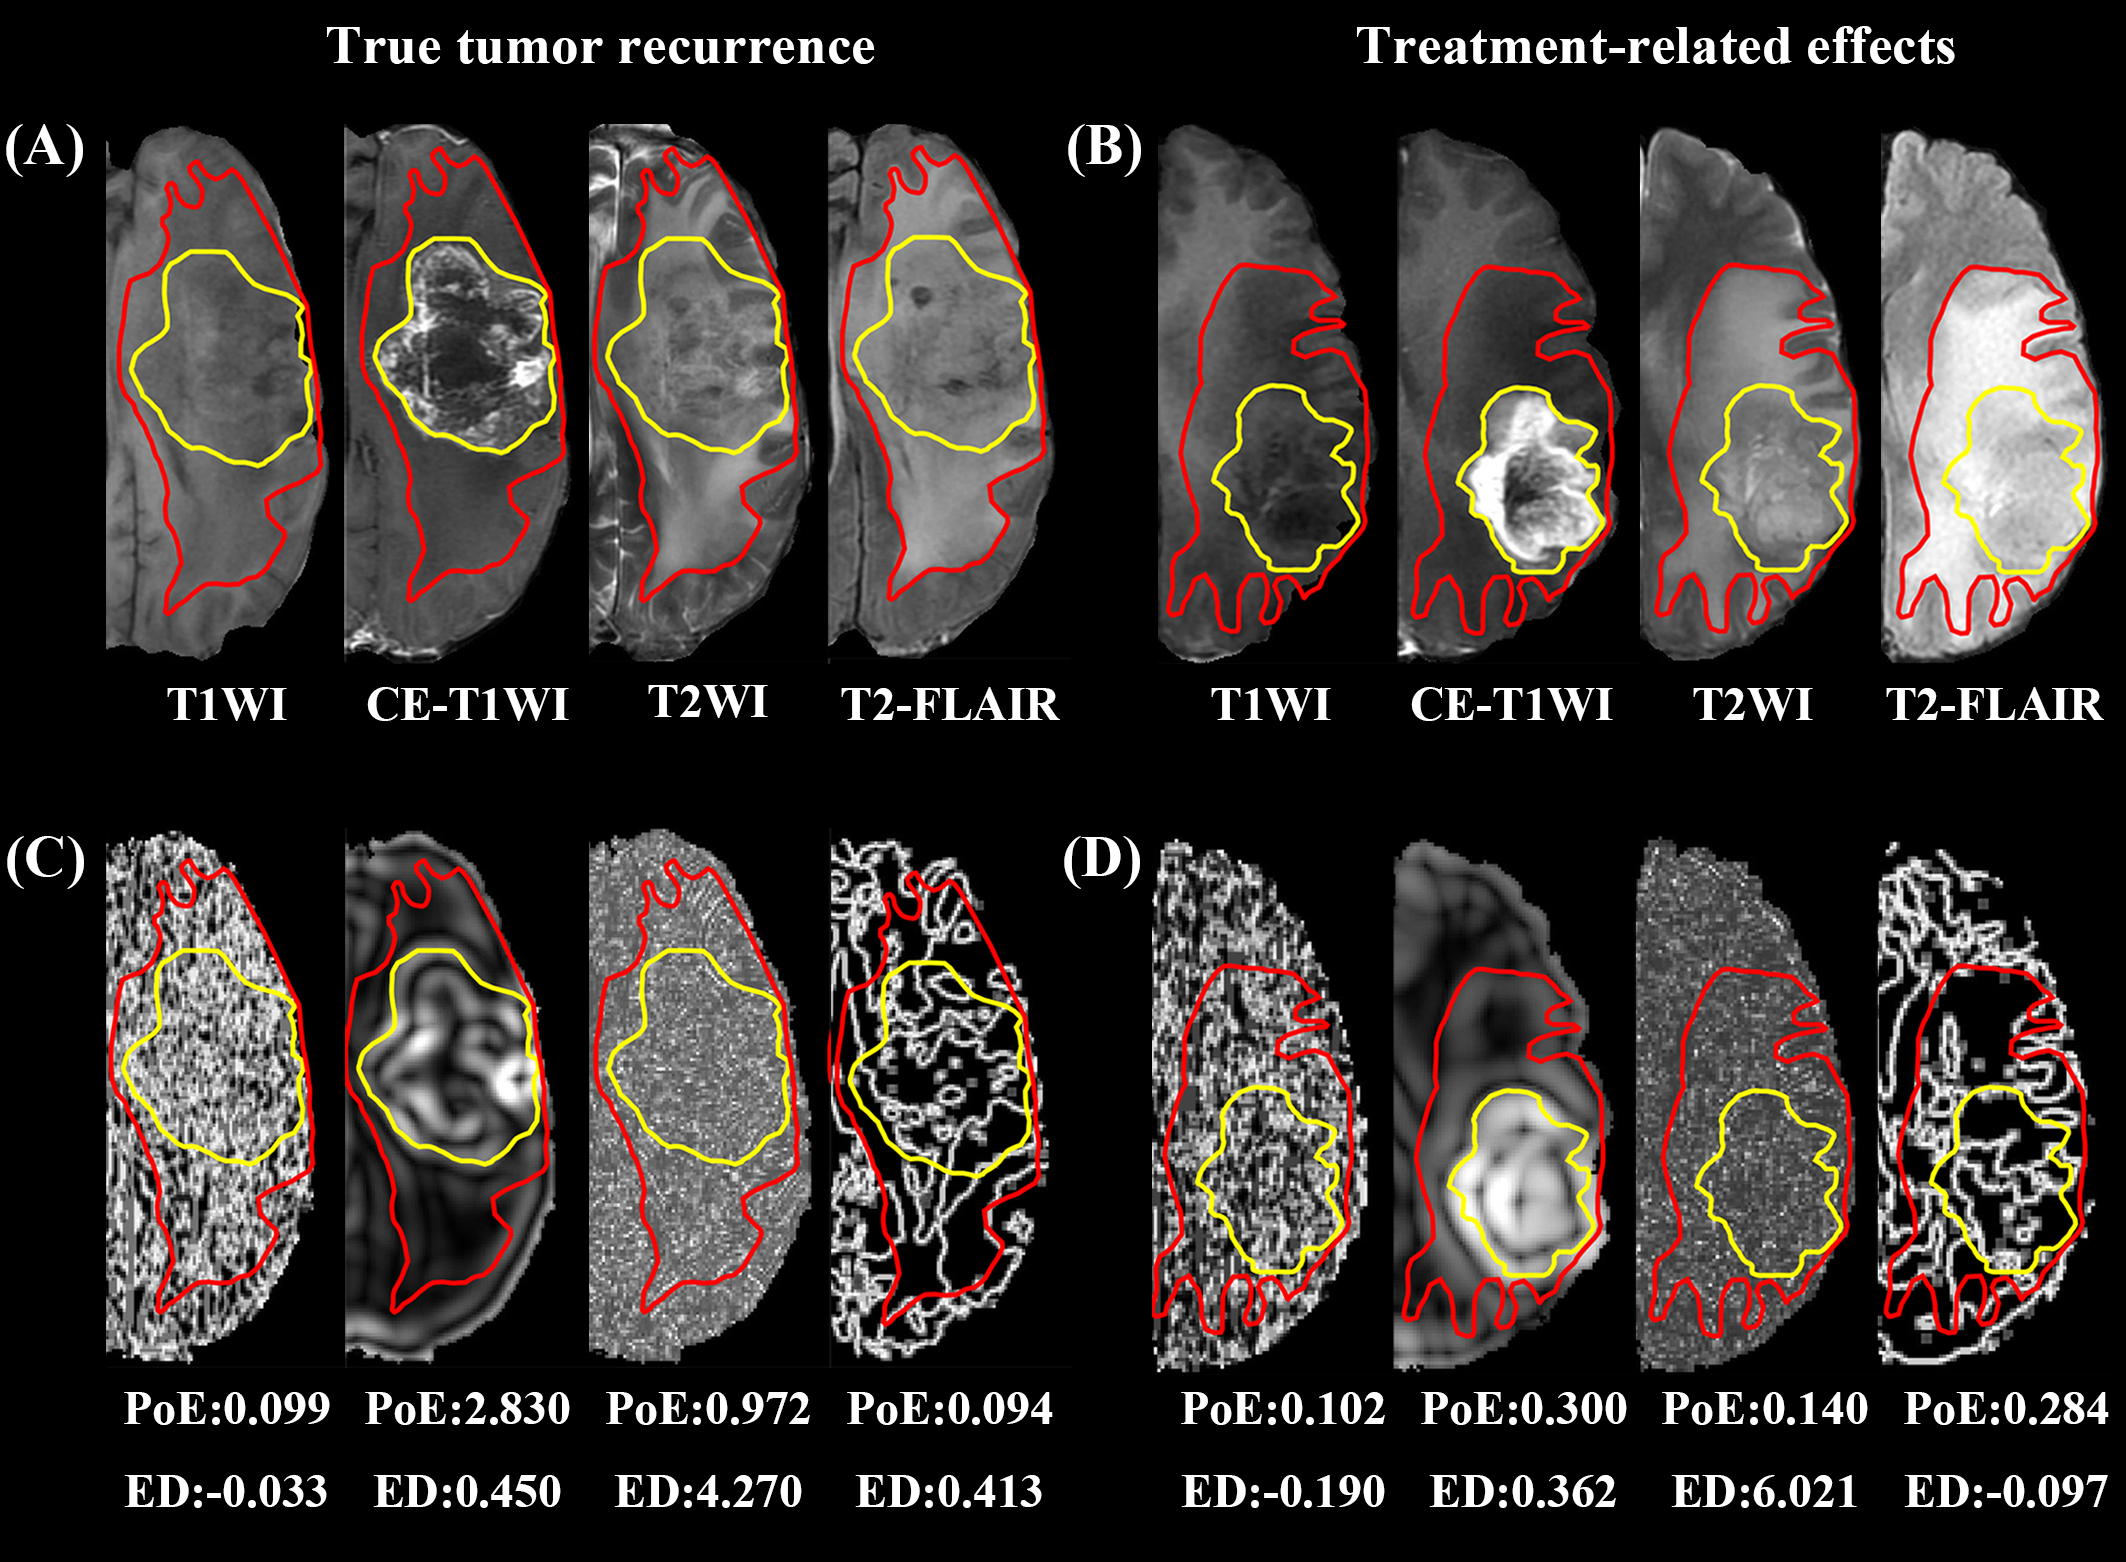
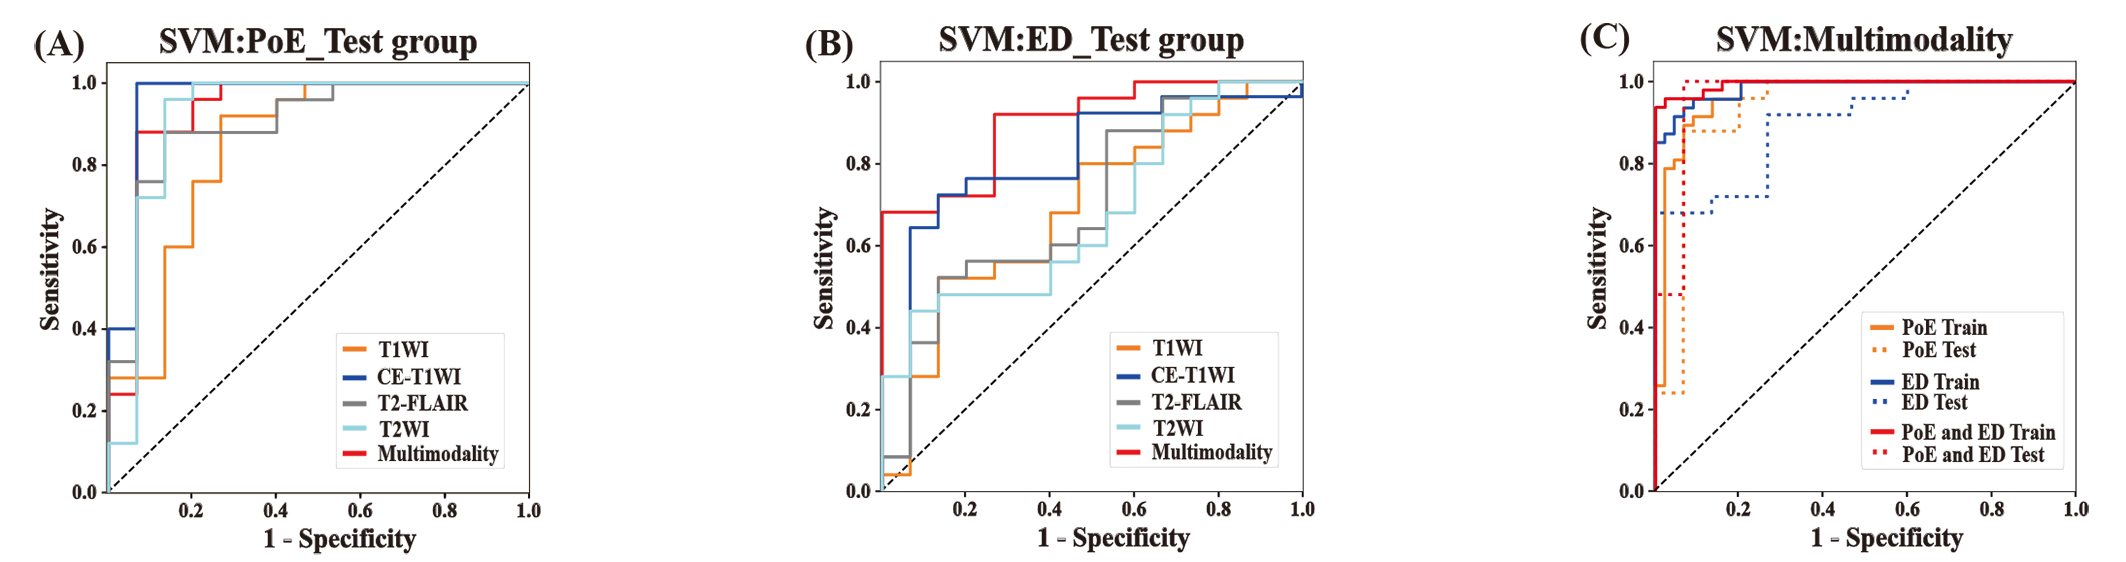
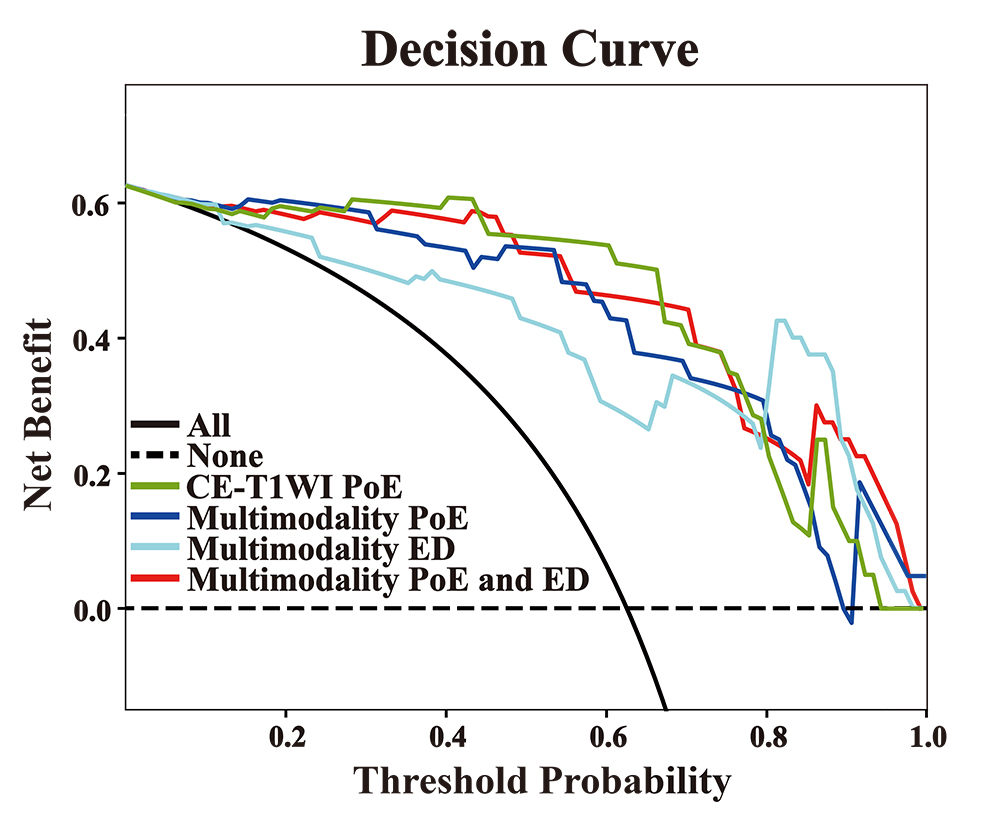
After feature selection, a dataset with 72 key radiomics features that consist of 38 features from the PoE area and 34 from the ED area was obtained. We found that the model with features from the PoE and ED region (Fig.2) could be used to well distinguish TuR from TrE. In the ROC analyses, the area under the curve (AUC) of the PoE region model was higher than that of the ED region model (P < 0.05). Among the models constructed with a single sequence, the model using PoE regional features from CE-T1WI (Fig.3A) was superior to other models (Fig.3B), with an AUC of 0.960 for SVM. In multimodality models, PoE features outperform ED features with an AUC of 0.931. When combining four MRI sequences and all regional features, a slightly better performance was achieved with an AUC of 0.965 (Fig.3C). The DCA indicated that if the threshold probability of clinical decision was greater than 0.05, all models added more benefit than the scheme of treat-none or treat-all-patients. When the threshold probability was over 0.31 for identifying TuR, the multi-region model brought more benefit than either the PoE or ED model alone in most cases (Fig.4). The model based on features of CE-T1WI from PoE region was outstanding and in most time was even better than multimodality model of the whole region when the threshold probability was less than 0.8, while the latter was way better when the threshold probability was greater than 0.8.Discussion
Our study demonstrates that it is possible to identify recurrence using the radiomics features of the edema area despite the commonly acknowledged PoE area. This result confirmed the hypothesis that the texture information of the edema area could potentially provide valid information for detecting TuR. However, the classification performance of the model constructed based on the features from edema region was inferior to that of the PoE region. When combined four MRI sequences and all regional features together, the model showed a slightly better performance than based on PoE regional features from CE-T1WI. The features of the PoE region from CE-T1WI can fully reflect the course of angiogenesis within the tumor. This may help to reveal the differences between TuR and TrE pathologically. Additionally, the DCA analysis showed that the CE-T1WI model of PoE region and multimodality model of whole region had better clinical utility and resulted in a higher net benefit to patients in clinical decision making. It may assist postoperative glioma patients with risk stratification and survival prediction, which is consistent with previous findings. Furthermore, by merging the multimodality imaging features of MRI, the best features from each sequence were chosen independently to ensure a comprehensive modeling. Global textural features were also used, which may reflect the heterogeneity and aggressiveness of the tumor. In both the training and test sets, our model is able to adequately distinguish between TuR and TrE, and has diagnostic robustness. This allows clinicians to identify patients who are most likely to benefit from additional surgery.Conclusion
Multimodality radiomics models from both PoE and ED regions have the best performance in identifying TuR and TrE, potentially aiding clinical decision-making for individualized treatment. Features from CE-T1WI and enhanced regions have excellent classification performance in comparison with features from other sequences in PoE or ED regions. And edematous regions can provide useful information for recognizing recurrence.Acknowledgements
No acknowledgement found.References
1. Sharma, H. S.; Muresanu, D. F.; Castellani, R. J.; Nozari, A.; Lafuente, J. V.; Tian, Z. R.; Sahib, S.; Bryukhovetskiy, I.; Bryukhovetskiy, A.; Buzoianu, A. D.; Patnaik, R.; Wiklund, L.; Sharma, A., Pathophysiology of blood-brain barrier in brain tumor. Novel therapeutic advances using nanomedicine. International review of neurobiology 2020, 151, 1-66.
2. Salvati, M.; Pesce, A.; Palmieri, M.; Floriana Brunetto, G. M.; Santoro, A.; Frati, A., The Role and Real Effect of an Iterative Surgical Approach for the Management of Recurrent High-Grade Glioma: An Observational Analytic Cohort Study. World neurosurgery 2019.
3. Shim, K. Y.; Chung, S. W.; Jeong, J. H.; Hwang, I.; Park, C. K.; Kim, T. M.; Park, S. H.; Won, J. K.; Lee, J. H.; Lee, S. T.; Yoo, R. E.; Kang, K. M.; Yun, T. J.; Kim, J. H.; Sohn, C. H.; Choi, K. S.; Choi, S. H., Radiomics-based neural network predicts recurrence patterns in glioblastoma using dynamic susceptibility contrast-enhanced MRI. Scientific reports 2021, 11 (1), 9974.
4. Chougule, T.; Gupta, R. K.; Saini, J.; Agrawal, S.; Gupta, M.; Vakharia, N.; Singh, A.; Patir, R.; Vaishya, S.; Ingalhalikar, M., Radiomics signature for temporal evolution and recurrence patterns of glioblastoma using multimodal magnetic resonance imaging. NMR in biomedicine 2022, 35 (3), e4647.
Figures